The first layer is dedicated to data retrieval, fusion and pre-processing, the ... a domain expert who is not a specialist in data mining during the knowledge.
Intelligent Data Analysis 17 (2013) 753–769 DOI 10.3233/IDA-130605 IOS Press
753
CO PY
A methodological approach to mining and simulating data in complex information systems Marina V. Sokolova and Antonio Fernández-Caballero∗
Instituto de Investigación en Informática de Albacete (i3A) and Departamento de Sistemas Informáticos, Universidad de Castilla-La Mancha, Albacete, Spain
TH OR
Abstract. Complex emergent systems are known to be ill-managed because of their complex nature. This article introduces a novel interdisciplinary approach towards their study. In this sense, the DeciMaS methodological approach to mining and simulating data in complex information systems is introduced. The DeciMaS framework consists of three principal phases, preliminary domain and system analysis, system design and coding, and simulation and decision making. The framework offers a sequence of steps in order to support a domain expert who is not a specialist in data mining during the knowledge discovery process. With this aim a generalized structure of a decision support system (DSS) has been worked out. The DSS is virtually and logically organized into a three-leveled architecture. The first layer is dedicated to data retrieval, fusion and pre-processing, the second one discovers knowledge from data, and the third layer deals with making decisions and generating output information. Data mining is aimed to solve the following problems: association, classification, function approximation, and clustering. DeciMaS populates the second logical level of the DSS with agents which are aimed to complete these tasks. The agents use a wide range of data mining procedures that include approaches for estimation and prediction: regression analysis, artificial networks (ANNs), self-organizational methods, in particular, Group Method of Data Handling, and hybrid methods. The association task is solved with artificial neural networks. The ANNs are trained with different training algorithms such as backpropagation, resilient propagation and genetic algorithms. In order to assess the proposal an exhaustive experiment, designed to evaluate the possible harm caused by environmental contamination upon public health, is introduced in detail. Keywords: Complex systems, decision support systems, data mining, simulation
1. Introduction
AU
Complex and emergent information systems is an extensive field of knowledge. Generally speaking, a complex system (CS) is a composite object which consists of many heterogeneous (and, in many occasions, complex as well) subsystems [26], and incorporates emergent features that arise from interactions within the different levels. Such systems behave in non-trivial ways, originated in composite functional internal flows and structures. As a general rule, researchers face difficulties when trying to model, simulate and control complex systems. Due to these facts, it would be correct to say that one of the crucial issues of modern science is to puzzle out the CS paradigm. In fact, modeling complex systems is not ∗
Corresponding author: Antonio Fernández-Caballero, Instituto de Investigación en Informática de Albacete (i3A) and Departamento de Sistemas Informáticos, Universidad de Castilla-La Mancha, 02071, Albacete, Spain. E-mail: Antonio.Fdez@ uclm.es. c 2013 – IOS Press and the authors. All rights reserved 1088-467X/13/$27.50 �
754
M.V. Sokolova and A. Fernández-Caballero / A methodological approach to mining and simulating data Table 1 Methods for system analysis Stage System description
2
System decomposition
3
Study of subsystems
4
Integration/ Aggregation of results
Realization Expert description graphical methods, graphs, Petri nets, hierarchies, “AND-OR” and morphological trees, ontologies Criterion-based methods Heuristic approaches Alternative-based methods Hierarchical methods Problem-solving methods Data mining techniques Knowledge management tools Data fusion methods Decision building tools (hierarchical selection and composition)
CO PY
1
AU
TH OR
an easy and trivial task. Because of high complexity of CS, traditional approaches fail in developing theories and formalisms for their analysis [31]. Such a study can only be realized by a cross-sectoral approach, which uses knowledge and theoretical backgrounds from various disciplines as well as collaborative efforts of research groups and interested institutions. On the other hand, an effective approach to CS study has to follow the principles of system analysis, when we have to switch over to the abstract view of the system and perform the following flow of tasks: – Description of a system. Identification of its main properties and parameters. – Study of interconnections amongst parts of the system, which includes informational, physical, dynamical, temporal interactions, as well as the functionality of parts within the system. – Study of external system interactions with the environment and with other systems. – System decomposition and partitioning. Decomposition supposes extraction of series of system parts, and partitioning suggests extraction of parallel system parts. These methods are based on cluster analysis (iterative process of integration of system elements into groups) or content analysis (system division into parts, based on physical partitioning or function analysis). – Study of each subsystem or system part, using optimal corresponding tools (multidisciplinary approaches, problem solving methods, expert advice, knowledge discovery tools, and so on). – Integration of results received from the previous stage, and obtaining a pooled fused knowledge about the system. Synthesis of knowledge and composition of a whole model of the system. It can include formal methods for design, multi-criteria methods for optimization, decision-based and hierarchical design, artificial intelligence approaches, case-based reasoning, and others, for example, hybrid methods [36]. In Table 1 some possible approaches and tools are offered, which can be used at each stage and are not limited by the mentioned methods. To view in more details the stages (as provided in the second column of Table 1) and the methods (offered in the third column), the most frequently used are described. The first stage is “System description” that serves as a background for future system analysis. On this stage knowledge, rules and databases are created. A number of various methods are applied here: (1) expert description, essential in this case, can be combined with graphical methods of system representation (data flow diagrams, decision tables and trees, and so on), (2) graphs in form of flow graph representations, potential graph representations, resistance graph representations, line graph representations, (3) Petri nets, (4) taxonomies, vocabularies, and various kinds of hierarchies, (5) “AND-OR”, morphological trees and their modifications, (6) ontologies which unify necessary expert and technical information about domains of interest and databases.
M.V. Sokolova and A. Fernández-Caballero / A methodological approach to mining and simulating data
755
AU
2. Related works
TH OR
CO PY
The second stage is “System decomposition”, necessary for studying the system components. Among the possible solutions there are criterion-based methods. The third stage, “Study of subsystems”, implies a wide usage of problem-solving methods aimed to describe knowledge and reasoning methods used to solve a task. Then, on this stage there is a great variety of data mining techniques to solve the following tasks: (1) classification, (2) regression, (3) attribute importance, (4) association, and (5) clustering (e.g. [8,23]). Some specific methods used for this list of tasks include statistics, artificial intelligence, decision trees, fuzzy logic, etc. Of course, there are a number of novel methods, modifications and hybridization of existing tools for data mining that appear permanently and are successfully used at this stage [11]. At the fourth stage, “Integration”, sets of methods dedicated to integration and composition are used: (1) methods for data integration, (2) multi-criteria evaluation, (3) decision making, including group and distributed decision making, (4) evolutionary methods, (5) artificial intelligence methods, and so on. A researcher has to accept some assumptions about the system’s detailed elaboration level to be able to analyze it in practice. This means that he/she has to chose those entities considered to be the elemental ones for research. As a rule, this task is solved by specialists. Generally, there are various specialists who collaborate on the same case study. Levin [26] enumerates the traditional classes of specialists: (1) novice or beginner, (2) professional or competent, and (3) expert. The author cites the classification of Denning [7] who suggests a seven-level specification: (1) novice or beginner, (2) advanced beginner or rookie, (3) professional or competent, (4) proficient professional or star, (5) expert or virtuoso, (6) master, and (7) legend. The role played by specialists, especially at higher levels, should not be underestimated, as they provide informational support and determine an ontological basis of the research. The qualitative and quantitative research outcomes have to be evaluated. In case of complex systems different types of criteria are needed, often hybrid and at composite scales, as mono-scaled viewpoints have proved themselves to be wrong and unappropriated for CS solutions [33]. Usually, in such cases they have to be provided as local measurements for each component of the abstract system model, and general evaluation criteria for the system are received as a fused hybrid estimation. The rest of the paper is organized as described next. Section 2 presents a short state of the art in the sphere of complex systems modeling. Next, Section 3 introduces DeciMaS, our methodological approach to mining and simulating data in complex information systems. Then, in Section 4, the DeciMaS data mining work flow is explained in detail. In order to assess the proposal, an experiment designed to evaluate the possible harm caused by environmental contamination upon public health is introduced in Section 5. Lastly, some conclusions are drawn in Section 6.
Complex adaptive systems are characterized by self-organization, adaptation, heterogeneity across scales, and distributed control. Though these systems are ill-determined, ambiguous, uncertain, they have commonalities, that help working out a general way for their study [41]. Also, complex systems or systems of systems are characterized by high complexity and great number of interacting components. Here difficulties already appear during the creation of an abstract model of a CS, due to a great number of decisions to be made regarding its design. Non-traditional tools from different domains are highly effective in case of CS, providing novel ways for decision generation and solutions finding. CS cover several dimensions, including economical, ecological, social sub-systems, which may have any level (positive or negative) of collaboration and acceptance between them [28,32].
756
M.V. Sokolova and A. Fernández-Caballero / A methodological approach to mining and simulating data
TH OR
CO PY
Notice that the aim of this approach is to introduce an integrated framework based on the agent paradigm, which enables intelligent knowledge discovery and support to a specialist during all stages of the decision creation process. Indeed, as the decision making environment has become more complex and decentralized, support provided to decision makers by traditional one function or single user focused decision support system (DSS) has evolved from simple predefined reports to complex and intelligent agent-based analysis, suggestion and judgment [15,16]. A little knowledge of non-specialists in data mining leads to erroneous conclusions and dangerous decisions. The best solution to avoid these problems is to apply a “white-box” methodology, which suggests that users should understand the algorithmic and statistical model structures underlying the software [25]. However, usage of intelligent agents may lead a user through a sequence of steps starting with information retrieval and finishing with the creation of decision alternatives and their evaluation. In this case it is more effective to use “blackbox” methodologies for data mining applications, where the agents create and simulate the dynamic behavior of a complex system. Indeed, many decision support and expert systems are based on intelligent agents [22,29]. One traditional field of application of DSS is medicine, and some recent academic reports deal with examples of novel usage of agent-based DSS for home and hospital care, pre-hospital emergency care and health monitoring and surveillance [2]. Some complex systems are sensor-based, such as medical equipment and diagnostic centers [24,30], modern sensor-based aircrafts [42], or software program tools, such as expert systems for socio-environmental simulation [38]. Specialists working with CS often face difficulties in their analysis and decision making. This problem is caused by the existence of numerous approaches that overlap and supplement each other, but do not meet all requirements of a specialist who needs a multi-focal view on a problem at hand and clear methodology applied to it. Existing approaches offer their solutions, however just a few are organized into methodologies [26,33]. However, not all of them permit both to extract general principles as well as to create specific decisions for a given domain.
3. The DeciMaS approach for complex systems study
AU
The purpose of the DeciMaS framework is to provide and to facilitate complex systems analysis, simulation, and their comprehension and management. From this standpoint, principles of the system approach are implemented in this framework. The overall approach used in the DeciMaS framework is straightforward. The system is decomposed into subsystems, and intelligent agents are used to examine them. Then, obtained fragments of knowledge are pooled together and general patterns of the system behavioral tendencies are produced [35,36]. The framework consists of the following three principal phases: 1. Preliminary domain and system analysis. This is the initial and preparatory phase where an analyst, in collaboration with experts, studies the domain of interest, extracts entities and discovers its properties and relations. Then, he/she states the main and supplemental goals of research, and the possible scenarios and functions of the system. During this exploration analysis, the analyst researches the following questions: what the system has to do and how it has to do it. As a result of this collaboration the meta-ontology and the knowledge base appear. This phase is supported by the Protégé Knowledge Editor that implements the meta-ontology and the Prometheus Design Kit which is used to design the multi-agent system.
757
CO PY
M.V. Sokolova and A. Fernández-Caballero / A methodological approach to mining and simulating data
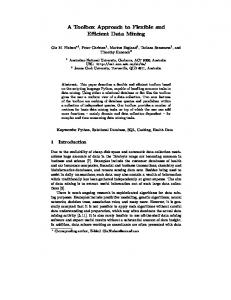
Fig. 1. Architecture of the proposed decision support system.
AU
TH OR
2. System design and coding. The active “element” of this phase is a developer who implements an agent-based system and prepares it for further usage. As support at this phase, JACK Intelligent Agents and JACK Development Environment software tools are used. Once coding has finished and the system has been tested, the second phase of DeciMaS is concluded. 3. Simulation and decision making. This is the last phase of the DeciMaS framework. During this phase, the final user, a decision maker, interacts with the system. This interaction consists of constructing solutions and policies, and estimating consequences of possible actions on the basis of simulation models. This phase is supported with JACK Development Environment. The proposed framework offers a sequence of steps to support a domain expert, who is not a specialist in data mining, during the knowledge discovery process. With this aim, a generalized structure of a decision support system is worked out. The DSS is virtually and logically organized into a three-leveled architecture. Figure 1 illustrates the DSS architecture. The first layer is dedicated to data retrieval, fusion and pre-processing, the second one discovers knowledge from the data, and the third layer deals with making decisions and generating output information. The DSS has on open architecture and may be filled with additional data mining methods. 4. The DeciMaS data mining work flow
In a standard DSS, information is transformed from an initial “raw” state to a “knowledge” state, which suggests organized data sets, models and dependencies, and, finally, to a “new knowledge” state that contains recommendations, risk assessment values and forecasts. The way the information changes, as it passes through the DeciMaS stages, is shown in Fig. 2. In general terms, data mining refers to extracting or “mining” knowledge from data sources. Data matching is a process of bringing together data from different, and sometimes heterogeneous, data sources and comparing them to find out whether they represent the same real-world object [1,9]. However, data
758
M.V. Sokolova and A. Fernández-Caballero / A methodological approach to mining and simulating data
CO PY
Fig. 2. Information transformation from “raw” to “new knowledge” state.
AU
TH OR
mining may be viewed as a part of a knowledge discovery process which consists of an iterative sequence of the following steps [13]: 1. Data cleaning (to remove noise and inconsistent data). 2. Data integration (where multiple data sources may be combined). 3. Data selection (where data relevant to the analysis task are retrieved from the database). 4. Data transformation (where data are transformed or consolidated to be appropriate for mining by performing summary or aggregation operations, for instance). 5. Data mining (an essential process where intelligent methods are applied to extract data patterns). 6. Pattern evaluation (to identify the truly interesting patterns representing knowledge based on some interestingness measures). 7. Knowledge presentation (where visualization and knowledge representation techniques are used to present the retrieved knowledge to the user). Actually, steps from one to four constitute data preprocessing, which is performed to prepare data for mining. The DeciMaS framework uses various data mining techniques to support knowledge transformation to achieve the following global goals: – Information preprocessing. As a rule, primary data are incomplete, noisy and inconsistent. Attributes of interest may not be available and various errors (of data transition, measurement, etc.) may occur. A considerable number of data mining algorithms are susceptible to data quality. That is why data mining techniques usually improve accuracy and efficiency of mining algorithms [6,13, 27]. Data preprocessing within DeciMaS include methods for missing values and outliers detection and treatment, methods for smoothing and normalization [3]. – Data mining. In general, data mining is aimed to solve the following problems: association, classification, function approximation, and clustering. DeciMaS populates the second logical level of the DSS with agents that are aimed to complete these tasks. The agents use a wide range of data mining procedures which include approaches for estimation and prediction: regression analysis, artificial networks, self-organizational methods, in particular, generalized ordered weighted hybrid logarithm averaging (GOWHLA) [43], Group Method of Data Handling (GMDH) [37], and other hybrid methods [10,21,39]. Then, methods used for classification, decomposition and partitioning, based on statistical procedures, are presented [25]. Next, the association task is resolved with artificial neural networks (ANNs) [4,5]. ANNs are trained with different training algorithms such as backpropagation (BP), resilient propagation (RPROP) and training with genetic algorithms (GA) [14, 34]. – Support in decision making. DeciMaS supports data mining process, presenting to a user information from created knowledge bases and permitting generation of “what-if” scenarios. To enable
M.V. Sokolova and A. Fernández-Caballero / A methodological approach to mining and simulating data
Type of disease/Pollutant Endogenous diseases
2
Exogenous diseases
3 4 5 6
Transport Usage of petroleum products Water characteristics Wastes
7
Principal miner products
Table 2 Diseases studied in research Disease class Certain conditions originating in the perinatal period, Congenital malformations, deformations and chromosomal abnormalities Certain infectious and parasitic diseases Neoplasm, Diseases of the blood and bloodforming organs and certain disorders involving the immune mechanism, Endocrine, nutritional and metabolic diseases, Mental and behavioral disorders, Diseases of the nervous system, Diseases of the eye and adnexa, Diseases of the ear and mastoid process, Diseases of the circulatory system, Diseases of the respiratory system, Diseases of the digestive system, Diseases of the skin and subcutaneous tissue, Diseases of the musculoskeletal system and connective tissue, Diseases of the genitourinary system, Pregnancy, childbirth and the puerperium, Symptoms, signs and abnormal clinical and laboratory findings, not elsewhere classified, External causes of morbidity and mortality Number of Lorries, Buses, Autos, Tractors, Motorcycles, Others Petroleum liquid gases; Petroleum autos; Petroleum; Kerosene; Gasohol; Fuel-oil DQO; DBO5; Solids in suspension; Nitrites Non-dangerous chemical wastes, Other non-dangerous chemical wastes, Non-dangerous metal wastes, Wastes from used equipment, paper, Dangerous wastes of glass, Dangerous wastes of rubber, Dangerous solid wastes, Dangerous vitrified wastes, Wastes from used equipment, Metallic and phosphorus wastes Hull; Mercury; Kaolin; Salt; Thenardite; Diatomite; Gypsum; Rock; Others;
CO PY
1
759
TH OR
user-computer interaction, visualization methods which are allowed by the programming environments, are used.
5. Data and results
AU
The experiment designed to evaluate possible harm caused by environmental contamination upon public health was conducted for the Spanish region of Castilla-La Mancha. Retrospective data dated from 1989 until 2007, was used. Resources offered by Instituto Nacional de Estadística and by Instituto de Estadística de Castilla-La Mancha were used for the research [17]. The factors that described the “Environmental pollution – Human health” system were used as indicators of human health and as influencing indirect factors of environmental pollution [19]. Morbidity, classified by sex and age, was accepted as an indicator to evaluate human health. The diseases included in the research were chosen in accordance with the International Statistical Classification of Diseases and Related Health Problems (ICD) [18] and are given in Table 2. Pollutants are represented with indirect pollution sources such as number of vehicles in use, wastes (including dangerous wastes), quality of potable water, and others (see Table 2). Information was retrieved from CSV, DOC and XLS-files and fused together. There were 148 data files that contain information of interest. After extraction, data was placed in data storages agree with the domain ontology. 5.1. Information preprocessing The case of the human health impact assessment appeared to be an optimal domain for application. First, the information is scarce and heterogeneous. The heterogeneity of the initial data is multiple as var-
760
M.V. Sokolova and A. Fernández-Caballero / A methodological approach to mining and simulating data Table 3 The outcomes of the missing values and outliers detection
X0 X2 ... X44 X46 X48 ... Y0 Y2 ...
Missing values, % 38 38 ... 18 0 6 ... 0 ...
Outliers % 0 0 ... 0 12 6 ... 0 6 ...
Factor X1 X3 ... X45 X47 X49 ... Y1 Y3 ...
Missing values, % 78 40 ... 12 0 18 ... 12 0 ...
Outliers % 0 0.950 ... 0 12 0 ... 0 6 ...
CO PY
Factor
5.2. Data mining
AU
TH OR
ious parameters (for example, morbidity indicators versus waste subgroups) have different amounts of data available. The periods between registration of parameters were different. For example, one parameter was registered on a monthly and the other one on a yearly basis. Some data was measured in different scales, for example, morbidity was measured in persons and in thousands of persons. Second, data sets appeared to be short, and it was decided to apply special data mining methods, such as GMDH-based models, and committee machines. Last but not least, the domain of the study represents one of the most difficult problem areas. The real interrelations between its components have not been thoroughly studied yet, even by domain experts [12]. That is why application of the DeciMaS methodology can be very effective as it facilitates the discovery of new knowledge as well as gives a new understanding of the nature of the complex system. Data are checked for the presence of outliers. These can be caused by registration errors or misprints. Outliers are eliminated in the previous step, and are marked as missing values. The data sets with more than 30% of missing values were excluded from the analysis. The outcomes are given in Table 3. The bar chart, given in Fig. 3, visualizes the filling gaps procedure for given data sets before (in red) and after (in blue). Next, data were normalized and smoothed. The reason to apply smoothing is to homogenize data after the treatment of missing values. The exponential smoothing with the coefficient α equal to 0.15 was used. Data is normalized using two normalization methods: “Z -score standardization” (for the case extreme values are not established) and the “Min-Max” normalization (if minimal and maximal values are presented in a data set). Decomposition of the studied complex system, “Environmental pollution-Human health”, was carried out by means of correlation analysis. A set of non-correlated independent variables X for each dependent variable Y were created. The independent variables (pollutants) that showed insignificant correlation with the dependent variable (disease), were also included into the set. Owing to this fact that data sets are short, non-parametric correlation coefficients are calculated using rank correlation coefficient and Kendall’s τ statistic.
For every class of diseases, plotting morbidity value against pollutant or several pollutants, regression analysis was performed. Simple, power, hyperbolic and exponential regression models were created. Each model was evaluated with Fisher F-value. The models that did not satisfy the F-test were eliminated from the list of accepted models. Generally, the number of accepted regression models was low,
761
CO PY
M.V. Sokolova and A. Fernández-Caballero / A methodological approach to mining and simulating data
TH OR
Fig. 3. The bar chart that exemplifies the filling gaps procedure: the data before (in red), and the data after filling the gaps (in blue). (Colours are visible in the online version of the article; http://dx.doi.org/10.3233/IDA-130605)
AU
Fig. 4. Univariate linear regression to model Y0 = f (X1 ). (Colours are visible in the online version of the article; http://dx. doi.org/10.3233/IDA-130605)
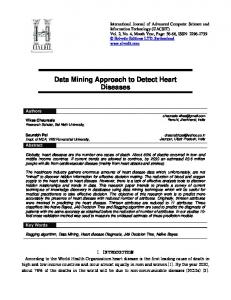
the predictability of the best performing univariate regression models ranged from 0.48 to 0.82 for the discrimination coefficient. Figures 4 and 5 present examples of regression models and approximation to real data. The model given in Fig. 4 is a univariate regression model, that constructs the function Y0 = f (X1 ) and is equals Y0 = 6.42X1 − 0.068. The red line represents initial data, and the blue line represents data approximated with the model. The correlation coefficient for this model equals R = 0.48, the determination coefficient equals D = 0.23 and the F-criterion equals F = 4.4. The regression model given in Fig. 5, which models the dependency Y14 = f (X44 ) and has a form Y14 = 4.43X44 − 0.144 shows better results in fitting the initial line, as well as proving the statistical criteria: the correlation coefficient R = 0.82, the determination coefficient D = 0.68 and the F-criterion F = 30.09.
M.V. Sokolova and A. Fernández-Caballero / A methodological approach to mining and simulating data
CO PY
762
TH OR
Fig. 5. Univariate regression to model Y14 = f (X44 ). (Colours are visible in the online version of the article; http://dx.doi. org/10.3233/IDA-130605)
Fig. 6. Multiple regression to model Y15 = f (X4 , X14 ). (Colours are visible in the online version of the article; http://dx.doi. org/10.3233/IDA-130605)
AU
In general, univariate regression models for the current case study have been characterized with low values of statistical indicators and have demonstrated that they cannot be used for modeling. Multiple regression models have shown better performance results. For instance, the multiple regression model for the Y15 is given in Fig. 6. The model is written as Y15 = 0.022X14 + 0.001X4 + 0.012 and its statistical criteria for this model are: the correlation coefficient R = 0.77, the determination coefficient D = 0.59 and the F-criterion F = 20.69. Meaning the explanatory variables, X4 and X14 , explain the dependent variable Y9 in 59% of cases. In other words, in 59% of cases the model would give a correct result, and in 49% of cases the model would give an incorrect result. Neural network-based models, calculated for the experimental data sets, have demonstrated high performance results. Networks trained with resilient propagation and with backpropagation algorithms have similar architectures, and the training and testing procedures were equivalent. Neural networks trained with genetic algorithms were also applied. In this case, the genes of the chromosome represent weights, and with every new offspring population the error function is moved down until it approaches the optimal or acceptable solution, by changing the matrix of internal weights [40]. Networks trained with resilient propagation and with backpropagation algorithms have similar architectures, and the training and testing procedures were equivalent. Feedforward networks trained with the
M.V. Sokolova and A. Fernández-Caballero / A methodological approach to mining and simulating data
763
Table 4 Committee machine for the variable of interest Y35 Disease: External causes of death. Age group: all ages X X9 , X61 X8 , X63 , X9 X60 , X62 , X12 X64 , X12 X9 , X12 , X60 , X61 , X62 , X64
R 0.67 0.72 0.85 0.87 0.91
D 0.44 0.52 0.72 0.76 0.83
MAE 0.21 0.19 0.14 0.15 0.12
TH OR
CO PY
Y Model 1 Model 2 Model 3 Model 4 Committee machine
AU
Fig. 7. Charts for neural network models trained with backpropagation algorithm: the chart above shows the real model (in red) and the approximated model (in blue), and the chart below shows the error training function plotted against epochs. (Colours are visible in the online version of the article; http://dx.doi.org/10.3233/IDA-130605)
backpropagation algorithm, the values of learning rate and momentum were varied within the interval [0, 0.99]. Better results were obtained with the values of the learning rate within the interval [0.85, 0.99] and the values of momentum within the range [0.3, 0.4]. Feedforward neural networks trained with the resilient propagation training algorithm have shown high performance results with the zero tolerance equal to 10−15 , the initial update value within the range [0.05, 0.15], and the maximum step equal to 50. Neural network trained with genetic algorithms using training sets and with the following parameters for training: – Population size, is the size of population, used for training, vary from 30% to 60%, – Mutation percent, equal to 20%, is the percent of the population, to which the mutation operator is applied, and
M.V. Sokolova and A. Fernández-Caballero / A methodological approach to mining and simulating data
CO PY
764
TH OR
Fig. 8. Charts for neural network models trained with resilient propagation algorithm: the chart above shows the real model (in red) and the approximated model (in blue), and the chart below shows the error training function plotted against epochs. (Colours are visible in the online version of the article; http://dx.doi.org/10.3233/IDA-130605)
AU
– Percent to mate, equal to 30%, is the part of the population, to which the crossover operator is applied. Dependence between diseases and pollutants was modeled with GMDH-algorithms which enable identifying both linear and nonlinear polynomial models using the same approach [20]. Figure 10 shows the models Y27 = 0.2X31 − 0.04X60 + 0.24 with R = 0.94, D = 0.88, MAE = 0.077 and Y89 = 4.20X31 − 0.01X21 − 1.01 with R = 0.91, D = 0.83, MAE = 0.124. In general, GMDH-based models demonstrate high performance results and efficiency when working with short data sets. The models were received with combinatorial algorithm, where the combination of the following polynomials were used: X , X 2 , X1 X2 , X1 X22 , X12 X2 , X12 X22 , 1/X , 1/(X1 X2 ). The selection of the model was stopped when the regulation criterion started to reduce. A final model for every dependence is a committee machine that is written as Y = f (X1 , X2 , . . . , Xn ), where n is a number of pollutants included into a model. As an example of a committee machine, the outcomes of modeling for the variable of interest Y35 Disease : External causes of death. Age group : all ages are discussed. First, after the decomposition of the number of variables (pollutants) that could be included into models for interest Y35 was reduced and included the following factors: X8 , X9 , X12 , X60 , X61 , X62 , X63 , X64 . Several models that included these factors were created for the variable, Y35 , and were then evaluated and the best were selected. The models which are included into this committee machine are: 1. Multiple regression model Y35 = f1 (X9 , X61 ). 2. Neural network trained with backpropagation algorithm Y35 = f2 (X8 , X63 , X9 ).
M.V. Sokolova and A. Fernández-Caballero / A methodological approach to mining and simulating data
TH OR
1 2 3 4 5 6 7 8 9 10
Table 5 Simulation Predicted value Changes of independent variable 20% 40% 80% 0.48 0.71 0.90 1.25 0.51 0.74 0.94 1.31 0.53 0.77 0.98 1.34 0.55 0.79 1.02 1.39 0.57 0.82 1.05 1.45 0.59 0.84 1.08 1.49 0.60 0.87 2.02 1.54 0.61 0.90 2.05 1.58 0.64 0.92 2.08 1.65 0.65 0.94 3.2 1.69
CO PY
Step
765
AU
Fig. 9. Charts for neural network models trained with genetic algorithms: the chart above shows the real model (in red) and the approximated model (in blue), and the chart below shows the error function plotted against generations. (Colours are visible in the online version of the article; http://dx.doi.org/10.3233/IDA-130605)
3. Neural network trained with resilient propagation algorithm Y35 = f3 (X60 , X62 , X12 ). 4. Neural network trained with genetic algorithms Y35 = f4 (X64 , X12 ). The final model generated by the committee machine is: Y35 =
f1 Rf1 + f2 Rf2 + f3 Rf3 + f4 Rf4 Rf1 + Rf2 + Rf3 + Rf4
(1)
where fi is a model, included into the committee machine, and Rfi is the correlation coefficient for the i − th model, i ∈ [0, . . . , n], where n is the number of models. Table 4 shows statistical criteria for the models included into the committee machine, and for the committee machine. The criteria calculated are: the correlation coefficient R, the determination coefficient
M.V. Sokolova and A. Fernández-Caballero / A methodological approach to mining and simulating data
TH OR
CO PY
766
Fig. 10. Charts for neural network models trained with Group Method of Data Handling: the real model (in red) and the approximated model (in blue). (Colours are visible in the online version of the article; http://dx.doi.org/10.3233/IDA-130605)
D , and the minimal absolute error MAE. Table shows that the committee machine models has been evaluated with higher results: the correlation coefficient R = 0.91, the determination coefficient D = 0.83 and the mean absolute error MAE = 0.12. The second column indicates pollutants which was included into the model. The committee machine includes all the factors from the models.
5.3. Simulation
AU
For this case study, a decision is made by the specialist; however, information that could help him/her to ground it is offered by the system. First, models in the form of committee machines and predictions were created, and hidden patterns and possible tendencies were discovered. Second, the results of impact assessment explain the qualitative and quantitative dependencies between pollutants and diseases. Finally, the possibility of simulation is supported by the DSS. The committee machine model for the variable of interest “Neoplasms”, Y20 , given in formula 1, is used. Suppose, there is a need to change the value of a pollutant and observe how a specific morbidity class would response to this change. Suppose that the pollutant is “Usage of fuel-oil”, X8 . There are five models that compose a committee machine for the variable Y20 and one of the models, included into the committee machine for this disease (neural network trained with resilient propagation algorithm) includes X8 as an input variable. Table 5 shows outcomes of simulation.
M.V. Sokolova and A. Fernández-Caballero / A methodological approach to mining and simulating data
767
The first column contains values predicted by a model, the others contain values of Y20 calculated under the hypothesis that the variable X8 is going to vary. With this aim the values of the variable X8 are increased to 20, 40, and 80 percents. The model is characterized with correlation coefficient R = 0.904 and F = 7.354 (F > Ftable ). The determination coefficient, D , shows that the variable X8 explains approximately 81.8% of the variable Y20 . The values of the variable Y20 are given in a normalized scale, and represent relative growth of the process.
6. Conclusions
AU
TH OR
CO PY
In the DeciMaS framework we have embodied two solutions that were proposed in the Introduction section. Firstly, we have brought together existing methods for decision support systems creation, and more concretely within an agent-based decision support system architecture. These methods include data preprocessing, data mining and decision generation methods and approaches. Second, we have introduced an interdisciplinary and flexible methodology for complex, systemic domains and policies, which facilitates study and modeling for a wide range of applications. The case study presented in the article was performed in order to apply the DeciMaS framework for the identification and evaluation of environmental impact upon human health and generation of alternative decisions sets. The computational experiment was carried out by means of an agent-based decision support system that sequentially executed and completed each stage of DeciMaS. The study resulted in several constitutive outcomes and observations, regarding both subjects and methods of the study. It supported making predictions of its possible states and creating a pool of alternative decisions for the better understanding and possible correction of the complex system. Modeling helped to discover non-linear relationships between indicators of human health and pollutants, and generate linear and non-linear mathematical models, based on hybrid technique, which included different types of regressions and artificial neural networks. Our results show that models based on hybrid collective machines and neural networks may be implemented in decision support systems, as they have demonstrated good performance characteristics in approximation and forecasting. This performance gap confirms a non-linear relationship between factors influencing morbidity. Finally, different predictions of possible morbidity states under various assumptions were calculated with hybrid and neural network-based models. The predictions were generated with sensitivity analysis for the cases of explanation variables increasing and decreasing. The general conclusions to the usage of the DeciMaS framework are the following ones. DeciMaS supports the general standard flow of steps for information system’s life cycle. It makes the DeciMaS framework useful and general for application across a wide range of complex domains. The possibility of DeciMaS to be easily adapted to any domain of interest is important. The framework is organized in such a way that the change of domain is realized during the first stage of the DeciMaS framework, but all the further procedures of data mining and decision generation are completed in a similar way for various domains. This characteristic adds flexibility to the framework and widens the areas of its application. Moreover, usage of agent teams let to distribute, control, and synchronize the work flows within the system that are supervised and organized by the team leader agents to manage autonomous knowledge discovery. Additionally, the DeciMaS framework uses known terminology, and integrates tools and methods from various disciplines, making good use of their strong sides. This facilitates the usage of the DeciMaS framework by non scientific users.
768
M.V. Sokolova and A. Fernández-Caballero / A methodological approach to mining and simulating data
Acknowledgements This work was partially supported by Spanish Ministerio de Economía y Competitividad/FEDER under project TIN2010-20845-C03-01, and by Spanish Junta de Comunidades de Castilla-La Mancha/FEDER under project PII2I09-0069-0994.
References
[4] [5] [6] [7] [8] [9] [10] [11] [12] [13] [14] [15] [16] [17] [18] [19] [20] [21] [22] [23] [24] [25] [26] [27] [28]
CO PY
[3]
TH OR
[2]
M. Agyemang, K. Barker and R. Alhajj, A comprehensive survey of numeric and symbolic outlier mining techniques, Intelligent Data Analysis 10 (2006), 521–538. R. Annicchiarico, U. Cortés and C. Urdiales, Agent Technology and e-Health, Whitestein Series in Software Agent Technologies and Autonomic Computing, Birkhäuser Basel, 2008. T. Bossomaier, D. Jarratt, M.M. Anver, T. Scott and J. Thompson, Data integration in agent based modelling, Complexity International 11 (2005), 6–18. A. Casals and A. Fernández-Caballero, Robotics and autonomous systems in the 50th anniversary of artificial intelligence, Robotics and Autonomous Systems 55 (2007), 837–839. T. Chen and Y.C. Wang, A fuzzy-neural approach for global CO2 concentration forecasting, Intelligent Data Analysis 15 (2011), 763–777. B. Clarke, E. Fokoué and H.Z. Hao, Principles and Theory for Data Mining and Machine Learning, Springer Science + Business Media, 2009. P.J. Denning and R. Dunham, The profession of IT: The core of the third-wave professional, Communications of the ACM 44 (2001), 21–25. A.M. Denton, C.A. Besemann and D.H. Dorr, Pattern-based time-series subsequence clustering using radial distribution functions, Knowledge and Information Systems 18 (2009), 129–154. C.F. Dorneles, R. Gonçalves and R. dos Santos Mello, Approximate data instance matching: A survey, Knowledge and Information Systems 27 (2011), 1–21. S.J. Farlow, Self-Organizing Methods in Modeling: GMDH-Type Algorithms, Marcel Dekker, 1984. E. Fuchs, T. Gruber, H. Pree and B. Sick, Temporal data mining using shape space representations of time series, Neurocomputing 74 (2010), 379–393. J.M. Gohlke, S.H. Hrynkow and C.J. Portier, Health, economy, and environment: sustainable energy choices for a nation, Environmental Health Perspectives 6 (2008), 236–237. J. Han and M. Kamber, Data Mining: Concepts and Techniques, Second Edition, The Morgan Kaufmann Series in Data Management Systems, Morgan Kaufmann, 2006. S. Haykin, Neural Networks: A Comprehensive Foundation, McMillan, 1994. T.J. Hess, L.P. Rees and T.R. Rakes, Using autonomous software agents to create the next generation of decision support systems, Decision Sciences 31 (2000), 1–31. J.A. Iglesias, A. Ledezma, A. Sanchis and G. Kaminka, A plan classifier based on chi-square distribution tests, Intelligent Data Analysis 15 (2011), 131–149. Instituto de Estadistica de Castilla-La Mancha. http://www.ine.es/en/welcome.htm. International Classification of Diseases. http:// www.who.int/classifications /icd/en/. ISO 14031:1999, Environmental Management – Environmental Performance – Guidelines, 1999. A.G. Ivakhnenko, G.A. Ivakhnenko, E.A. Savchenko and D. Wunsch, Problems of further development of GMDH algorithms: Part 2, Pattern Recognition and Image Analysis 12 (2002), 6–18. M. Last, A. Kandel and H. Bunke, Data Mining In Time Series Databases, World Scientific, 2004. C.T. Leondes, Fuzzy Logic and Expert Systems Applications, vol. 6, Academic Press, 2007. T. Li, Clustering based on matrix approximation: A unifying view, Knowledge and Information Systems 17 (2008), 1–15. P.J. Li, X.S. Qin, K.H. Adjallah, B. Eynard and J. Lee, Cooperative decision making for diagnosis of complex system based on game theory: survey and an alternative scheme, in: 2006 IEEE International Conference on Industrial Informatics, 2006, pp. 725–730. D.T. Larose, Discovering Knowledge in Data: An Introduction to Data Mining, John Wiley and Sons, 2005. M.S. Levin, Composite Systems Decisions, Springer-Verlag, 2006. T. Marwala, Computational Intelligence for Missing Data Imputation, Estimation,and Management: Knowledge Optimization Techniques, IGI Global, 2006. A.A. Martins, M.G. Cardoso and I.M.S. Pinto, Mapping atmospheric pollutants emissions in European countries, Intelligent Data Analysis 16 (2012), 153–164.
AU
[1]
M.V. Sokolova and A. Fernández-Caballero / A methodological approach to mining and simulating data
T. Nguyen, J. de Kok and M. Titus, A new approach to testing an integrated water systems model using qualitative scenarios, Environmental Modelling and Software 22 (2007), 1557–1571. [30] G.M. O’Hare, M.J. O’Grady, R. Tynan, C. Muldoon, H.R. Kolar, A.G. Ruzzelli, D. Diamond and E. Sweeney, Embedding intelligent decision making within complex dynamic environments, Artificial Intelligence Review 27 (2007), 189–201. [31] D. Pascot, F. Bouslama and S. Mellouli, Architecturing large integrated complex information systems: An application to healthcare, Knowledge and Information Systems 27 (2011), 115–140. [32] S.A. Rahman, A.A. Bakar and Z.A. Mohamed-Hussein, An intelligent data pre-processing of complex datasets, Intelligent Data Analysis 16 (2012), 305–325. [33] J. Rotmans, Tools for integrated sustainability assessment: A two-track approach, The Integrated Assessment Journal 6 (2006), 35–57. [34] S.N. Sivanandam and S.N. Deepa, Introduction to Genetic Algorithms, Springer-Verlag, 2008. [35] M.V. Sokolova and A. Fernández-Caballero, The Protégé – Prometheus approach to support multi-agent systems creation, in: Proceedings of the Tenth International Conference on Enterprise Information Systems, vol. AIDSS, 2008, pp. 442–445. [36] M.V. Sokolova and A. Fernández-Caballero, Data mining driven decision making, Lecture Notes in Computer Science 5179 (2009), 220–225. [37] D. Srinivasan, Energy demand prediction using GMDH networks, Neurocomputing 72 (2008), 625–629. [38] D. Torii, T. Ishida, S. Bonneaud and A. Drogoul, Layering social interaction scenarios on environmental simulation, Lecture Notes in Computer Science 3425 (2005), 78–88. [39] C. Tran, A. Abraham and L. Jain, Decision support systems using hybrid neurocomputing, Neurocomputing 61 (2004), 85–97. [40] A.J.F. van Rooij, R.P. Johnson and L.C. Jain, Neural Network Training Using Genetic Algorithms, World Scientific, 1996. [41] C.H. Weng and Y.L. Chen, Mining fuzzy association rules from uncertain data, Knowledge and Information Systems 23 (2009), 129–152. [42] N. Xu and X. Wang, An information fusion method based on game theory, Proceedings of the 2nd International Conference on Signal Processing Systems 1 (2010), 95–98. [43] L.G. Zhou and H.Y. Chen, Generalized ordered weighted logarithm aggregation operators and their applications to group decision making, International Journal of Intelligent Systems 25 (2010), 683–707.
AU
TH OR
CO PY
[29]
769