Journal of Structural Engineering and Geotechnics, 5 (1), 1-7, Winter 2015 QIAU
A methodology for Determining the Seismic Vulnerability of Old Concrete Highway Bridges by Using Fragility Curves Araliya Mosleha, José Jarab, Humberto Varumc a b
Department of Civil Eng., Faculty of Engineering, University of Aveiro, 3810-193 Aveiro, Portugal
Department of Civil Eng., Faculty of Engineering, University Michoacana de San Nicolas de Hidalgo, Morelia, Mexico Received 5 December 2014; Accepted 20 March 2015
Abstract Past earthquakes have demonstrated that old RC bridges may be seismically vulnerable. Bridge responses during the last decades illustrated the necessity of the seismic assessment of bridges especially those which were designed with old codes. In this research an existing concrete bridge representative of the most common bridges in the highway system in Iran are studied. Push over and nonlinear time history analyses using refined 3-D structural models are performed for each sample. Bridge structural systems are identified and quantified to establish a set of earthquake-site-bridge samples. The superstructure was assumed to remain elastic and the nonlinear behavior in piers was modeled by assigning plastic hinges in columns. The soil flexibility was considered by using elastic spring elements. Displacement ductility and peak ground acceleration (PGA) were selected as seismic performance indicator and intensity measure, respectively. Ten time history records from the past earthquakes were selected. They were scaled and applied incrementally to the 3-D model to evaluate seismic performance of the bridge. Furthermore, bridge damage states were defined and the probabilistic characteristics of structural capacity corresponding to each damage state were established. Then, the conditional probabilities of specific structural demand to exceed the structural capacity were computed and the results were displayed as fragility curves. Ke ywords: Concrete bridges; Seismic vulnerability; Time history analysis; Fragility curve
1. Introduction Several bridges suffered ∗ damage during the past earthquakes. The 1971San Fernando, the 1994 Northridge earthquakes in US, the 1995 Kobe earthquake in Japan, and the 1999 Chi-Chi earthquake in Taiwan caused noticeable impacts to bridges. Most of the damaged bridges during the above mentioned earthquakes were designed according to old versions of the seismic code [1]. The seismic assessment of the highway bridges located in high seismic risk zones play an important role for the safety of transportation systems. It is necessary to evaluate the seismic vulnerability of highway bridges in order to assess economic losses caused by damage to highway systems in the event of an earthquake. There are many different methods to assess bridge performance [2] such as using fragility curves (FC). There are at least four methodologies for the development of seismic fragility curves, namely: expert opinion, empirical, analytical and hybrid approaches. To obtain the analytical fragility curves three steps should be considered: the simulation of ground motions, the simulation of bridges, and the generation of fragility curves. The nonlinear static analysis [3, 4], nonlinear time history analysis [5-8], and elastic spectral analysis [9], can be evaluate to obtain the ∗
structural response. In recent investigation, the vulnerability of steel and concrete girder bridges is proposed by Nielson and DesRoches [10] by considering nonlinear analyses. Choe et al. [11, 12] proposed some researches on typical single-bent bridge in California with RC columns, by applying nonlinear static analysis. Jara et al. evaluated some researches about the seismic vulnerability of concrete bridges by using fragility curves based on column curvature ductility [13, 14]. The seismic behaviors of different type of bridges are studied by many authors [15, 16]. In addition to generate the fragility curves, the repair cost and the recovery time are also required for evaluating the seismic performance of a highway system, and fragility curve is one of the useful methods to access the seismic vulnerability of bridges which are located in high seismic area [17-20]. In the current study, an existing concrete bridge designed with old codes is selected. A set of earthquake acceleration time histories, which covered different dynamic parameters of strong ground motions are chosen. Bridge damage states are defined and established the probabilistic characteristics of structural capacity, corresponding to each damage state. Nonlinear analyses using 3-D structural models are performed and finally, the fragility curves are generated for each set of earthquakes. In other words the objective of this research is the
Corresponding Author Email:
[email protected]
1
A. Mosleh, et al.
evaluation of the seismic performance of old concrete bridges by assessing seismic fragility curves.
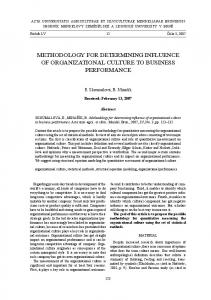
yield displacement occurred at base shear 812 kN and 1592 kN for longitudinal (X) and transversal (Y) direction respectively. The corresponding displacements for mentioned values are 0.15 m and 0.17 m for X and Y respectively. It is noteworthy that the bridge is stiffer in transversal direction, while in longitudinal direction it is more flexible. Results show that the initial stiffness in transversal direction is more than longitudinal direction.
2. Description of the Bridge A typical RC highway bridge located in Iran was selected for generating the fragility curves. Although the characteristics of all types of bridges are not available, one of the most common highway bridge structure found in Iran is considered. Previous researchers have illustrated that single span bridges are seismic resistant structures; therefore these types of bridges are not considered in this study [21]. Brief descriptions of the bridge type, as a representative of most common bridges in Iran, is provided below. 2.1 Multi-span simply supported precast concrete girder bridge The typical multi-span simply supported bridge with concrete girders (MSSS-CG) considered in this paper. The bridge has six spans and five frame type column bents with the overall length of 120 m. Each bent has three columns and the superstructure is composed by RC slabs supported on five precast concrete girders. The span length and the bridge width are 32m and 16m, respectively. The column heights of the piers are 15m and 18m. The columns rested on two circular pile caps with diameter of 4.2 and 3.4 m, respectively. The nominal gap between deck and abutment is 150 mm and the nominal gap between span decks is 100 mm. The concrete girders are supported on elastomeric type bearings.
2000 1800
Transversal Direction Longitudinal Direction
Base shear (Ton)
1600 1400 1200 1000 800 600 400 200 0 0.0
0.1
0.2
0.3
0.4
0.5
0.6
0.7
0.8
Roof displacement (m) Figure 1. Capacity curves in longitudinal and transversal directions of the MSSS-CG bridge.
4. Seismic Damage Limit States To generate the reliable fragility curves, bridge damage limit states (LS) have a significant importance. These curves describe the probability of reaching or exceeding each damage state given the level of ground motion, which can be developed empirically and analytically. One of the main sources of uncertainty occupied in the fragility curves is bridge damage states. Figure 2 shows the previous research work and codes on seismic vulnerability assessment of existing bridges. As can see in Figure 2 most of the researches are in USA, and the lack of investigation in Iran shows the significant of vulnerability of bridges in this area. The statistical shows the distribution of some of the important attributes of the limit states which are determined considering
3. Analytical Models The bridges model was created using the Sap2000 software [22]. The superstructure is expected to remain elastic under the seismic loads applied [23], so these elements were modeled using elastic frame elements (girders), and shell elements (slab). The abutments were modeled as elastic springs by taking into account the Caltrans and FHWA recommendations [24, 25]. The soilstructure interaction was considered using the FHWA proposal [25] and Priestley proposal [26]. Push-over and time history analyses in two orthogonal directions were conducted to evaluate the seismic vulnerability of the bridge. Figure 1 presents the results of the pushover analyses in longitudinal and transverse directions. As depicted in Figure 1 the first exceedance of
2
Journal of Structural Engineering and Geotechnics, 5 (1), 1-7, Winter 2015
Figure 2. Previous research work and codes on seismic vulnerability assessment of existing bridges, (adaptation from http://www.guardian.co.uk/environment/damian-carrington-blog/2011/oct/26/climate-change-developing-country-impacts-risk#).
the associated previous inventory data. Histograms of the investigated attributes are obtained and presented in the following figures. Figure 3 presents the comparison of limit states between codes and researchers. Previous investigation (based on 38 documents) illustrates that most of the researchers and codes used 4 limit states namely: Slight, Moderate, Extensive and Complete. Five damage states are employed by previous researchers as follows: No damage, Slight, Moderate, Extensive and Complete. However there is not much difference between 4 and 5 LS. The LS which is called No damage can be skipped, since it only represents the elastic zone of behavior.
according to the flexural capacity of the columns. Priestley et al. [26] considered two structural limit states, which are serviceability and damage control. 18 16
Documents
12 10 8 6 4
20
2
18
0
Codes Researchers Total
16 14
Documents
Codes Researchers Total
14
2
3
4
5
Number of qualitative LS (a)
12
18
10
16
8
Codes Researchers Total
14
6
Documents
4 2 0 2
3
4
5
Number of limit states
12 10 8 6 4
Figure 3. Comparative of limit states between codes and researchers.
2
Figure 4 provide the comparison of LS in terms of quality and quantity. Qualitative description of five damage states are determined for bridge by HAZUS (which is shown in Table 1 [27]) and Iran codes [28]. However Caltrans [25] consider both qualitative and quantitative. Hwang et al. [6] defined four damage states
0 2
3
4
5
Number of quantitative LS (b)
Figure 4. (a) Qualitative and (b) quantitative comparative of limit states between cods and researchers
3
A. Mosleh, et al.
. T able 1. Description of bridge damage states, taken from HAZUS [27].
18
Damage states No damage (N) Slight/minor damage (S)
16
Moderate damage (M)
Extensive damage (E)
Complete damage (C)
Description No damage to a bridge. Minor cracking and spalling to the abutment, cracks in shear keys at abutments, minor spalling and cracks at hinges, minor spalling at the column (damage requires no more than cosmetic repair) or minor cracking to the deck. Any column experiencing moderate cracking and spalling (column structurally still sound), any connection having cracked shear keys or bent bolts, or moderate settlement of the approach. Any column degrading without collapse (column structurally unsafe), any connection losing some bearing support, or major settlement of the approach. Any column collapsing and connection losing all bearing support, which may lead to imminent deck collapse.
14
Documents
12 10 8 6 4 2 0
Material
Section
Element
Other
Quantitative
Figure 5. Comparative of approaches to assess the bridge damages in previous studies.
5. Time History Analyses 5.1 Ground Motion Selection One of the important tasks to generate fragility curves is selection of input motion parameters. The intensity of the earthquake is described by a commonly used index PGA (peak ground acceleration). However, it should be noted that a severe structural damage is not duo to large PGA. Other indexes, e.g., (PGD) peak ground displacement, (PGV) peak ground velocity, (SI) spectrum intensity [34], (Td) time duration of strong motion [35], (D) distance to epicenter, and spectral characteristics, can be effective in damage estimation [36]. In this paper, ten seismic records from earthquakes with moment magnitude in the range of 6.5 and 7.5 are selected. Based on these data the ground motion records have two horizontal orthogonal components. The accelerograms are obtained from the PEER Strong Motion Data base [37]. The selected earthquake ground motions are presented in Table 2.
Different researchers emphasize on the different properties of the bridge elements by considering the epistemic uncertainties. In previous studies, as shown in Figure.5 four different approaches are considered for the seismic damage assessment and the seismic fragility analysis of the bridges. In the first approach the material properties are considered by researchers to quantify the bridge response. Priestly [26] and Kowalsky [29] proposed a strain limit in their studies, Kawashima [30] in Japan provided a quantitative strain and ductility limit corresponding to the three damage levels; however, Hose [31] considered crack width in his studies. In the second approach, the bridge seismic damage was evaluated by defining damage states and using Moment-Curvature Relationships, which is identified with the label "section" in Figure 5 In the third approach damage limit states were defined to assess the overall seismic damage of the bridges and fragility curves were determined (label "element") in Figure 5 For this purpose, damage states were defined using an engineering demand parameter as the displacement ductility ratio of columns [6,13,14]. In the last one some other limit states were considered in damage index [32] or compared by cost [33]. Previous studies proposed different damage indexes; however, the displacement ductility is the most common one. In this study, based on the study of Hwang et al. [6], the displacement ductility ratio of the column is used to assess the limit states namely: 1 for slight damage, 1.23 for moderate damage, 1.79 for extensive damage and 4.79 for complete damage.
5.2 Seismic Fragility Analysis of the Bridge The analytical fragility curve generated in this paper is based on pushover and time history analyses. First, a bridge is presented by analytical model by considering inelastic behavior for columns and elastic behavior for deck. Second, earthquake ground motion with different characteristic magnitudes, epicentral distance, and similar faulting mechanisms is selected. Third the nonlinear time history analysis is developed, by considering displacement ductility for the columns as limit stats. Finally, the individual fragility curves can be generated by using the probabilistic seismic demand model obtained by regression analysis on the simulated damage data. The fragility curves of a bridge display the conditional probability that the structural demand exceeds the structural
4
Journal of Structural Engineering and Geotechnics, 5 (1), 1-7, Winter 2015
T able 2. Some important parameters of the selected ten earthquake ground motions [37].
Earthquake
PGA (g)
M
D (KM)
Year
Loma Prieta
0.644
6.9
7.2
1989
Duzce
0.0917
7.14
13.71
1999
Kocaeli, Turkey
0.376
7.4
33.2
1999
Northridge
0.568
6.7
40.7
1994
Tabas
0.406
7.4
20.6
1978
Manjil
0.505
7.4
40.4
1990
Manjil
0.184
7.4
84.0
1990
Superstition Hills
0.793
6.5
7.5
1987
San Fernando
0.699
6.6
11.8
1971
Calderan –Turkey
0.064
7.2
55.65
1976
where Pf is the probability of reaching or exceeding a specific damage state, Sd is the structural demand and Sc is the structural capacity. Pf can be described by a lognormal distribution, assuming that the seismic demand and the structural capacity are log-normally distributed. Using this distribution and including the capacity and demand uncertainties,
S /S d c Ρf = Φ βd 2+ βc 2
(2)
where Φ is the standard normal distribution function, βc is the logarithmic standard deviation for the capacity, and βd is the logarithmic standard deviation for the demand. Figure 6 shows the results of probabilistic seismic demand model for the mentioned bridge having R2 value equal to 0.7284. The median value and dispersion values which are shown in Table 3 of the cumulative lognormal probability distribution function are obtained by considering the leastsquares technique to the exceedance probability points. Figure 7 shows the fragility curves for the multi-span simply supported bridge with concrete girders in transversal direction. It is seen in Figure 7 that the separation between fragility curves of the moderate and extensive limit states are much greater than slightmoderate and extensive-complete states. It means that the vulnerability of mentioned bridge for slight and moderate states is close to each other. It can be seen the same trend for extensive and complete states.
capacity. The structural response and damage state are quantified to various levels of ground shaking. The probability that the bridge demands exceeds the structural capacity can be computed as an equation (1).
S Ρf = Ρ d ≥ 1 Sc
(1)
T able 3. Fragility curve parameters of concrete bridge.
Intensity Measure
LS-1 Median
PGA(g) 0.395
Dispersion values 0.175
LS-2 Median
Dispersion values 0.2
0.423
LS-3 Median 0.567 1.0
Ln(µd)=0.9507+0.9152Ln(PGA)
Probability of exceedence
0.8
R2=0.7054
LN(Ductility)
0.0 -0.5 -1.0
LS-4 Median 0.625
Dispersion values 0.26
LS1 LS2 LS3 LS4
1.0 0.5
Dispersion values 0.24
0.6
0.4
0.2
0.0
-1.5
0.0
0.2
0.4
0.6
0.8
1.0
PGA (g) -2.0 -2.5
-2.0
-1.5
-1.0
-0.5
Figure 7. Bridge system fragility curves for the multi-span simply supported bridge for transversal direction.
0.0
LN(PGA,g)
6. Conclusions
Figure 6. Regression of the probabilistic seismic demand model of the concrete bridge.
Fragility curves can be a useful tool to anticipate the intense of probable damages of bridge structures. The aim of study in vulnerability assessment of bridges is to know how to retrofit bridges and plan for disaster response, estimate of money loss, and how to evaluate of loss functionality of highway transportation systems. This
5
A. Mosleh, et al.
study presents the generation of fragility curves for one of the most common bridge typologies in Iran, which is designed with old codes. To achieve the goal, push-over and nonlinear time history analyses, with non-linear 3D models, were carried out using SAP2000 software. Earthquake records from some major event e.g., the 1989 Loma perita, the 1995 Kobe, the 1994 Northridge, and some earthquake which were recorded in Iran namely: the 1990 Manjil, the 1978 Tabas, were selected to input ground motion. Analytical fragility curves for mentioned bridge were obtained with respect to the peak ground acceleration in transversal direction. Both nonlinear push over and time history analyses were performed to generate fragility curves by considering displacement ductility for columns. The conclusions of the study were summarized as follows: It is noteworthy that the bridge is stiffer in transversal direction, while in longitudinal direction it is more flexible. Results show that the initial stiffness in transversal direction is more than longitudinal direction. This difference is duo to the frame system which is caused resistance in this direction. Based on previous investigation (38 documents which were studied in this paper) illustrates that most of the researchers and codes used 4 limit states namely: Slight, Moderate, Extensive and Complete. The limit states of behavior were defined according to the column displacement ductility ratios. In addition, the fragility curves are generated, by modeling the bridge in the transversal direction. The vulnerability assessment of the bridge could be improved by modeling the bridge in two directions, and perform the fragility curves in longitudinal and transversal directions. The columns were the structural element analyzed in this study; future studies should include additionally the bearings, abutments and the foundation.
[8]
[9]
[10]
[11]
[12]
[13]
[14]
[15]
[16]
[17]
References
[18]
[1] Varum H., Sousa R., Delgado W., Fernandes C., Costa A., Jara J., Jara M .and lvarez J., Comparative structural response of two steel bridges constructed 100 years apart, Structure and Infrastructure Engineering, 1–13, 2009. [2] Nicknam A., M osleh A. and Hamidi H., Seismic Performance Evaluation of Urban Bridge using Static Nonlinear Procedure, Case Study: Hafez Bridge, Procedia Engineering, Volume 14, Pages 2350-2357, 2011. [3] M ander J.B.and Basoz N., Seismic fragility curve theory for highway bridges, Technical Council on Lifeline Earthquake Engineering M onograph, ASCE, New York (NY), vol. 16, p. 31–40, 1999. [4] Shinozuka M ., Feng M .Q., Kim H.and Kim S., Nonlinear static procedure for fragility curve development, Journal of Engineering M echanics, ASCE, 126(12):1287–95, 2000. [5] Shinozuka M ., Feng M .Q., Lee J.and Naganuma T., Statistical analysis of fragility curves, Journal of Engineering M echanics, ASCE, 126(12):1224–31,2000. [6] Hwang H., Liu J.and Chiu Y., Seismic fragility analysis of highway bridges, Center for Earthquake Research and Information, The Universityof M emphis, M emphis (TN), 38152,2001. [7] Karim K.R. and Yamazaki F., Effect of earthquake ground motions on fragility curves of highway bridge piers based
on numerical simulation, Earthquake Engineering and Structural Dynamics, 30:1839–56,2001. Foti D., Ivorra S. and Bru D., Analysis of a metallic pedestrian bridge under dynamic human loads in pre and post reinforcement phases, INTERNATIONAL JOURNAL OF M ATHEM ATICAL M ODELS AND M ETHODS IN APPLIED SCIENCES, Vol. 7, 2013. Hwang H., Jernigan J.B. and Y. Lin, Evaluation of seismic damage to memphis bridges and highway systems, Journal of Bridge Engineering, ASCE, 5(4):322–30, 2000. Nielson B.G. and DesRoches R., Seismic fragility methodology for highway bridges using acomponent level approach, Earthquake Engineering and Structural Dynamics, 36, 823–39, 2007. Choe D., Gardoni P., Rosowsky D.and Haukaas T., Probabilistic capacity models andseismic fragility estimates for RC columns subject to corrosion, Reliability Engineeringand System Safety, 93, 383–93,2008. Choe D., Gardoni P., Rosowsky D.and Haukaas T., Seismic fragility estimates for reinforcedconcrete bridges subject to corrosion, Structural Safety, 31, 275–83, 2009. Jara J.M ., Galva A., Jara M .and Olmos B., Procedure for determining the seismic vulnerability of an irregular isolated bridge, Structure and Infrastructure Engineering, 1–13, iFirst article, 2011. Jara J.M ., Galva A., Jara M . and Olmos B., Procedure for determining the seismic vulnerability of an irregular isolated bridge, Structure and Infrastructure Engineering: M aintenance, M anagement, Life-Cycle Design and Performance Volume 9, Issue 6,2013. Fiore A., Foti D., M onaco P., Raffaele D. and Uva G., An approximate solution for the rheological behavior of nonhomogeneous structures changing the structural system during the construction process, Engineering Structures 46, 631–642, 2013. Foti D. and M onaco P., Dynamic response of a bridge deck with one torsional degree of freedom under turbulent wind, Wind and Structures, Vol. 3, No. 2, 117-132, 2000. Jara J.M ., Galva A., Jara M . and Olmos B., Strength and stiffness parameters of isolation systems for bridges with irregular pier heights, 15WCEE, Lisboa,Portugal, 2012. J.M . Jara, M . Jara, B. Olmos, D. Villanueva, H. Varum, Expected seismic performance of irregular isolated bridges, Bridge M aintenance, Safety, M anagement, Resilience and Sustainability – Biondini & Frangopol (Eds), London, ISBN 978-0-415-62124-3,2012.
[19] Jara J.M., Jara M., Hernández H., Olmos B.A., Use of sliding multirrotational devices of an irregular bridge in a zone of high seismicity, Accepted to be published in KSCE Journal of Civil Engineering,2012. [20] Jara J.M., Jara M., Olmos B., Galván A., Procedure for determining the seismic vulnerability of an irregular isolated bridge, Structure and Infrastructure Engineering. DOI: 10.1080/15732479.2011.576255, 1-13, 2011. [21] Choi E., Seismic analysis and retrofit of mid-America bridges, Ph.D. Thesis, Department of Civil and Environmental Engineering, Georgia Institute of Technology, Atlanta (GA), May 2002. [22] CSI. SAP2000 V-14. Integrated finite element analysis and design of structures basic analysis reference manual. Berkeley (CA, USA): Computers and Structures Inc, 2009.
6
Journal of Structural Engineering and Geotechnics, 5 (1), 1-7, Winter 2015
[23] Choi E., DesRoches R., Nielson B., Seismic fragilityof typical bridges in moderate seismic zones, Engineering Structures, 187–199, 2004. [24] Caltrans, Bridge Design Specifications-Seismic Design Criteria, Ver. 1.3, California Department of Transportation, Sacramento, California,2004. [25] FHWA, General Guidelines for the Preliminary Design For Segmental Concrete Box Girder Superstructure, Federal Highway Administration, URL: www.fhwa.dot.gov/bridge/segmental/task60.htm, 2006. [26] Priestley M .J.N., Calvi G.M ., Seismic Design and Retrofit of Bridges, John Wiley & Sons Inc, 1996. [27] FEM A, HAZUS-M H M R1: Technical M anual, Vol. Earthquake M odel. Federal Emergency M anagement Agency, Washington DC, 2003. [28] M PO, Publication No.511, The Guide M anual for the Seismic Vulnerability Assessment and Retrofit of Bridges, Office of Deputy for Strategic Supervision Bureau of Technical Execution System, Iran, 2011. [29] Kowalsky M .J., Deformation Limit States for Circular Reinforced Concrete Bridge Columns, ASCE Journal of Structural Engineering, Volume 126, No. 8, pp. 869-878, 2000. [30] Kawashima K., SEISM IC DESIGN AND RETROFIT OF BRIDGES, 12wcee, 2000. [31] Hose Y., Silva P., Seible F., Development of a Performance Evaluation Database for Concrete Bridge Components and Systems under Simulated Seismic Loads, Earthquake Spectra, Volume 16, No. 2, pp. 413–442, 2000. [32] Karim K., Yamazaki F., Effect of earthquake ground motions on fragility curves of highway bridge piers based on numerical simulation, EARTHQUAKE ENGINEERING AND STRUCTURAL DYNAM ICS Earthquake Engng Struct, 30,1839–1856,2001. [33] M ander J., Fragility Curve Development for Assessing the Seismic Vulnerability of Highway Bridge, University at Buffalo, State University of New York, PAM 509, 1998. [34] Katayama T., Sato N., Saito K., SI-sensor for the identiCcation of destructive earthquake ground motion, Proceedings of the 9th World Conference on Earth. Engg., vol. 7, 1667–672, 1988. [35] Trifunac M .D., Brady A.G., A study of the duration of strong earthquake ground motion. Bulletin of the Seismological Society of America, 65:581– 626, 1975. [36] M olas G.L., Yamazaki F., Neural networks for quick earthquake damage estimation, Earthquake Engineering and Structural Dynamics, 24(4):505–516, 1995. [37] http://peer.berkeley.edu/peer_ground_motion_database.
7