A Methodology for Evaluating Algorithms that Calculate Social Influence in Complex Social Networks Vanja Smailovic1,3, Vedran Podobnik2,3, and Ignac Lovrek2,3
[email protected],
[email protected],
[email protected] 1
Sandvik Machining Solutions AB, Stockholm, Sweden Department of Telecommunications, Faculty of Electrical Engineering and Computing, University of Zagreb, Zagreb, Croatia 3 Social Networking and Computing Laboratory (socialLAB), Faculty of Electrical Engineering and Computing, University of Zagreb, Zagreb, Croatia 2
Abstract. Online social networks are complex systems often involving millions or even billions of users. Understanding the dynamics of a social network requires analysing characteristics of the network (in its entirety) and the users (as individuals). This paper focuses on calculating user’s social influence, which depends on: (i) the user’s positioning in the social network; and (ii) interactions between the user and all other users in the social network. Given that data on all users in the social network is required to calculate social influence, something not applicable for today’s social networks, alternative approaches relying on a limited set of data on users are necessary. However, these approaches introduce uncertainty in calculating (i.e., predicting) the value of social influence. Hence, a methodology is proposed for evaluating algorithms that calculate social influence in complex social networks; this is done by identifying the most accurate and precise algorithm. The proposed methodology extends the traditional ground truth approach, often used in descriptive statistics and machine learning. Use of the proposed methodology is demonstrated using a case study incorporating four algorithms for calculating a user’s social influence.
1. Introduction In 2017, more than 2.5 billion people participated in online social networking, with more than two billion of them using Facebook as one of the largest online social networking platforms [1]. In a broader sense, social networks are not just structures of interconnected humans based on their participation in such platforms. Social networks can also be built around other digital products such as telecommunication network operator services (e.g., mobile phone calls and text messaging) or even non-human users such as networked objects and smart devices (i.e., forming the so-called Social Internet of Things) [2]. Finally, overarching social networks can be built by combining membership and activities in multiple social networks, thus creating even more complex social networks Smailovic, Vanja; Podobnik, Vedran; Lovrek, Ignac. A Methodology for Evaluating Algorithms that Calculate Social Influence in Complex Social Networks. Complexity, Volume 2018, Article ID 1084795, 20 pages https://doi.org/10.1155/2018/1084795
characterised not only by millions or billions of (human and non-human) users, but also a very rich set of possible relationships between social network users. Importantly, understanding the dynamics within a social network requires calculating different properties of complex networks. This paper will focus on properties that describe social networks at the level of the individual user. Though two types of network properties from the aspect of the individual user can be calculated – key actors and key relationships – they differ significantly in the approach to calculating them. The property key actors (such as influence [3][4][5][6]) represents global user properties as it depends on: (i) the global positioning of the user within the entire social network; and (ii) interactions between the user and all other users in the social network (i.e., the property 1:N, where N is the size of the social network). On the other hand, the property key relationships (such as trust [7][8]) represents local user properties, given that they depend on local dynamics between pairs of individual users (i.e., 1:1 property). Today, there are algorithms for calculating both global and local user properties in social networks [9]. Nevertheless, evaluating the algorithms varies significantly. In evaluating local user properties, the ground truth approach can be applied, which is a traditional approach often used in statistics and machine learning. The basic idea behind the ground truth approach is to collect proper objective data on the modelled property and compare the result obtained from the evaluated algorithm with the result found in ground truth data. For example, when modelling the trust relationship between social network users, ground truth data can be collected using a questionnaire where the number of social network users determines the level of trust between them and other social network users [10][11]. Given that social trust is a 1:1 user property, surveyed users may answer questions about their level of trust towards other social network users, and consequently this provides the ground truth data. However, the same approach for evaluating global user properties is not applicable as those properties are 1:N user properties, and only users who have full knowledge of all other social network members are able to answer the ground truth questions. Considering that today’s online social networks are quite sparse [12][13] and only social network platform operators have comprehensive data on its respective users [14], new methods are obviously needed for evaluating the modelling of global user properties in complex social networks. This paper is a contribution to existing literature in that it proposes a novel methodology for evaluating algorithms that calculate social influence in complex social networks. The proposed methodology: (i) compares algorithms that rely solely on available ego-user data for calculating egouser social influence; and (ii) identifies the most accurate and precise algorithm for predicting social influence. To the best of our knowledge, there are no other methodologies for evaluating algorithms that calculate social influence in complex social networks which are in addition able to identify the most accurate and precise calculation algorithm. The paper demonstrates different phases of the proposed methodology using a case study to calculate social influence by evaluating accuracy and precision of four different algorithms that calculate social influence. The paper follows a specific structure. Section 2 presents the concept of social influence in online social networks and related work in the respective field, including the use of SmartSocial Influence algorithms. In Section 3, a methodology for evaluating the method of calculating social influence in complex social networks is introduced, and its use is demonstrated in Section 4. Next, Section 5 discusses the impact of the proposed evaluation methodology and elaborates on possible
|2
implications of identifying the best-performing social influence algorithm. Section 6 provides a conclusion, focusing on constraints of the proposed approach as well as further work in the field. The questionnaires used in method for evaluating social influence are provided in the appendix to this paper.
2. Background on previous work Looking back on previous work, the paper first explains the concept of social influence in online social networks and provides examples of the main services stemming from social influence. The second part in this section introduces SmartSocial Influence algorithms, a specific class of algorithms for calculating social influence.
2.1.
Social influence in online social networks
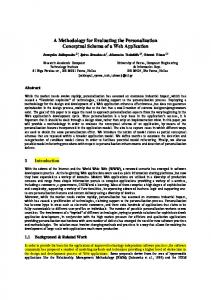
Social influence is “a measure of how people, directly or indirectly, affect the thoughts, feelings and actions of others” [15]. It is a topic of interest in both sociology and social psychology, and more recently in information and communication technology (ICT), computer science and related fields. Social influence in online social networks has seen a great rise with services such as Klout [16], Kred [17], PeerIndex [18] or Tellagence [19], all of which have demonstrated the central role of empowered users in everyday lives of ordinary people [20]. With over 620 million users scored and serving over 200 thousand business partners, Klout is an important service that aims to bring influencers and brands together. Klout defines influence as "the ability to drive action" and measures it on a scale from 1 to 100, based on data from more than ten of the most popular social networking services (SNSs). As of 2017, the two most influential Klout users are Barack Obama and Justin Bieber with Klout scores of 99 and 92, respectively [21]. Figure 1 illustrates the concept of social influence using an example of six users interconnected in a social network through two types of connections. Ego-user User A has a greater social influence than User B, but less than User C, as denoted by the size of graphical symbols representing them. Users in the network are connected through different types of connections (e.g., User A and User C are Facebook friends, while User A and User B communicate using a text messaging service).
Figure 1. Graphical illustration of influence in a social network
3|
Numerous studies, tests, experiments and research over a period of more than 50 years have led to various approaches in elaborating social influence [22][23][24][25][26][27]. Although rooted in social psychology and sociology, the topic of social influence has independently spread to modern online social networks with the rise of the Internet era [28].
2.2.
SmartSocial Influence algorithms The paper compares the prediction accuracy and precision of four social influence algorithms
– 𝑆𝐿𝑂𝐹, 𝑆𝐴𝑂𝐹, 𝑆𝑀𝑂𝐹 and 𝐿𝑅𝐴 – which all belong to the SmartSocial Influence class of algorithms. SmartSocial Influence [4] is an approach to social influence modelling which takes into account the following goals: (i) inferring social influence of users based on their data retrieved from multiple, heterogeneous data-sources – namely data on social networking services combined with data from telecommunication operators; and (ii) a multidisciplinary approach rooted in previous approaches to social influence modelling in the fields of social psychology and sociology, as well as ICT. The important difference to common approaches in social influence modelling (e.g., Klout and Kred) is the scope of observation. Unlike the SmartSocial Influence approach, the approach common to both Klout and Kred is their “Big Brother” scope of observation – they endeavour to collect vast amounts of user data to model influence that may expand beyond activities in a user’s first-degree ego-network (Table 1). Moreover, the SmartSocial Influence approach operates on smaller datasets as its scope of observation is limited to the user’s ego-network alone (Figure 1 – User B and User C are in the egonetwork of User A, but the same in not true for User K). Table 1. Comparison of Klout, Kred and the SmartSocial Influence Klout
Kred
SmartSocial Influence model
"Big Brother"
"Big Brother"
Ego-network
1 to 100
1 to 1000
0 to 100
Support for multiple SNSs
✓
✓
Openly published algorithm
✓
✓
Telco network datasource
✓
Scope of observation Scale
Furthermore, SmartSocial Influence explores social influence in social networks both from the structural1 and behavioural2 perspective – by analysing node degree (i.e., audience size), content type
1
Structural models analyse network structure using metrics such as degree, betweenness and closeness centrality [29][30], as well as eigenvector centrality [31]. 2 Behavioural models analyse interaction among users, e.g., how connected users propagate or repost content, how many of them like or comment on it, or the way they engage in conversations [32] [33].
|4
(i.e., quality) and content frequency (i.e., time-based longitudinal quantity) of interactions between users. Figure 2 illustrates this by identifying the main SmartSocial entities: • • • •
Influencer – the ego-user exerting the influence; Content – items (SNS posts, calls or messages) created by the Influencer in the SNS or telecom network; Ego-network – all users who communicate with the Influencer; Audience – users of a SNS who observe and engage with the Influencer’s content ; a subset of the Influencer's Ego-network.
Figure 2. The SmartSocial Influence model An important feature is the difference between the Influencer's Ego-network and the Audience. The Audience comprises users connected to the Influencer through the same SNS. The Influencer may have multiple Audiences, but for a single SNS there is only one. On the other hand, a user's Egonetwork comprises all users with whom the Influencer has communicated in the combined telecom network and SNSs. Hence, the Audience is a subset of the Influencer's Ego-network. Definitions of the relationships between SmartSocial entities are as follows (Figure 2): • • • •
Influence (SSI) – SmartSocial Influence comprised of TI and SI; Telco Influence (TI) – Influencer’s effect on the respective Ego-network; Social Influence (SI) – Influencer’s effect on the respective Audience; Engagement – the action taken towards the Influencer’s content by the Audience through the SNS (in the form of likes, comments or likes on comments).
In short, the purpose of SmartSocial Influence algorithms is to quantify the number of engagements or interactions for a user's publication or post (e.g., likes) with respect to the size of the audience (i.e., number of friends). In other words, a highly influential user of a SNS will have numerous posts and will be massively engaged by a large share of the respective audience.
5|
Let us further explain the SmartSocial Influence concept on the social graph shown in Figure 1. The Influencer (or ego-user) is 𝑈𝑠𝑒𝑟 𝐴, connected to other users in the respective Ego-network (e.g., to 𝑈𝑠𝑒𝑟 𝐵 and 𝑈𝑠𝑒𝑟 𝐶). 𝑈𝑠𝑒𝑟 𝐶 is part of 𝑈𝑠𝑒𝑟 𝐴's Audience; 𝑈𝑠𝑒𝑟 𝐵 is not. Therefore, 𝑈𝑠𝑒𝑟 𝐵 is not able to “perceive” 𝑈𝑠𝑒𝑟 𝐴’s influence – but merely contributes to it. User A’s influence is defined as a property of node 𝐴, exerting influence on all other users in the respective Audience (part of the Ego-network) and described as a 1:N relationship. This means that 𝑈𝑠𝑒𝑟 𝐾 (not part of the Audience or Ego-network) is not able to “perceive” 𝑈𝑠𝑒𝑟 𝐴's influence. If 𝑈𝑠𝑒𝑟 𝐴 and 𝑈𝑠𝑒𝑟 𝐾 were connected through the same SNS, this would then be possible. Influence is graphically represented through the size of the graphical symbol, with 𝑈𝑠𝑒𝑟 𝐶 being the most influential in 𝑈𝑠𝑒𝑟 𝐴’s Egonetwork (and Audience). In other words, Influencer’s influence is “perceivable” only by members of the Audience, whereas for the entire Ego-network it is “a result of contribution”. Non-audience users of the Ego-network cannot “perceive” influence since they do not possess the means to do so. More details on calculating SmartSocial Influence, along with pseudocodes of algorithms 𝑆𝐿𝑂𝐹, 𝑆𝐴𝑂𝐹, 𝑆𝑀𝑂𝐹 and 𝐿𝑅𝐴, are available in [4].
3. Proposed methodology As previously mentioned, the 𝑆𝐿𝑂𝐹, 𝑆𝐴𝑂𝐹, 𝑆𝑀𝑂𝐹 and 𝐿𝑅𝐴 algorithms produce meaningful and usable results regarding one's social influence [4][34][35]. However, to prove that the results hold true – they have to be validated. Validity is the degree to which evidence supports interpretations of test scores [36]. In other words, validation reveals whether the respective algorithm produces correct results (that hold evidence of being truthful in the largest amount of cases) for social influence. Subsequently, evaluation leads to discovery of the best algorithm, i.e., the most accurate and precise algorithm. Differences between these two terms are explained in detail in Section 3.3. In short, the methodology for evaluating algorithms provides insights into identifying the best social influence algorithm. The proposed methodology takes place in four phases (Figure 3): (i) the first phase is a preparatory step; (ii) the second phase involves taking measurements of the performances of algorithms with respect to “ground truth”; (iii) the third phase is validatory and evaluatory regarding the algorithms; and (iv) the last phase is conclusive.
Figure 3. Proposed methodology for evaluating algorithms that calculate social influence in complex social networks with its four distinct phases
|6
Namely, the first phase involves pre-questionnaires, essential to forming the main questionnaire in a scientifically valid manner in the second phase. The third phase uses the main questionnaire to validate the algorithms, and the fourth phase provides a conclusion by identifying the best algorithm. The four phases of the proposed methodology for evaluating algorithms that calculate social influence in complex social networks are described in more detail further on.
3.1.
Evaluation of social influence calculation: preparatory phase The main questionnaire (𝑀𝑄) is employed to validate social influence results produced by
each of the algorithms. Just as any other questionnaire, the 𝑀𝑄 is a test given to respondents in form of questions. Each question represents a test item (𝑄𝑖 ). To make sure the 𝑀𝑄 measures what it is supposed to measure, two different facets of validity have to be satisfied for each of the selected items (questions). First is content validity and second is face validity. These are tools incorporating a rigorous scientific method – validation of an artefact, in this case, the main questionnaire (𝑀𝑄). 3.1.1. Content validity test Content validity [37], also known as logical validity, indicates to what degree each of the test items measures what it should be measuring (i.e., test content). A test created by a single author may or may not be content valid, given that an author may be biased and create a test that does not measure what it is supposed to. Therefore, as the content validity test a number of individuals who are sociology/psychology researchers were asked to validate questions directly, after being provided with definitions of social influence. 3.1.2. Face validity test Items that pass the content validity process are advanced into the face validity process. In contrast to content validity, face validity does not show how good the test measures what it is supposed to measure, but what it actually appears to measure. In other words, despite the scientific rigour of content validity, it is face validity that ensures correctness of the interpretation of questions and their relevance of the participants’ answers. Some researchers argue that face validity is somewhat unscientific [38]; nonetheless, the test is face-valid if it seems valid and meaningful to the participants taking the test, decreasing its overall bias levels [39]. For that purpose, after establishing content validity with the content validity pre-questionnaire (𝑃𝑄𝐶𝑉 ), an additional pre-questionnaire should be used for establishing face validity (𝑃𝑄𝐹𝑉 ) of items 𝑄𝐶𝑉𝑖 . The basic principle remains the same as with content validity test, but the implementation is somewhat different. Since those who are not sociology/psychology researchers are not familiar with definitions and concepts of social influence, asking them to validate questions directly is inappropriate. Providing them with definitions of social influence beforehand, as is the case with the sociology/psychology researchers, may distort the responses and undermine face validity.3 Therefore, as the face validity pre-questionnaire tests a number of non-expert individuals who are not
3
This design approach, to the best of its ability, endeavors to mitigate the Hawthorne (or Reactivity) effect [40], the Observer-expectancy effect [41] and to the greatest extent – the bias resulting from the Demand characteristics [42].
7|
sociology/psychology researchers, they were asked to validate questions indirectly, without being provided with definitions of social influence beforehand in order to avoid bias.
3.2.
Evaluation of social influence calculation: measurement phase The results of the content-validity and face-validity tests are the basis for compiling the main
questionnaire (𝑀𝑄). The 𝑀𝑄 serves as the “ground truth” or the “golden standard” – its purpose is to validate and evaluate algorithms 𝑆𝐿𝑂𝐹, 𝑆𝐴𝑂𝐹, 𝑆𝑀𝑂𝐹 and 𝐿𝑅𝐴. Each question 𝑄𝑖 in the 𝑀𝑄 requires the participant to read an “imaginary Facebook post” and choose between Facebook friends who exert a greater personal influence (either on emotions, actions or behaviours as described in the question). What each question 𝑄𝑖 (the total number of questions in the questionnaire 𝑀𝑄 is denoted as |𝑀𝑄|) explores is, in fact, the greater social influencer among two Facebook friends in each pair. All of the questions pose the same question indirectly – which of the two Facebook friends has greater social influence? A total of |𝑃𝑎𝑖𝑟| Facebook-friend pairs are offered as answers to each question. These pairs are permutated between questions, to avoid participant boredom and fatigue. All |𝑃𝑎𝑖𝑟| friend pairs in |𝑀𝑄| questions equal |𝑃𝑎𝑖𝑟| × |𝑀𝑄| observations per participant. Combined with |𝑃𝐴𝑅| participants, there are a total of |𝑃𝑎𝑖𝑟| × |𝑀𝑄| × |𝑃𝐴𝑅| observations per algorithm. Observations were carried out in the manner described below. First, consider a single participant, denoted as 𝑃𝐴𝑅𝑗 . For each 𝑃𝑎𝑖𝑟 offered as answers to questions, there are two Facebook friends – 𝑙𝑒𝑓𝑡 𝐹𝐵 𝑓𝑟𝑖𝑒𝑛𝑑 and 𝑟𝑖𝑔ℎ𝑡 𝐹𝐵 𝑓𝑟𝑖𝑒𝑛𝑑. Each Facebook friend has four social influence scores attached to it, as calculated per respective algorithm 𝐴𝐿𝐺𝑂 – 𝑆𝐼𝑆𝐿𝑂𝐹 , 𝑆𝐼𝑆𝐴𝑂𝐹 , 𝑆𝐼𝑆𝑀𝑂𝐹 and 𝑆𝐼𝐿𝑅𝐴. Calculating the difference between social influence scores (𝑆𝐼) of the left and right Facebook friends yields a new measure defined as: ∆𝑝 (𝑃𝑎𝑖𝑟, 𝐴𝐿𝐺𝑂) = 𝑆𝐼𝐴𝐿𝐺𝑂 (𝑙𝑒𝑓𝑡 𝐹𝐵 𝑓𝑟𝑖𝑒𝑛𝑑) − 𝑆𝐼𝐴𝐿𝐺𝑂 (𝑟𝑖𝑔ℎ𝑡 𝐹𝐵 𝑓𝑟𝑖𝑒𝑛𝑑) ,
(1)
𝑝 ∈ {1, 2, … , |𝑃𝑎𝑖𝑟| × |𝑀𝑄| × |𝑃𝐴𝑅|} ,
where: 𝐴𝐿𝐺𝑂 ∈ {𝑆𝐿𝑂𝐹, 𝑆𝐴𝑂𝐹, 𝑆𝑀𝑂𝐹, 𝐿𝑅𝐴}, (𝑙𝑒𝑓𝑡 𝐹𝐵 𝑓𝑟𝑖𝑒𝑛𝑑, 𝑟𝑖𝑔ℎ𝑡 𝐹𝐵 𝑓𝑟𝑖𝑒𝑛𝑑) ∈ 𝑃𝑎𝑖𝑟,
(2)
𝑃𝑎𝑖𝑟 ⊆ 𝐹𝐵 𝐹𝑟𝑖𝑒𝑛𝑑𝑠(𝑃𝐴𝑅𝑗 ), 𝑗 ∈ {1, 2, … , |𝑃𝐴𝑅|} .
Since social influence scores (𝑆𝐼) attain values between 0 and 100, ∆𝑝 attains values between −100 and 100. The value ∆𝑝 in fact represents “measurement of certainty” with which the respective algorithm determines that the 𝑙𝑒𝑓𝑡 𝐹𝐵 𝑓𝑟𝑖𝑒𝑛𝑑 has greater social influence than the 𝑟𝑖𝑔ℎ𝑡 𝐹𝐵 𝑓𝑟𝑖𝑒𝑛𝑑, or vice-versa. For example, ∆𝑝 = −42 means that “the right FB friend is more influential than the left FB friend by 42”. An algorithm that correctly measures a more influential Facebook friend in a 𝑃𝑎𝑖𝑟 (with respect to the participant's answer) – gets rewarded, whereas the algorithm that incorrectly measures it gets punished. This means that ∆𝑝 a single measurement.
|8
How do algorithms get rewarded or punished with respect to a correct or incorrect measurement? Let us define the measurement score of a 𝑃𝑎𝑖𝑟 as: 𝑚𝑠𝑝 = 𝜀𝑝 ∙
∆𝑝 , 100
(3)
where for each 𝑃𝑎𝑖𝑟 of Facebook friends found in the “ground truth”: −1, 𝜀𝑝 = { 1,
𝑖𝑓 𝑚𝑜𝑟𝑒 𝑖𝑛𝑓𝑙𝑢𝑒𝑛𝑡𝑖𝑎𝑙 𝑖𝑠 𝑡ℎ𝑒 𝑓𝑟𝑖𝑒𝑛𝑑 𝑜𝑛 𝑡ℎ𝑒 𝑟𝑖𝑔ℎ𝑡 𝑖𝑓 𝑚𝑜𝑟𝑒 𝑖𝑛𝑓𝑙𝑢𝑒𝑛𝑡𝑖𝑎𝑙 𝑖𝑠 𝑡ℎ𝑒 𝑓𝑟𝑖𝑒𝑛𝑑 𝑜𝑛 𝑡ℎ𝑒 𝑙𝑒𝑓𝑡.
(4)
This simply means that for correctly measuring the more influential Facebook friend in a given 𝑃𝑎𝑖𝑟, an algorithm receives a measurement score of 𝑚𝑠𝑝 = −|∆𝑝 | 100
+|∆𝑝 | 100
. In contrast, it receives 𝑚𝑠𝑝 =
for an incorrect measurement.4
3.3.
Evaluation of social influence calculation: validation and evaluation phase
In the phase that follows, it is important to distinguish between the two constructs – validation and evaluation of algorithms. Validation yields proof that the algorithm produces sound and truthful social influence scores with respect to participants’ answers, which are taken as the “ground truth”. The single criterion for validating an algorithm is as follows: V1.
The overall amount of correct measurements (from the measurement phase) is greater than half (50%) with respect to participants’ answers.
In other words, the 𝐴𝐿𝐺𝑂 algorithm is valid if its average measurement score 𝑚𝑠𝑝 is greater than zero by a statistically-significant margin. Statistically speaking, this shows that the algorithm did not bet and correctly determined the greater social influencers by sheer chance alone, but by being aligned with the “ground truth” found in the participants’ answers. Since validation is a binary variable, an algorithm can either be valid or invalid. There is no comparison between the algorithms in terms of their validity; one cannot be more valid that the other. Evaluation, on the other hand, enables ranking of the algorithms. As can be seen, the algorithm with the greatest amount of both correct and “confident measurements” (utilising greater |∆𝑝 |) – is declared the most truthful. Averaging over all of the Facebook friend pairs, the most truthful algorithm can be identified using the evaluation criteria prioritized as follows:
4
E1.
The greatest average measurement score 𝑚𝑠𝑝 ;
E2.
The smallest spread 5 of measurement scores 𝑚𝑠𝑝 in the distribution.
One might argue whether this approach is justified. Replace the “algorithm” with a Geiger instrument for measuring radioactivity and consider the logic of “measurement confidence” as follows. If the Geiger instrument is correct, it should be rewarded. If not, it should be punished. Now, imagine an instrument that measured ∆𝑝 = 100 between two people, determining the person on the left +100 more radioactive than the person on the right. If incorrect, the algorithm should be severely punished – for potentially endangering the person on the right. If correct, it should be maximally rewarded for saving the life of the person on the left. The same holds true for smaller measurements (e.g., moderate punishment/reward for ∆𝑝 = 5) and all other variations.
9|
To paraphrase using statistics vocabulary, the criteria for the most truthful algorithm would be as follows: E1.
The algorithm with the greatest accuracy;
E2.
The algorithm with the greatest precision.
The first criterion assumes the average to be true as a point-estimation through a sufficient amount of data points.6 Let us be clear that each algorithm is completely precise with respect to repeating a single measurement; i.e., repeating the measurement of the same 𝑃𝑎𝑖𝑟 will always return an identical value. Precision is not used in the sense of an internally intrinsic measure, but in comparing against the “ground truth”. It is a question of how precise an algorithm is when put up against participants’ answers in the real world.
3.4.
Evaluation of social influence calculation: conclusion phase
Importantly, the underlying research problem should be evident – to correctly determine the more influential of the two Facebook users, with the ultimate goal of ranking them according to their social influence score 𝑆𝐼. Knowing a certain 𝑆𝐼 score is inadequate per se unless comparable to another 𝑆𝐼 scores. In the most general sense, this approach to evaluating relates to maxDiff and bestworst choice methodologies [43][44] and is used to establish which of the algorithms produces the best results in a relative (ranked), not absolute (non-ranked) manner.
4. Methodology in practice – evaluating the SmartSocial algorithms In the previous section, four phases of the proposed methodology for evaluating calculation of global user properties in complex social networks were explained. In this section, use of the proposed methodology will be demonstrated using a case study of calculating social influence by evaluating the accuracy and precision of four social influence algorithms – SLOF, SAOF, SMOF and LRA – which all belong to the SmartSocial Influence class of algorithms.
4.1.
Evaluation of the SmartSocial algorithms: preparation phase
4.1.1. Content validity test To avoid bias in selecting questions for the 𝑀𝑄, a content validity pre-questionnaire (𝑃𝑄𝐶𝑉 ) has to be employed. In our case, the 𝑃𝑄𝐶𝑉 was given to a group of 22 experts7 (𝐸𝑋𝑃𝑘 ) on the subject of social influence. Before answering questions, experts were shown important definitions of social influence, what ensured that all of them utilize the same underlying concept. 5
Also known (in statistics) as variability, scatter or dispersion. In our case, exactly 1,152 measurement scores per algorithm (12 Facebook friend pairs in 6 questions given to 16 participants). 7 All the experts were graduates from the Faculty of Humanities and Social Sciences, University of Zagreb, familiar with the field of social influence through (social) psychology and sociology classes and research. 6
| 10
The content validation process is shown in Figure 4. Of the 30 questions (𝑄𝑖 ) from the total in 𝑃𝑄𝐶𝑉 , only the top best-rated 10 passed through to the next step of validation. An expert was given the opportunity to score each question 𝑄𝑖 on a scale of 1 to 5, depending on how well it explored social influence in line with the given definitions. After 𝑃𝑄𝐶𝑉 was finished, each question score was averaged across all experts. This produced the content-validity score for a particular item, denoted as 𝐶𝑉(𝑄𝑖 ). According to [37], for a group of 22 experts, each item has to be rated above 0.42 out of a maximum of 1 in order to pass as valid for content. On a scale of 1 to 5, this equates to 2.1, which is the threshold for selecting a question 𝑄𝑖 as content-valid. In other words, the statement 𝐶𝑉(𝑄𝑖 ) > 2.1 must hold true for each of the questions 𝑄𝑖 to be content-valid. All questions 𝑄𝑖 , as well as their respective 𝐶𝑉(𝑄𝑖 ) scores, can be found in Appendix 1. Prequestionnaire (content validity). Of the 30 questions in the 𝑃𝑄𝐶𝑉 , 29 questions passed the content validity test and the top 10 with the highest 𝐶𝑉(𝑄𝑖 ) scores were selected for the next phase – the face validity test (𝑃𝑄𝐹𝑉 ).
Figure 4. The process of content validation for questions 𝑄𝑖
4.1.2. Face validity test In this phase, a pre-questionnaire of top 10 questions that passed 𝑃𝑄𝐶𝑉 was given to 22 individuals who were not experts (𝑁𝐸𝑋𝑥 ) on the subject of social influence. As is evident in Appendix 2. Pre-questionnaire (face validity), these questions do not address social influence per se in any shape or form but ask the non-expert to read an “imaginary Facebook post”, and each time a different one. The “post” is followed by a description regarding the effect either on personal emotions, actions or behaviours with respect to a given imaginary Facebook post. Next, the non-expert is instructed to choose which Facebook friend would cause a greater effect either on emotions, actions or behaviours as described in the question. Facebook friends are presented in pairs, with each question holding the identical four Facebook-friend pairs as answers. The face validation process is shown in Figure 5.
11 |
Figure 5. The process of face validation for questions 𝑄𝐹𝑉,𝑖
A note here is that pairs themselves are not important in this phase; the point of the 𝑃𝑄𝐹𝑉 lies in a “hidden” 11th question which reveals itself to the non-expert once the 𝑃𝑄𝐹𝑉 is finished. This last question provides the necessary definitions of social influence, and then asks the non-expert to choose – in accordance with the provided definitions – the more influential friend among the same four Facebook friend pairs used beforehand. In essence, it provides a filter of “correct answers” for all of the previous 10 questions. Details about the face validity test and face validity scores 𝐹𝑉(𝑄𝐶𝑉𝑖 ) with respect to the 10 questions in the 𝑃𝑄𝐹𝑉 can be found in Appendix 2. Pre-questionnaire (face validity). Exactly four Facebook-friend pairs are offered as answers in each 𝑄𝐶𝑉𝑖 because questions can have anything between 0 and 4 “correct answers”, based on “criteria” in the 11th question. Upon shifting the scale by +1, this yields a scale from 1 to 5, which corresponds directly to the previously used scale in the 𝑃𝑄𝐶𝑉 , which is important for equal treatment of both content- and face-validity. Again, each question is given a score 𝐹𝑉(𝑄𝐶𝑉𝑖 ) as an average across all scores of the 22 non-experts. Finally, the top 5 questions were chosen for 𝑀𝑄, with an additional 𝑄𝑀𝑄6 . This additional question was important for the 𝑀𝑄 as it involved a topic referring to the mobile telecommunication operator. In fact, it is both content- and face-valid (see Appendix 1. Pre-questionnaire (content validity), Appendix 2. Pre-questionnaire (face validity)).
4.2.
Evaluation of the SmartSocial algorithms: measurement phase
To avoid fatigue [38], participants in the main questionnaire 𝑀𝑄 were asked 6 questions, leading to |𝑀𝑄| = 6. The highest scored questions that passed content validity as well as face validity pre-questionnaires were chosen to be part of the 𝑀𝑄, as described in the previous subsection. A total of 16 participants participated in the 𝑀𝑄, leading to |𝑃𝐴𝑅| = 16. A total of 12 Facebook-friend pairs were offered as answers to each question, leading to |𝑃𝑎𝑖𝑟| = 12. All 12 friend pairs in 6 questions equal 72 observations per participant. Combined with 16 participants, there are a total of 1,152 observations per algorithm. | 12
More details about the specific questions which were part of the 𝑀𝑄 are given in Appendix 3. Main questionnaire (algorithm validity), while more details about the metrics used in the measurement process are given in Section 3.2.
4.3.
Evaluation of the SmartSocial algorithms: validation and evaluation phase
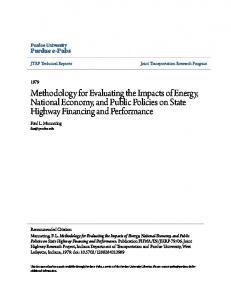
4.3.1. Validation using measurement scores Figure 6 shows the distribution of final measurement scores 𝑚𝑠𝑝 for the 𝑆𝐿𝑂𝐹 algorithm. Individual measurement scores are retrieved for each pair of Facebook friends and can attain values in the range [−1, 1] (i.e.,
+∆𝑝 100
or
−∆𝑝 100
for a certain pair). Given that there are 6 questions with 12 pairs
across 16 participants, the distribution shows a total of 1,152 measurement scores.
Figure 6. Distribution8 of measurement scores for the SLOF algorithm
At the given resolution, it becomes evident that the 𝑆𝐿𝑂𝐹 𝑚𝑠𝑝 distribution is multimodal, having five modes. This observation holds true for other (𝑆𝐴𝑂𝐹, 𝑆𝑀𝑂𝐹 and 𝐿𝑅𝐴) 𝑚𝑠𝑝 distributions as well. The reason lies in the somewhat non-random method of selecting 𝑃𝑎𝑖𝑟𝑠 and their respective differences in 𝑆𝐼, which produces a non-normally distributed ∆𝑝 that sometimes overlaps or repeats, producing several modes.9 It becomes evident that the majority of measurement scores (𝑚𝑠𝑝 ) are greater than zero. To be exact, 58% of them are positive. This means that 𝑆𝐿𝑂𝐹 correctly determined the greater influencer in 668 out of 1,152 pairs. Validity is similar to 𝑆𝐿𝑂𝐹 for 𝑆𝐴𝑂𝐹 (Figure 7), 𝑆𝑀𝑂𝐹 (Figure 8) and 𝐿𝑅𝐴 (Figure 9) as well. They correctly determined 61%, 61% and 64% of greater influencers in pairs, respectively.
8
9
Extreme values and outliers are not shown; the distribution shows 936 (of 1,152) or 81% of all measurement scores for 𝑆𝐿𝑂𝐹. Although desirable, it was not feasible to select truly-random values of ∆𝑝 due to the fact that the 𝑆𝐼 score distributions from SmartSocial Influence algorithms are not normal. Particularly in the case of the 𝑆𝐿𝑂𝐹 algorithm, a high-kurtosis distribution of 𝑆𝐼 scores exists, resulting in the measurement scores 𝑚𝑠𝑝 distribution displaying “groups” based on similar ∆𝑝 .
13 |
Figure 7. Measurement score distribution for the SAOF algorithm
Figure 8. Measurement score distribution for the SMOF algorithm
Figure 9. Measurement score distribution for the LRA algorithm To prove the validity of each algorithm – let us formally use statistical hypothesis testing in the following manner. Consider the statement “𝑆𝐿𝑂𝐹 algorithm works by sheer guessing of the correct measurements” as the null hypothesis (𝐻0 ) being tested. The test statistic is “the number of correct measurements”. Let us set the significance level (𝛼) at 0.01. The observation is “668 correct measurements out of 1,152”. Therefore, 𝑝-𝑣𝑎𝑙𝑢𝑒 is the probability of observing between 668 and 1,152 correct measurements with the null hypothesis being true. Calculation of p-value is as follows [45]: | 14
1152
1 1152 1152 𝑝-𝑣𝑎𝑙𝑢𝑒 = ( ) ∙ ∑ ( ), 2 𝑑
(5)
𝑑=668
−8
which equals approximately 3.28 ∙ 10 . In other words, guessing more than 58% out of 1,152 measurements correctly (𝑝-𝑣𝑎𝑙𝑢𝑒) is statistically very improbable. Since 𝑝-𝑣𝑎𝑙𝑢𝑒 ≪ 𝛼, the null hypothesis is strongly rejected. Table 2. Summary of statistical hypothesis testing with the goal of social influence algorithm validation TESTING PARAMETERS 𝑯𝟎 (null hypothesis)
𝑺𝑳𝑶𝑭
𝑺𝑨𝑶𝑭
𝑺𝑴𝑶𝑭
𝑳𝑹𝑨
Algorithm being tested works by the sheer guessing of correct measurements.
Test statistic
number of correct measurements
Significance level (𝜶)
0.01
Observation (number of correct measurements)
668 in 1,152
706 in 1,152
706 in 1152
733 in 1,152
𝒑-𝒗𝒂𝒍𝒖𝒆
3.28 ∙ 10−8
9.08 ∙ 10−15
9.08 ∙ 10−15
8.52 ∙ 10−21
Algorithm being tested does not work by the sheer guessing of correct measurements.
Conclusion (¬ 𝑯𝟎 ) Validation successful
✓
✓
✓
✓
Therefore, the logical complement of the null hypothesis (¬ 𝐻0 ) can be accepted, stating that “the 𝑆𝐿𝑂𝐹 algorithm does not work by the sheer guessing of correct measurements”, which validates the algorithm. Considering that the other algorithms (𝑆𝐴𝑂𝐹, 𝑆𝑀𝑂𝐹 and 𝐿𝑅𝐴) have even greater test statistics, the null hypothesis can be safely rejected for them as well. The summary is shown in Table 2. To summarise, all of the algorithms were successfully validated by satisfying the single criterion for validation (V1). Note that the percentages of correct measurements are not comparable across the algorithms – which may be 58% percent of “correct pairs” for 𝑆𝐿𝑂𝐹, and is not comparable with 64% of “correct pairs” for 𝐿𝑅𝐴, given that pairs are associated with different “weights” (∆𝑝 ) to them. This is the reason, for example, that 𝐿𝑅𝐴 is not more valid than 𝑆𝐿𝑂𝐹. The mentioned challenge of ranking is a task for evaluation, not validation, as will be explained in detail in the following subsection. 4.3.2. Evaluation by comparison Figure 10 shows a boxplot of measurement scores 𝑚𝑠𝑝 for each algorithm. Although all four algorithms belong to the same SmartSocial Influence class of algorithms, 𝐿𝑅𝐴 is denoted with a different color (light blue) since it is the only solely literature-based algorithm (i.e., the benchmark algorithm) and the predecessor to 𝑆𝐿𝑂𝐹, 𝑆𝐴𝑂𝐹 and 𝑆𝑀𝑂𝐹 (which are the upgraded versions [4]). The +∆𝑝
measurement scores are retrieved per pair, as either correct (
100
−∆𝑝
) or incorrect (
100
). A summary of
the boxplot is given in Table 3. 15 |
Table 3. Summary of measurement scores as boxplot statistics 𝑺𝑳𝑶𝑭
𝑺𝑨𝑶𝑭
𝑺𝑴𝑶𝑭
𝑳𝑹𝑨
No. of measurement scores
1,152
1,152
1,152
1,152
Maximum value
0.90
0.63
0.55
0.76
Upper whisker
0.18
0.29
0.25
0.26
75th percentile
0.06
0.08
0.09
0.09
0.0358
0.0271
0.0240
0.0250
Median
0.02
0.03
0.03
0.03
25th percentile
-0.02
-0.06
-0.04
-0.04
Lower whisker
-0.12
-0.27
-0.20
-0.23
Minimum value
-0.90
-0.63
-0.55
-0.76
BOXPLOT STATISTIC
Average (mean)
Let us first consider the first criterion for evaluation (E1) – the greatest average measurement score (𝑚𝑠 ̅̅̅̅𝑝 ), denoted with a “+” symbol in Figure 10. The greatest 𝑚𝑠 ̅̅̅̅𝑝 is found in 𝑆𝐿𝑂𝐹 and equals 0.0358. The smallest 𝑚𝑠 ̅̅̅̅𝑝 is found in 𝑆𝑀𝑂𝐹 and equals 0.0240. In between are 𝑆𝐴𝑂𝐹 with 0.0271 and 𝐿𝑅𝐴 with 0.0250 𝑚𝑠 ̅̅̅̅𝑝 , respectively. Observing the averages, 𝑆𝐿𝑂𝐹 and 𝑆𝐴𝑂𝐹 are evaluated as more truthful, while 𝑆𝑀𝑂𝐹 as less truthful than their predecessor 𝐿𝑅𝐴 – showing a +43.4%, +8.7% and −3.8% difference in 𝑚𝑠 ̅̅̅̅𝑝 , respectively. Based on the first criterion used for evaluation (E1), the two algorithms – 𝑆𝐿𝑂𝐹 and 𝑆𝐴𝑂𝐹 – demonstrated and clearly showed significant improvements over their predecessor, the 𝐿𝑅𝐴 algorithm, and provided a scientific contribution. In other words, this means that, on average, 𝑆𝐿𝑂𝐹 and 𝑆𝐴𝑂𝐹 surpass 𝐿𝑅𝐴 (accuracy) in correctly determining the greater influencer between the two – while considering the differences in their respective 𝑆𝐼 scores. Let us now consider the second criterion for evaluation (E2) – the smallest spread of measurement scores. Statistically speaking, there are various estimators that estimate the spread of values across a distribution. They are called estimators of scale, in contrast to estimators of location (i.e., such as mean or median) [48][49][50]. The view is that the first criterion used for evaluation utilized the sample mean (average) as an estimator of location to rank the algorithms. When dealing with a large amount of data or variable measurements, outliers and extreme values are common, along with certain departures from parametric distributions. To be “resistant” to outliers or underlying parameters of a distribution (namely non-normality, asymmetry, skewness and kurtosis) – robust estimators of scale have to be employed [52]. In such situations, performance of robust estimators tends to be greater than their non-robust counterparts (such as standard deviation or variance) [53].
| 16
Figure 10. Boxplot10 of measurement scores for each algorithm On the other hand, statistical efficiency11 of robust estimators tends to be smaller. Caution should be used when seeking “resistance” to outliers – sometimes they carry very important
10
Boxplot uses values that are less than a 1.5× inter-quartile range from 1st and/or 3rd quartile for lower- and upper-whisker (as defined by Tukey [46]); box lower-bound is the 25th percentile, middle-bound is the median, upper-bound is the 75th percentile and “+” denotes an average (mean) value. Plotted using BoxPlotR [47]. 11 In (descriptive) statistics, efficiency of an estimator is its performance with regards to the (minimum) necessary number of observations. A more efficient estimator needs fewer observations; given that the amount of observations is not an issue with measurement scores, lower efficiency is not problematic.
17 |
information, such as the early onset of ozone holes which were initially rejected as outliers [54]. Since measurement scores are a large amount of non-parametrically distributed data containing outliers, utilization of robust estimators of scale is mandatory. A thorough description of all estimators is beyond the scope of this paper; instead, only appropriate estimators are selected together with an explanation for selecting them. The estimator needs to be appropriate for comparing spread between measurement score distributions. The appropriate estimator successfully avoids all the “pitfalls” of the characteristics in measurement score distributions and additionally [50][52][55]: (i) is applicable to variables using interval scale and not just ratio scale;12 (ii) is applicable to variables containing both negative and positive values; (iii) is insensitive to mean (average) value close to or approaching zero; (iv) is insensitive to variables of which the mean (average) value can be zero; (v) is invariant (robust) to underlying distribution of the variable (i.e., non-parametric); (vi) is invariant (robust) to a small number of outliers; (vii) is invariant (robust) to asymmetry of the distribution and location estimate (or choice of central tendency, e.g., mean or median); (viii) has the best possible breakdown point.13 The Interquartile Range (IQR) is the difference between the upper and lower quartiles; also, the “height” of the box in a boxplot [57]. The Coefficient of Quartile Variation (CQV) equals IQR divided by the sum of lower and upper quartiles [49]. Although 𝐼𝑄𝑅 does not satisfy the criterion (viii), it is an appropriate statistic because it satisfies all of the other (more important) criteria; breakdown point of the 𝐼𝑄𝑅 is not critically low and equals 25%, together with the 𝐶𝑄𝑉 for which the same reasoning of appropriateness applies. Furthermore, Rousseeuw-Croux estimators 𝑆𝑛 and 𝑄𝑛 [51] offer breakdown points of 50%, do not assume distribution symmetry and work independently of the choice of central tendency (mean or median) – all highly favourable traits. Notably, the Median Absolute Deviation (MAD), as a robust measure of spread, was considered a serious contender due to its clear benefits, e.g., over standard deviation as defined and elaborated in [53]. However, an important drawback of classical MAD with regard to criterion (vii) is its sensitivity to distribution asymmetry, a behavior measurement score distribution definitely evident as shown in Figure 10. Therefore, 𝐼𝑄𝑅, 𝐶𝑄𝑉, 𝑆𝑛 and 𝑄𝑛 form a group of selected, appropriate estimators of scale. To conclude evaluation of the algorithms, a summary of boxplot parameters (measurements scores), and appropriate estimators are given in Table 4. Next to each estimator is the criterion which
12
Ratio scales (e.g., Kelvin temperature, mass or length) have a non-arbitrary, meaningful and unique zero value. Interval scales (e.g., Celsius temperature) explain the degree of difference, but not the ratio between the values. A measurement score of 0.4 is greater than that of -0.1, but not proportionally so. Additionally, a measurement score of 0.0 does not indicate “no determination”. Hence, measurement scores use an interval scale. 13 The breakdown point of an estimator is the proportion of incorrect observations an estimator can handle before producing incorrect results [56]. For example, consider the median; its breakdown point is 50% because that is the amount of incorrect observations introduced for it to have an incorrect median. The maximum achievable breakdown point is 50%, since that is the threshold at which it becomes impossible to discern correct from incorrect data. 𝐼𝑄𝑅 has a breakdown point of 25%, Rousseeuw-Croux 𝑆𝑛 and 𝑄𝑛 achieve 50%. The higher the breakdown point of an estimator, the greater its robustness.
| 18
the estimator is attached to; criterion (E1) bears one and criterion (E2) bears four estimators altogether. Table 4. Summary of criteria ranks and evaluation conclusion STATISTIC or ESTIMATOR
Criterion
Average (mean) rank
Accuracy (E1)
𝑰𝑸𝑹 rank
Precision (E2)
𝑪𝑸𝑽 rank
Precision (E2)
Rousseeuw-Croux 𝑺𝒏 rank
Precision (E2)
Rousseeuw-Croux 𝑸𝒏 rank
Precision (E2)
EVALUATION RANK
(E1 & E2)
𝑺𝑳𝑶𝑭
𝑺𝑨𝑶𝑭
𝑺𝑴𝑶𝑭
𝑳𝑹𝑨
1st
2nd
4th
3rd
(0.0358)
(0.0271)
(0.0240)
(0.0250)
1st
3rd
2nd
2nd
(0.08)
(0.14)
(0.13)
(0.13)
1st
3rd
2nd
2nd
(2.0)
(7.0)
(2.6)
(2.6)
1st
2nd
2nd
2nd
(0.0835)
(0.1073)
(0.1073)
(0.1073)
1st
2nd
2nd
2nd
(0.0885)
(0.1106)
(0.1106)
(0.1106)
1st
2nd
4th
3rd
All of the appropriate estimators gave their output in the form of a single number (i.e., values in brackets); these numbers were compared, and algorithms ranked accordingly (for the criterion (E1), greater values are better (more is better); for the criterion (E2), the opposite is true – smaller values are better). Ranks reflect true positions with respect to each estimator's output, respectively. Some ranks exhibit a “tie” (e.g., as with 𝑆𝑛 ), where three algorithms came in 2nd, and only one came in 1st.
4.4.
Evaluation of the SmartSocial algorithms: conclusion phase
The last row (evaluation rank) in Table 4 declares the final, total rankings of algorithms with respect to evaluation. The final rank was produced as an arithmetic mean of the ranking of evaluation criteria (E1 and E2), the ranks of which were produced as arithmetic means of the respective evaluators. 𝑆𝐿𝑂𝐹 is compared to 𝐿𝑅𝐴 in bold. As with criterion (E1), 𝑆𝐿𝑂𝐹 reigns supreme over the other algorithms along with criterion (E2) as well. In other words, 𝑆𝐿𝑂𝐹 is the most accurate and precise algorithm of the four analysed SmartSocial Influence algorithms. Evaluation clearly demonstrates that 𝑆𝐿𝑂𝐹 exhibits significant improvements over its predecessor, the 𝐿𝑅𝐴, and provides an original scientific contribution. 𝑆𝐴𝑂𝐹 shows a minor improvement, whereas 𝑆𝑀𝑂𝐹 shows no improvement in the overall rankings, while 𝑆𝐴𝑂𝐹 is more accurate and 𝑆𝑀𝑂𝐹 is more precise than 𝐿𝑅𝐴. An interesting notice is that they are ranked (throughout the criteria) very closely to 𝐿𝑅𝐴, lacking the demonstrative power of improvement as exhibited by 𝑆𝐿𝑂𝐹. It seems that 𝑆𝑀𝑂𝐹 would greatly benefit from increasing its accuracy, as its precision is already on par with that of 𝐿𝑅𝐴. Likewise, 𝑆𝐴𝑂𝐹 would greatly benefit from increasing its precision, as it is already more accurate than 𝐿𝑅𝐴. Nonetheless, future research and additional work are 19 |
necessary to uncover as to why the algorithms rank as they do – and motivation in answering this question lies in further experimentation and auxiliary analysis which may very well shed some additional light on a potentially decisive answer.
5. Discussion This section discusses the impact of the proposed methodology and possible implications of 𝑆𝐿𝑂𝐹 as the best-evaluated algorithm. But first, to avoid any misconceptions, let us explain what validation and evaluation are, and what they are not – in terms of their respective goals. Validation proves that all of the four SmartSocial influence algorithms do not work by the sheer guessing of correct measurements. The alternative hypotheses may be either true, or false – one cannot reason as to how much the algorithms produce “correct, meaningful and truthful” results; only that they do not produce random results (as is the case with guessing), when compared against the “ground truth” or “golden standard”. Validity is proven by ignoring the “pair weights” (∆𝑝 ) associated with each measurement and looking at the percentage of correct measurements, as opposed to incorrect measurements. Evaluation proves that 𝑆𝐿𝑂𝐹 is the best-ranked algorithm according to a pre-given set of criteria – namely accuracy and precision. For each algorithm, accuracy is calculated using the mean (average) measurement score (as an estimator of location), and precision is calculated using measurement score spread (or dispersion, using robust estimators of scale). The algorithm with the greatest accuracy and precision emerges as the winner. Additionally, evaluation does not enable any kind of statistical inference – the goal of validation and evaluation is not generalizability. The experiment, by its very design, did not (representatively) sample a pre-determined population;14 doing so would greatly lower the amount of Facebook friendships in a sample graph, making the job of comparing algorithms all the more difficult – which is exactly what the purpose of the evaluation was in the first place. The definition of social influence has been from social psychology, which is reflected to a certain degree in the design of the algorithms. On the other hand, there is no guarantee as to how much social influence measured by the algorithms fits social influence as measured by social psychologists. In other words, social influence in the “digital” realm may or may not correspond to (or be associated with) with that in the “physical, real world” – it is solely a best-effort model of it [4][34][35]. An analysis was conducted of the age and number of Facebook friends totalling 361 SmartSocial Influence experiment participants15 (these are not the same participants who participated in the evaluation questionnaire,16 although some may overlap). Analysis of age draws some interesting
14
One might define the population as mostly those between 20 and 30 years of age, predominantly highly-educated (mostly from Zagreb, Croatia), with university degrees in information technology, medicine, psychology or sociology. 15 The SmartSocial influence experiment was conducted in the period from September 2014 until May 2015. A total of 465 user profiles were created. Of these, 104 contained only telecommunication data, as these users did not provide their Facebook data. Consequently, the SmartSocial real-world sample comprised the remaining 361 profiles with complete, personal multi-source data necessary for SmartSocial algorithms to run – both Facebook, as well as telecommunication personal data. 16 The SmartSocial Influence evaluation questionnaire was conducted in the period from 21 st February 2016 until 14th March 2016. The first phase (pre-questionnaire) had 22 experts and 22 non-experts as the participants. The second phase (main questionnaire) had 16 participants.
| 20
conclusions (Figure 11). Up until 𝑆𝐼 of 61, there is a slowly rising trend of age with respect to the social influence scores of participants. However, as 𝑆𝐼 approaches ⟨60, 70], there is a sharp increase in the age of the participants, as there is a much greater representation of 30 year olds in the sample. More interestingly, highly influential participants (𝑆𝐼 > 80) were all 25 years of age and younger, with the most influential ones (𝑆𝐼 > 90) being below 21.5 years of age. According to 𝑆𝐿𝑂𝐹, the youth is more socially influential.
Figure 11. Average age with respect to 𝑆𝐼 scores of 𝑆𝐿𝑂𝐹 What is most surprising is the results from analysing the number of friends (Figure 12). Once more, a group of participants with 𝑆𝐼 = ⟨60, 70] shows specific characteristics. As observed with age, this group predominantly comprises those older than 30 years of age; they have the average number of friends that strongly correlated to age. The number of friends in all other groups of influencers equals a constant 475 to 575, while the 30-year-olds, of whom 50% are female, average 160 Facebook friends.
Figure 12. Average number of friends with respect to 𝑆𝐼 scores of 𝑆𝐿𝑂𝐹 What follows are certain specifics of SLOF, the most truthful algorithm, with regard to the sample of experiment participants described in [4]. It is important to keep in mind that 𝑆𝐼 score groups do not hold an equal number of participants – this is easily observed in the 𝑆𝐿𝑂𝐹 distribution of 𝑆𝐼 scores [4]. A group of 𝑆𝐼 = ⟨0, 10] contains as much as 65% of the participants; 𝑆𝐼 = 0 holds 11% and 𝑆𝐼 = ⟨10, 20] holds 15% of the participants. The remaining 9% of participants altogether form a great minority with 𝑆𝐼 > 20. As is expected of a score such as 𝑆𝐼, it follows a power law with a
21 |
minority of participants being responsible for the majority of social influence. Therefore, no definitive conclusions regarding gender, age or number of friends with respect to social influence on Facebook can be drawn; instead, a larger, more diverse real-world sample of participants is needed. Comparing the specifics of 𝑆𝐿𝑂𝐹 to the state-of-the-art influence algorithm Klout would be noteworthy, but impossible as Klout has been a “black box” ever since official launch in 2008, meaning its proprietary method and processing details have been unknown and remain a secret. Only recently has Klout received attention from the scientific community with their paper outlining the principles and basic mechanism of calculating social influence combined with nine other SNSs [58]. The paper does not enable direct comparison of the Klout algorithm to SmartSocial Influence algorithms because: i) validation of Klout scores in the paper is not as formal as the validation provided in this paper; ii) validated scores include the top twenty people in specific categories (i.e., best ATP Tennis Players and Forbes Most Powerful Women); and iii) it would be difficult to collect Klout scores of all 361 participants, since the Klout API as of 2017 does not yet enable fetching of Klout scores programmatically in a streamlined fashion. Klout's previous publications of Klout score distributions are obsolete due to several (major) revisions of the algorithm in the meantime. When taking everything into consideration, Klout is an impressive SNS for calculating social influence, but more transparency regarding the Klout algorithm is needed for a fair and direct comparison with alternative approaches.
6. Conclusion This paper contributes to existing literature by proposing a new methodology for evaluating algorithms that calculate social influence in complex social networks. The paper has demonstrated the use of the proposed methodology using a case study in evaluating the accuracy and precision of four social influence calculation algorithms from the class of SmartSocial Influence algorithms. The concept and details of SmartSocial Influence algorithms have already been presented in [4][34][35]; the proposed methodology validates all of them and has determined that the SmartSocial Influence algorithm (SLOF) is the most accurate and precise among them. This paper also contributes to existing literature by identifying the social influence calculation algorithm that offers higher accuracy and precision as benchmarked against the state-of-the-art LRA algorithm. More broadly, the paper deals with a novel approach to social network user profiling with the goal of utilising multi-source, heterogeneous user data in order to infer new knowledge about users in terms of their social influence. By doing so, the paper addresses an ongoing research challenge in utilising such vast amounts of multi-source, heterogeneous user data with the goal of identifying key, socially influential actors in the process of provisioning information and communication services. These actors are users equipped with smartphones, which reveals new information in regard to their social influence. This new information about a mobile smartphone user has not only scientific, but also industrial applications. For example, the best-evaluated novel algorithm for calculating a user’s social influence (i.e., SLOF) can be used by telecommunication operators for churn prevention and prioritizing customer care, or by social networking services for digital advertising and marketing campaigns.
| 22
Some constraints in the proposed approach do exist. First, while the proposed methodology evaluates social influence algorithms, the question remains as to how to evaluate the very proposed methodology in return. To the authors' best knowledge, this approach is the first methodology to compare algorithms when calculating social influence based solely on available ego-user data rather than complete data on all social network users. That said, the authors of this paper will pursue encouragement of other similar research groups to develop alternative methodologies for evaluating algorithms that calculate social influence or more general global user properties, in online social networks. Second, the proposed methodology in this paper was applied on four algorithms from the SmartSocial Influence algorithm class. One of those – LRA – is a state-of-the-art benchmarking algorithm, while the other three – SLOF, SAOF, SMOF – were previously developed by the authors of this paper. A more robust demonstration of the proposed methodology would include applying it on algorithms other than SmartSocial Influence class algorithms. This was not possible in this paper as the authors did not have access to (pseudo)code, test data and ground truth data for other algorithms that solely use ego-user data for calculating ego-user social influence. However, they do hope that other research groups developing such algorithms will apply the proposed methodology, presented in this paper, for benchmarking their algorithms against the SmartSocial Influence class of algorithms. For future work, the authors plan to demonstrate applicability of the proposed evaluation methodology to other global user properties in complex social networks extending beyond social influence. Furthermore, they plan to adapt the methodology such that it is directly applicable to other social networks other than Facebook and other types of social network users beyond humans, such as networked objects and smart devices forming the Social Internet of Things.
Competing interests The authors declare that there is no conflict of interest regarding the publication of this article.
Acknowledgments The authors acknowledge the support of research projects “Managing Trust and Coordinating Interactions in Smart Networks of People, Machines and Organizations”, funded by the Croatian Science Foundation under the grant UIP-11-2013-8813; “Ericsson Context-Aware Social Networking for Mobile Media”, funded by the Unity through Knowledge Fund; and “A Platform for Contextaware Social Networking of Mobile Users”, funded by Ericsson Nikola Tesla. This research has also been partly supported by the European Regional Development Fund under the grant KK.01.1.1.01.0009 (DATACROSS). Furthermore, the authors would like to thank all participants who provided their personal data by installing the SmartSocial Android application and participating in questionnaires by which they greatly contributed to this research.
23 |
Supplementary materials The paper is supplemented with the Excel file named “SmartSocial Influence evaluation dataset (anonymised)”, which contains detailed evaluation results. Data in the file is anonymised to assure the privacy of individuals who participated in the evaluation. This dataset is also available at http://sociallab.science/datasets.
References [1]
Statista. Available: http://www.statista.com [Accessed: 21/08/2017]
[2]
M. Pticek, V. Podobnik, and G. Jezic, “Beyond the Internet of Things: The Social Networking of Machines,” International Journal of Distributed Sensor Networks, pp. 1-15, 2016.
[3]
L. Yufei, P. Dechang, and C. Lin, “Mining Community-Level Influence in Microblogging Network: A Case Study on Sina Weibo,” Complexity, vol. 2017, Article ID 4783159, 16 pages, 2017.
[4]
V. Smailovic and V. Podobnik, “Mining Social Networks for Calculation of SmartSocial Influence,” Journal of Universal Computer Science, vol. 22, no. 3, pp. 394–415, 2016.
[5]
Q. Wang, X. Yu, and X Zhang, “A Connectionist Model-Based Approach to Centrality Discovery in Social Networks,” In: Cao L. et al. (eds) Behavior and Social Computing. Lecture Notes in Computer Science, vol. 8178. Springer, Cham, 2013.
[6]
C. Kiss and M. Bichler, “Identification of influencers - measuring influence in customer networks,” Decision Support Systems, vol. 46, no. 1, pp. 233–253, 2008.
[7]
J. Golbeck and J. Hendler, “Inferring binary trust relationships in web-based social networks,” ACM Transactions on Internet Technology, vol. 6, no. 4, pp. 497-529, 2006.
[8]
V. Podobnik, D. Striga, A. Jandras, and I. Lovrek, “How to Calculate Trust between Social Network Users?,” Proceedings of the 20th International Conference on Software, Telecommunications and Computer Networks (SoftCOM 2012). Split, Croatia: IEEE, 2012.
[9]
M. Stupalo, J. Ilic, L. Humski, Z. Skocir, D. Pintar, and M. Vranic, “Applying the Binary Classification Methods for Discovering the Best Friends on an Online Social Network,” Proceedings of the 14th International Conference on Telecommunications ConTEL 2017. Zagreb, Croatia: IEEE, 2017. 155-161
[10]
J. Ilic, L. Humski, D. Pintar, M. Vranic, and Z. Skocir, “Proof of Concept for Comparison and Classification of Online Social Network Friends Based on Tie Strength Calculation Model,” Proceedings ICIST 2016. Belgrade, Serbia: Society for Information Systems and Computer Networks, 2016. 159-164
[11]
J. Ugander, B. Karrer, L. Backstrom, and C. Marlow, “The Anatomy of the Facebook Social Graph,” 2011, https://arxiv.org/abs/1111.4503
[12]
M. Gabielkov, A. Rao, and A. Legout, “Studying social networks at scale: macroscopic anatomy of the twitter social graph,” The 2014 ACM International Conference on Measurement and Modelling of Computer Systems. Austin, USA: ACM, pp. 277-288
[13]
S. Bhagat, M. Burke, C. Diuk, I. O. Filiz, and S. Edunov: Three and a half degrees of separation (2016). Available: https://research.fb.com/three-and-a-half-degrees-of-separation [Accessed: 23/11/2017]
[14]
A. Landherr, B. Friedl, and J. Heidemann, “A Critical Review of Centraility Measures in Social Networks,” Bussiness and Information Systems Engineering, vol. 2, no. 6, pp. 371–385, 2010.
| 24
[15]
J. C. Turner, Social influence, 1st ed. Pacific Grove, Calif: Brooks/Cole, 1991.
[16]
Klout, Inc., “Klout | Be Known For What You Love,” Klout, 2016. [Online]. Available: https://klout.com/home. [Accessed: 30/07/2017].
[17]
Kred TLD, “Kred | The Home of Influence,” 2017. [Online]. Available: http://home.kred. [Accessed: 30/07/2017].
[18]
Runtime Collective Limited (Brandwatch), “PeerIndex: Social Analytics & Influence Tools - Brandwatch,” 2017. [Online]. Available: https://www.brandwatch.com/peerindex-and-brandwatch. [Accessed: 30/07/2017].
[19]
Tellagence, “Tellagence,” 2017. [Online]. Available: http://www.tellagence.com. [Accessed: 30/07/2017].
[20]
openinfluence.com, “Creative + Data-Driven Influencer Marketing Services,”, previously instabrand.com, 2017. [Online]. Available: http://www.openinfluence.com. [Accessed: 21/08/2017].
[21]
Klout, Inc., “Klout Score,” Klout, 2017. [Online]. Available: https://klout.com/corp/score. [Accessed: 21/08/2017].
[22]
M. Deutsch and H. B. Gerard, “A study of normative and informational social influences upon individual judgment.,” The Journal of Abnormal and Social Psychology, vol. 51, no. 3, pp. 629–636, 1955.
[23]
S. E. Asch, “Opinions and Social Pressure,” in Scientific American, vol. 193, San Francisco, California: W. H. Freeman and Co., 1955, pp. 31–35.
[24]
S. Milgram, “Behavioral Study of obedience,” The Journal of Abnormal and Social Psychology, vol. 67, no. 4, pp. 371–378, 1963.
[25]
C. Haney, C. Banks, and P. Zimbardo, “Interpersonal Dynamics in a Simulated Prison,” International Journal of Criminology and Penology, vol. 1, pp. 69–97, 1973.
[26]
B. Latané, “The psychology of social impact,” American Psychologist, vol. 36, no. 4, pp. 343–356, 1981.
[27]
R. B. Cialdini, Influence: Science and Practice, 4 edition. Boston, MA: Allyn & Bacon, 2000.
[28]
M. J. Rosenfeld and R. J. Thomas, “Searching for a Mate: The Rise of the Internet as a Social Intermediary,” American Sociological Review, vol. 77, no. 4, pp. 523–547, Aug. 2012.
[29]
M. Fink and J. Spoerhase, “Maximum Betweenness Centrality: Approximability and Tractable Cases,” arXiv:1008.3503 [cs], Aug. 2010.
[30]
K.-I. Goh, E. Oh, B. Kahng, and D. Kim, “Betweenness centrality correlation in social networks,” Phys. Rev. E, vol. 67, no. 1, p. 17101, Jan. 2003.
[31]
S. Borgatti, “Centrality and network flow,” Social Networks, 2005.
[32]
M. Cha, H. Haddadi, F. Benevenuto, and K. P. Gummadi, “Measuring User Influence in Twitter: The Million Follower Fallacy,” in Fourth International AAAI Conference on Weblogs and Social Media, 2010.
[33]
A. A. Rad and M. Benyoucef, “Towards Detecting Influential Users in Social Networks,” in E-Technologies: Transformation in a Connected World, G. Babin, K. Stanoevska-Slabeva, and P. Kropf, Eds. Springer Berlin Heidelberg, 2011, pp. 227–240.
[34]
V. Smailovic, D. Striga, D.-P. Mamic, and V. Podobnik, “Calculating User’s Social Influence through the SmartSocial Platform,” in Proceedings of Software, Telecommunications and Computer Networks Conference (SoftCOM), Split, Croatia, 2014, pp. 383–387.
[35]
V. Smailovic, D. Striga, and V. Podobnik, “Advanced User Profiles for the SmartSocial Platform: Reasoning upon Multi-Source User Data,” in ICT Innovations 2014 Web Proceedings, Ohrid, Macedonia, 2014.
[36]
American Educational Research Association (AERA), American Psychological Association (APA), and National Council on Measurement in Education (NCME), The Standards for Educational and Psychological Testing. Washington, DC, US, 2014.
[37]
C. H. Lawshe, “A Quantitative Approach to Content Validity,” Personnel Psychology, vol. 28, no. 4, pp. 563–575, Dec. 1975.
25 |
[38]
F. J. Gravetter and L.-A. B. Forzano, Research methods for the behavioral sciences, 4th ed. Australia ; Belmont, CA: Wadsworth, 2012.
[39]
I. B. Weiner and W. E. Craighead, Eds., The Corsini encyclopedia of psychology, 4th ed. Hoboken, NJ: Wiley, 2010.
[40]
R. McCarney, J. Warner, S. Iliffe, R. van Haselen, M. Griffin, and P. Fisher, “The Hawthorne Effect: a randomised, controlled trial,” BMC Medical Research Methodology, vol. 7, no. 1, p. 30, 2007.
[41]
D. L. Sackett, “Bias in analytic research,” Journal of Chronic Diseases, vol. 32, no. 1–2, pp. 51–63, Jan. 1979.
[42]
R. Rosenthal and R. L. Rosnow, Artifacts in behavioral research Robert Rosenthal and Ralph L. Rosnow’s classic books: a re-issue of Artifact in behavioral research, Experimenter effects in behavioral research and the volunteer subject. New York: Oxford University Press, 2009.
[43]
A. A. J. Marley and J. J. Louviere, “Some probabilistic models of best, worst, and best–worst choices,” Journal of Mathematical Psychology, vol. 49, no. 6, pp. 464–480, Dec. 2005.
[44]
J. J. Louviere, T. N. Flynn, and A. A. J. Marley, Best-worst scaling: theory, methods and applications. Cambridge; New York: Cambridge University Press, 2015.
[45]
A. Papoulis, “Bernoulli Trials,” in Probability, random variables, and stochastic processes, 2nd ed., New York: McGraw-Hill, 1984, pp. 57–63.
[46]
M. Krzywinski and N. Altman, “Points of Significance: Visualizing samples with box plots,” Nature Methods, vol. 11, no. 2, pp. 119–120, Jan. 2014.
[47]
M. Spitzer, J. Wildenhain, J. Rappsilber, and M. Tyers, “BoxPlotR: a web tool for generation of box plots,” Nature Methods, vol. 11, no. 2, pp. 121–122, Jan. 2014.
[48]
R. A. Maronna and R. H. Zamar, “Robust Estimates of Location and Dispersion for High-Dimensional Datasets,” Technometrics, vol. 44, no. 4, pp. 307–317, 2002.
[49]
D. G. Bonett, “Confidence interval for a coefficient of quartile variation,” Computational Statistics & Data Analysis, vol. 50, no. 11, pp. 2953–2957, 2006.
[50]
P. J. Rousseeuw and C. Croux, “Alternatives to the Median Absolute Deviation,” Journal of the American Statistical Association, vol. 88, no. 424, p. 1273, 1993.
[51]
P. Wessa, “Free Statistics Software (version 1.1.23-r7),” Office for Research Development and Education, 2016. [Online]. Available: http://www.wessa.net. [Accessed: 13-Mar-2016].
[52]
P. J. Huber and E. Ronchetti, Robust statistics, 2nd edition. Hoboken, N.J: Wiley, 2009.
[53]
C. Leys, C. Ley, O. Klein, P. Bernard, and L. Licata, “Detecting outliers: Do not use standard deviation around the mean, use absolute deviation around the median,” Journal of Experimental Social Psychology, vol. 49, no. 4, pp. 764–766, Jul. 2013.
[54]
J. Masters, “Ozone Hole FAQ | Weather Underground,” Weather Underground, 2011. [Online]. Available: http://www.wunderground.com/climate/holefaq.asp. [Accessed: 08-Mar-2016].
[55]
C. Gourieroux and A. Monfort, Statistics and econometric models, vol. 1. Cambridge [England]; New York, NY, USA: Cambridge University Press, 1995.
[56]
X. He, D. G. Simpson, and S. L. Portnoy, “Breakdown Robustness of Tests,” Journal of the American Statistical Association, vol. 85, no. 410, p. 446, 1990.
[57]
W. C. Navidi, Statistics for engineers and scientists, 3rd ed. New York: McGraw-Hill, 2011.
[58]
A. Rao, N. Spasojevic, Z. Li, and T. DSouza, “Klout Score: Measuring Influence Across Multiple Social Networks,” arXiv:1510.08487 [cs], 2015.
| 26
Appendices: Questionnaires The following questionnaires were developed and carried out using Google Forms (https://docs.google.com/forms). The content of the questionnaires below has been translated into English, as originally the questionnaires were given to participants in their native Croatian language. Appendix 1. Pre-questionnaire (content validity) This pre-questionnaire was given to 22 experts in the form of 30 questions (items); each item is scored between [1.0, 5.0], with the threshold for passing content validity > 2.1. Next to each question 𝑄𝑖 is its score 𝐶𝑉(𝑄𝑖 ). Questions marked as chosen are used for the next step (face validity pre-questionnaire). Appendix Table 1. Pre-questionnaire (content validity) given to experts INSTRUCTIONS The pre-questionnaire contains 30 questions which you need to score 1 to 5. The goal is to explore which questions are most suitable in determining social influence. A very suitable question is given a score of 5, the least suitable is given a 1. Best-scored questions in this pre-questionnaire will be used in compiling a new questionnaire which will subsequently be forwarded to participants. The scores you provide directly affect the process of screening for the most suitable questions. By participating in this pre-questionnaire as an expert, you are providing support to the final phase of Vanja Smailović's PhD research. It is important to understand the meaning of social influence. While scoring the questions, keep these definitions in mind at all times: - Social influence is a measure of how people, directly or indirectly, affect the thoughts, feelings and actions of others; - Social influence – the ability to drive action; - Social influence – occurs when a person’s emotions, opinions and behaviours are affected by other persons.
𝑸𝒊
Question text
𝑸𝟏
You've noticed a post “Dangerous levels of chlorine detected in our hot water used for showering.” A greater impression on you would leave a post by your Facebook friend: _______ or _______.
12345
2.95
✓
𝑸𝟐
You've noticed a post “If every one of us recycled, we would halve CO2 emissions and receive state/country stimulus for it." You would recycle more frequently if it were posted by your Facebook friend: _______ or _______ .
12345
3.36
✓
𝑸𝟑
You've noticed a post "Disaster has struck, the Nepalese are left with no food, water and electricity. I've donated money, here are instructions for you to do the same." You would donate a greater amount if it were posted by your Facebook friend: _______ or _______
12345
3.05
✓
Chosen
Passed
𝑪𝑽(𝑸𝒊 )
Available answers
The newly compiled questionnaire (using some of the questions below) will be given to non-experts who initially will not be aware of its purpose (surveying social influence). They, i.e., the non-experts, will have 4 pairs of their Facebook friends offered as answers, unlike the scale of 1 to 5 noted here. In other words, each non-expert will choose the more influential friend in a pair – without being directly asked about their respective social influence. Your task is to score the given “criterion” in each of the questions, with respect to how much it conforms to the definitions of social influence (given above). The pre-questionnaire, unlike the next questionnaire, does not show you Facebook-friend pairs as answers, because they will be tailored and specific for each non-expert. Your role as an expert is to focus on the questions, not the answers given to future non-expert participants.
27 |
𝑸𝒊
Question text
Available answers
𝑪𝑽(𝑸𝒊 )
Passed
Chosen
𝑸𝟒
You’re dissatisfied with your mobile operator. You've noticed a post "I've moved to my new telco X, I think they’re better." You would more likely change your mobile operator if it were posted by your Facebook friend: _______ or _______
12345
3.59
✓
✓✓
𝑸𝟓
You've noticed a post “Gas station X has the best fuel.” You would more likely refuel more frequently at the mentioned gas station if it were posted by your Facebook friend: _______ or _______
12345
3.36
✓
𝑸𝟔
You've noticed a post “Smoking while pregnant greatly increases chances of health issues in a child.” You would more likely spread this information if it were posted by your Facebook friend: _______ or _______
12345
2.55
✓
𝑸𝟕
You've noticed a post “Electricity bills will soon go up.” You would search for more details if it were posted by your Facebook friend: _______ or _______
12345
3.50
✓
𝑸𝟖
You've noticed a post “Video out showing New Zealand's prime minister slipping on a banana.” You would more likely watch the video if it were posted by your Facebook friend: _______ or _______
12345
2.82
✓
𝑸𝟗
You've noticed a post "Hidden camera caught them in adultery." You would watch the video to a greater length if it were posted by your Facebook friend: _______ or _______
12345
2.09
𝑸𝟏𝟎
You've noticed a post “World leaders at their last meeting decided to increase nuclear armament.” You would search for more details if it were posted by your Facebook friend: _______ or _______
12345
3.68
✓
𝑸𝟏𝟏
You've noticed a post “Toothpaste X discounted in all shopping malls.” You more likely go and buy the toothpaste if it were posted by your Facebook friend: _______ or _______
12345
2.41
✓
𝑸𝟏𝟐
You've noticed a post “Travel agency X offers phenomenal discounts for Asia.” You would search for more details if it were posted by your Facebook friend: _______ or _______
12345
2.86
✓
𝑸𝟏𝟑
You've noticed a post “Concert tickets to see X selling out soon.” You would search for more details if it were posted by your Facebook friend: _______ or _______
12345
2.91
✓
𝑸𝟏𝟒
You've noticed a post “I'm calling everyone to join a public protest against getting rid of future generation pensions.” You would more likely join this protest if it were posted by your Facebook friend: _______ or _______
12345
4.0
✓
✓✓
𝑸𝟏𝟓
You've noticed a post that explains the proven downside of your preferred political party. You would more likely change your vote if it were posted by your Facebook friend: _______ or _______ You've noticed a post “People killed in a terrorist attack in Ireland.” You would search for more details if it were posted by your Facebook friend: _______ or _______
12345
4.27
✓
✓✓
12345
3.23
✓
You've noticed a post "Home visits by National TV bill collectors more frequent in the following month." You would less likely open your doors to strangers if it were posted by your Facebook friend: _______ or _______
12345
3.14
✓
𝑸𝟏𝟔 𝑸𝟏𝟕
| 28
✓✓
𝑸𝒊
Question text
Available answers
𝑪𝑽(𝑸𝒊 )
Passed
Chosen
𝑸𝟏𝟖
You've noticed a post "Quickly pay your monthly bills, otherwise fines follow within 24 hours according to latest news." Reading the post would to a greater extent cause restlessness if it were posted by your Facebook friend: _______ or _______
12345
3.77
✓
✓✓
𝑸𝟏𝟗
You've noticed a motivational post with thoughts about a brighter future, more jobs and possibilities, and greater salaries where you live. Reading the post would more likely cause peacefulness in you if it were posted by your Facebook friend: _______ or _______
12345
4.0
✓
✓✓
𝑸𝟐𝟎
You've noticed a post “Tensions between Balkan EU members might lead to war.” Reading the post would more likely cause restlessness if it were posted by your Facebook friend: _______ or _______
12345
3.64
✓
✓✓
𝑸𝟐𝟏
You've noticed a post “Immigrants in EU constantly on the rise.” Reading the post would more likely spark an interest if it were posted by your Facebook friend: _______ or _______
12345
3.91
✓
✓✓
𝑸𝟐𝟐
You've noticed a post “Parliament representatives physically confront each other at the morning sitting.” Reading the post would more likely surprise you if it were posted by your Facebook friend: _______ or _______
12345
2.68
✓
𝑸𝟐𝟑
You've noticed a motivational post about exercise, more physical activity and health benefits. Reading the post would more likely motivate you if it were posted by your Facebook friend: _______ or _______
12345
3.95
✓
✓✓
𝑸𝟐𝟒
You are planning on seeing the movie X. You've noticed a post “I've seen X, it's horrible.” Reading the post would more likely dissuade you from watching the film if it were posted by your Facebook friend: _______ or _______
12345
4.41
✓
✓✓
𝑸𝟐𝟓
You are planning a trip to a neighboring country/state X, it's snowing outside. You've noticed a post "X's police officers fine drivers without winter tires." Reading the post would more likely persuade you to buy winter tires if it were posted by your Facebook friend: _______ or _______
12345
3.23
✓
𝑸𝟐𝟔
You are driving on X section of road . You've noticed a post “Police radar-tracking speed at section X." Reading the post would more likely cause you to obey the speed limit if it were posted by your Facebook friend: _______ or _______ "
12345
3.0
✓
𝑸𝟐𝟕
You are driving on the road section X. You've noticed a post "Terrible traffic accident at section X." Reading the post would more likely disturb you if it were posted by your Facebook friend: _______ or _______ "
12345
2.64
✓
𝑸𝟐𝟖
You are planning a trip to city X. You've noticed a post "City X caught in bad weather." Reading the post would more likely worry/disappoint you if it were posted by your Facebook friend: _______ or _______
12345
2.27
✓
𝑸𝟐𝟗
You are planning a trip to city X. You've noticed a post “City X has seen a rise in crime-rates in recent years.” Reading the post would more likely worry you if it were posted by your Facebook friend: _______ or _______
12345
3.18
✓
𝑸𝟑𝟎
You are planning a trip to city X. You've noticed a post “City X has
12345
3.09
✓
29 |
seen a rise in crime-rates in recent years.” Reading the post would more likely persuade you to re-plan the trip if it were posted by your Facebook friend: _______ or _______
Appendix 2. Pre-questionnaire (face validity) This pre-questionnaire was given to 22 non-experts in form of 10 questions (items); each item is scored between [1.0, 5.0], with the top 5 best (plus one fixed) questions chosen for the Main questionnaire. Next to each question 𝑄𝑖 is its score 𝐹𝑉(𝑄𝑖 ). Appendix Table 2. Pre-questionnaire (face validity) given to non-experts INSTRUCTIONS Before beginning, pull out a piece of paper and neatly write down 8 Facebook friends that first come to your mind. After doing so, assign each friend a letter – A, B, C, D, E, F, G and H – and proceed to complete the questionnaire. This questionnaire contains 10 questions. By participating, you are supporting the final phases of Vanja Smailović's PhD research.
𝑸𝒊
Question text
Available answers
𝑭𝑽(𝑸𝒊 )
Passed
Chosen
Every question requires reading an imaginary Facebook post. For each of the questions, answers are offered as PAIRS of your Facebook friends. Refer to your annotations A-H above. All of the questions have identical answers (Facebook-friend pairs). In other words, you always get to choose between the same Facebook-friends – it is the questions that changes and differs, not the answers.
𝑸𝟒
You’re dissatisfied with your mobile operator. You've noticed a post "I've moved to my new telco X, I think they’re better." You would more likely change your mobile operator if it were posted by your Facebook friend: _______ or _______
A or H B or G C or F D or E
3.32
✓
✓✓
𝑸𝟏𝟎
You've noticed a post “World leaders at their last meeting decided to increase nuclear armament.” You would search for more details if it were posted by your Facebook friend: _______ or _______
A or H B or G C or F D or E
3.73
✓
✓✓
𝑸𝟏𝟒
You've noticed a post “I'm calling everyone to join a public protest against getting rid of future generation pensions.” You would more likely join this protest if it were posted by your Facebook friend: _______ or _______
A or H B or G C or F D or E
3.45
✓
𝑸𝟏𝟓
You've noticed a post that explains the proven downside of your preferred political party. You would more likely change your vote if it were posted by your Facebook friend: _______ or _______
A or H B or G C or F D or E
3.86
✓
𝑸𝟏𝟖
You've noticed a post "Quickly pay your monthly bills, otherwise fines follow within 24 hours according to latest news." Reading the post would to a greater extent cause restlessness if it were posted by your Facebook friend: _______ or _______
A or H B or G C or F D or E
3.55
✓
𝑸𝟏𝟗
You've noticed a motivational post with thoughts about a brighter future, more jobs and possibilities, and greater salaries where you live. Reading the post would more likely calm you down if it were posted by your Facebook friend: _______ or ______
A or H B or G C or F D or E
3.59
✓
✓✓
𝑸𝟐𝟎
You've noticed a post “Tensions between Balkan EU members might lead to war.” Reading the post would more likely cause restlessness if it were posted by your Facebook friend: _______ or _______
A or H B or G C or F D or E
3.77
✓
✓✓
| 30
✓✓
Question text
Available answers
𝑭𝑽(𝑸𝒊 )
Passed
𝑸𝟐𝟏
You've noticed a post “Immigrants in EU constantly on the rise.” Reading the post would more likely spark an interest if it were posted by your Facebook friend: _______ or _______
A or H B or G C or F D or E
3.45
✓
𝑸𝟐𝟑
You've noticed a motivational post about exercise, more physical activity and health benefits. Reading the post would more likely motivate you if it were posted by your Facebook friend: _______ or _______
A or H B or G C or F D or E
3.45
✓
𝑸𝟐𝟒
You are planning on seeing the movie X. You've noticed a post “I've seen X, it's horrible.” Reading the post would more likely dissuade you from watching the film if it were posted by your Facebook friend: _______ or _______
A or H B or G C or F D or E
3.55
✓
✓✓
𝑸+
You have reached the final question. It is unique and very important. You will reply to it in the same manner as you replied to the questions earlier. Once more, you will choose a Facebook friend from the 4 pairs offered in answers – only this time, pay attention to the definitions of social influence below:
A or H B or G C or F D or E
-
-
-
Chosen
𝑸𝒊
- Social influence is a measure of how people, directly or indirectly, affect the thoughts, feelings and actions of others; - Social influence – the ability to drive action; - Social influence – occurs when one's emotions, opinions and behaviours are affected by others. Read the definitions of social influence above. For each of the pairs, choose the Facebook friend whom you consider has the GREATER social influence on you on Facebook. While doing so, try to encompass all 3 definitions above as best as you can.
Appendix 3. Main questionnaire (algorithm validity) The main questionnaire was given to 16 participants with the goal of obtaining measurement scores for each algorithm, used in their validation and evaluation. The main questionnaire uses questions which “passed” both validities in pre-questionnaires; they are both content-valid and facevalid.
31 |
Appendix Table 3. Main questionnaire given to participants The questionnaire contains 6 questions and takes 10 minutes to complete. Your answers will be anonymized and analysed collectively for all publishing or discussion purposes. By participating, you are supporting the final phases of Vanja Smailović's PhD research. Each of the 6 questions requires reading an imaginary Facebook post. Each question offers several PAIRS of your Facebook friends which are offered as answers. Your task, for each of the pairs, is to choose the Facebook friend which you consider to be the correct answer for a given question. If the question seems absurd or inapplicable, choose the Facebook friend whom you consider to be MORE correct. Read all the questions in advance – it is advisable to at least skim through them all before proceeding. IMPORTANT: If the pairs repeat among the 6 questions – choose your answer always while paying attention to the QUESTION. On the other hand, watch out for pairs that repeat in a SINGLE question – those pairs require the same answer, because their goal is to check consistency. In other words, the same pairs between DIFFERENT questions are allowed to (and can) have a different answer – same pairs within a SINGLE QUESTION CANNOT!
𝑸𝒊
Question text
Available answers
Do not communicate or consult with others while filling out the questionnaire and remain concentrated. You are allowed to go back in steps – the questionnaire is finalized, submitted and locked only after you press Submit. In case of any questions or doubts, please call Vanja at [telephone number provided] to avoid making mistakes or errors.
𝑸𝟒
You’re dissatisfied with your mobile operator. You've noticed a post "I've moved to my new telco X, I think they’re better." You would more likely change your mobile operator if it were posted by your Facebook friend: _______ or _______
12 Facebookfriend pairs
𝑸𝟏𝟎
You've noticed a post “World leaders at their last meeting decided to increase nuclear armament.” You would search for more details if it were posted by your Facebook friend: _______ or _______
12 Facebookfriend pairs
𝑸𝟏𝟓
You've noticed a post that explains the proven downside of your preferred political party. You would more likely change your vote if it were posted by your Facebook friend: _______ or _______
12 Facebookfriend pairs
𝑸𝟏𝟗
You've noticed a motivational post with thoughts about a brighter future, more jobs and possibilities, and greater salaries where you live. Reading the post would more likely cause peacefulness in you if it were posted by your Facebook friend: _______ or _______
12 Facebookfriend pairs
𝑸𝟐𝟎
You've noticed a post “Tensions between Balkan EU members might lead to war.” Reading the post would more likely cause restlessness if it were posted by your Facebook friend: _______ or _______
12 Facebookfriend pairs
𝑸𝟐𝟒
You are planning on seeing the movie X. You've noticed a post “I've seen X, it's horrible.” Reading the post would more likely dissuade you from watching the film if it were posted by your Facebook friend: _______ or _______
12 Facebookfriend pairs
| 32