Atmosphere 2013, 4, 365-382; doi:10.3390/atmos4040365 OPEN ACCESS
atmosphere ISSN 2073-4433 www.mdpi.com/journal/atmosphere Article
A Methodology to Infer Crop Yield Response to Climate Variability and Change Using Long-Term Observations Mustapha El-Maayar * and Manfred A. Lange Energy, Environment and Water Research Center, The Cyprus Institute, Guy Ourisson Building, P.O. Box 27456, CY-1645 Nicosia, Cyprus; E-Mail:
[email protected] * Author to whom correspondence should be addressed; E-Mail:
[email protected]; Tel.: +357-22-208-673; Fax: +357-22-208-625. Received: 31 August 2013; in revised form: 4 October 2013 / Accepted: 8 October 2013 / Published: 8 November 2013
Abstract: A new methodology to extract crop yield response to climate variability and change from long-term crop yield observations is presented in this study. In contrast to the existing first-difference approach (FDA), the proposed methodology considers that the difference in value between crop yields of two consecutive years reflects necessarily the contributions of climate and management conditions, especially at large spatial scales where both conditions may vary significantly from one year to the next. Our approach was applied to remove the effect of non-climatic factors on crop yield and, hence, to isolate the effect of the observed climate change between 1961 and 2006 on three widely crops grown in three Mediterranean countries—namely wheat, corn and potato—using national-level crop yield observations’ time-series. Obtained results show that the proposed methodology provides us with a ground basis to improve substantially our understanding of crop yield response to climate change at a scale that is relevant to large-scale estimations of agricultural production and to food security analyses; and therefore to reduce uncertainties in estimations of potential climate change effects on agricultural production. Furthermore, a comparison of outputs of our methodology and FDA outputs yielded a difference in terms of maize production in Egypt, for example, that exceeds the production of some neighbouring countries. Keywords: crop yield; climate change; new methodology; reducing uncertainties
Atmosphere 2013, 4
366
1. Introduction Crop yield response to climate change has received major attention for about three decades now, which is easily justified by the critical ramifications that such a response could have on global food security, human health and worldwide socio-economic stability [1–4]. The critical importance of understanding crop yield response to climate change triggered the development of numerous crop models varying from simple statistical to complex process based schemes that simulate mechanistically key physical and physiological processes involved in crop growth and development (e.g., [5,6]). However, despite the tremendous progress made so far in crop modelling science, existing crop models are still suffering serious shortcomings [7–9]. It has been shown for instance that crop models are still unable to reliably reproduce some critical processes governing crop growth and yield, such as CO2 fertilization and crop rotation effects on yield [10,11]. Effects of climate extremes on plant growth and development, and on crop yield are also still poorly represented in current crop models [12,13]. Consequently, the important deficiencies that are still associated with their simulations contribute greatly to the large uncertainties in estimates of climate change effects on crop production. To reduce these uncertainties, the use of statistical models has been suggested [14], especially at broad spatial scales because of their flexibility and usefulness at such scales at which climate change projections are also usually available and most reliable. Though there is reasonable justification supporting that argument, there is a common general belief that it is preferable to use process-based crop models at any scale, especially when the predictions are made under changing environmental conditions [13]. Process-based models can, indeed, account for some important physiological processes and their interactions that could affect crop yield such as plant acclimation to CO2 and temperature [15,16], while statistical models cannot. Thus, that sound common belief implicitly suggests that efforts to reduce uncertainties in estimations of large scale crop production under changing environmental conditions must focus on those made by process-based crop models as a priority. To carry-out such an objective, one may consider the following actions: i. ii.
Carefully analyse available long-term observations of crop yields in order to infer the most likely crop yield response to climate variability and change; Use the inferred response to test and calibrate crop models under current conditions.
Current conditions in point (ii) refer to relatively long periods over which significant changes in climate conditions have been detected already, as further discussed in Section 3.1. Preferably furthermore, the spatial scale of the analysed observations (point (i)) should be compatible as much as possible with the scale of application of the inferred crop yield response. This is because one may argue, for example, that the crop yield response to climate change that could be extracted from observations made at a farm level would hardly reflect regional or national level conditions where soil, climate and grown cultivars among other conditions may vary from one region to the other. Consequently, that extracted farm-level response may not be ideal to test and calibrate a model that is intended to be used for large scale estimations. This study where the ultimate goal is to contribute to the improvement of large scale estimations of climate change effects on crop production emphasizes on the investigation of the abovementioned point (i). To satisfy the spatial-scale requirement discussed in the previous paragraph, time-series of
Atmosphere 2013, 4
367
national-level crop yield observations were used. These observations that cover the 1961–2006 period were analysed and a methodology to extract the contribution of climate change to crop yield trends throughout long periods, such as the 46 years’ time interval of our study, is suggested, analysed and discussed. 2. Method 2.1. Approach and Formulations The main objective of this study is to infer the observed crop yield response to climate variability and change from long-term crop yield observations, especially at a scale that is relevant to large-scale estimations of climate change impacts on crop production and food security. National level crop yield datasets of the Food and Agricultural Organization (FAO; see Section 2.2) that were used in this study are a concrete example of such observations. Because crop yield is generally influenced by climatic and non-climatic factors, a simple methodology was developed to split between the contributions of each of these factors to the observed crop yield evolution so that the effect of the climate component on crop yield could be extracted and analysed. The starting point in our methodology is the first-difference approach (hereafter referred to as FDA), that was suggested by [17] and used in various studies to assess the effect of climate change on crop production in various part of the world (e.g., [17–22]). FDA assumes that the trend of the first-difference crop yield time-series (i.e., constructed time-series using the difference in crop yield from one year to the next), reflects exclusively the effect of climate. FDA assumes indeed that non-climatic factors, such as crop management, change slowly from one year to the next so that the crop yield first-differences eliminate the influence of these factors on the constructed time-series. Here, we believe that such an assumption and its reliability is questionable. In fact, at large spatial scales, for example (e.g., national or continental), where farming policies and orientations among regions may vary considerably, that assumption becomes particularly weak and even not valid because factors that influence crop production, such as fertilizer applications and crop chemical treatments, may vary substantially from one year to the next (e.g., [23]; see also Figure 1). Furthermore, it is well known that non-linearity characterizes the effect of climate and crop management interactions on crop yield variations (e.g., [24–27]). A small change in crop management may lead to an important change in crop yield. Consequently, crop-climate trend analyses based on FDA will undoubtedly lead to unwarranted conclusions about the crop yield response to climate change, especially at large spatial scales. Thus, it is obvious that the trend of the crop yield first-difference time-series reflects crop yield response to climate variability only when factors other than climate (i.e., fertilization, technology, etc.), that influence crop yield do not vary or vary very little. As an illustration, the fertilization effect of the annual increase of atmospheric CO2 (less than 2 ppm) on crop yield, which is very small from one year to the next [11,28], can be easily removed by FDA. In the extreme case where climate conditions do not vary, the crop yield first-differences reflect exclusively the effect of non-climatic factors. In all other intermediate cases, where both climatic and non-climatic factors influence crop yield significantly, it becomes difficult to distinguish the contribution of each of these factors to crop yield
Atmosphere 2013, 4
368
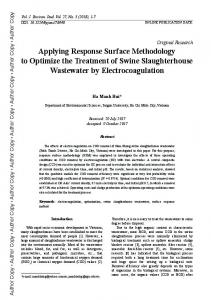
variability given the complex interactions between crop growing conditions and the non-linear crop yield response to these interactions. Hereafter, we describe our methodology to separate between climatic and non-climatic contributions to crop yield trends. Figure 1. Temporal evolution of total nitrogen (N) consumption in four Mediterranean countries. It is shown that in all countries, important interannual variations in N consumption may occur (see Section 2.1 for more details).
At any time (year), crop yield (y) can be expressed as the sum of management and climate contributions, as follows: =
+
(1)
where yc and ym are the climate and crop management (including technology and any other non-climatic factor) induced crop yields, respectively. The temporal variation of y can then be expressed as: =
+
(2)
Because ym depends exclusively upon crop management variations, Equation (2) can be further expressed as follows: =
+
(3)
=
+
(4)
or
Though Equations (3) and (4) are strictly identical, the use of Equation (4) is, hereafter, preferred to Equation (3) because crop yield data are usually available only in y form. The two equations are identical for the following reason:
Atmosphere 2013, 4
369 =
=
+
;
=
+
(
1)
because = 0
yc is indeed the climate-induced crop yield, which is independent from crop management. The subscript c outside the brackets refers to constant climate (see below for more details). In order to avoid any potential confusion in what follows, it is very important to note that according to the differential calculus [29], constant climate conditions are required to compute the second term of the right side of Equations (2–6) (management contribution), while constant management conditions are required to compute the first term of the right hand side of the same equations (climate contribution). In this study, the climate contribution is obtained by subtracting the calculated management contribution from the total yield (left hand side of Equations (2–6)). Equation (4) can be further expressed as: =
+
(5)
Leading to the following more simplified expression: = where am (=
+
) is the crop yield variation as a function of crop management.
(6) ,
are the annual variation of crop management, total crop yield and climate-induced crop yield first-differences, respectively. Yearly time-step computation of the second term of the right hand side of Equation (6) and subtraction of its value from Δy will provide us with estimates of Δyc, which represents the core objective of this study. The obtained Δyc time-series represents indeed the crop yield response to climate change. As shown in Equation (4), the computation of the management term am requires constant climate conditions because, as explained above, am depends exclusively upon management practices as it represents the variation of crop yield that is inherent to the sole variation of crop managements. While in reality climate vary from one year to the next, such a requirement implies in practice that a relationship between crop yield and crop management over a given time interval can be used to compute am only under the condition where climate does not show any statistically significant change. To satisfy this condition, our approach was then: To select a sub-period within the 1961–2006 time interval during which the change in climate was statistically not significant. Such a period could be either continuous or discontinuous in time; i. ii.
To use crop yield and management observations over the selected sub-period to derive a relationship that statistically links interannual crop yield and crop management variations; and To apply the obtained relationship between crop yield and management to the entire period of study (i.e., 1961–2006), since that relationship satisfies the climate constant conditions and is time independent.
Atmosphere 2013, 4
370
To avoid any possible confusion, we strongly remind here that the “statistically constant climate condition” mentioned above apply only for the computation of the management term am, and does not mean that the climate is considered as “constant” for the whole study. Moreover, because agricultural practices may involve various types of management, the crop management term in Equation (6) can be further expanded to include different individual management contributions, such as crop fertilization, irrigation, pesticide application, and genotype improvement. More specifically, the management term could be expressed as follows: =
+
+
+, … , +
(7)
where F, I, G and X refer to fertilizer application, irrigation, genotype improvement, and any other potential management practices including technological improvements, respectively. The form of Equation (7) stems from the fact that crop yield has a climate component and one or more management components (fertilization, irrigation, etc.). For simplification, in fact, only one management term was represented in Equation (2) (a generic term). By incorporating various management components that contribute to the final crop yield in Equation (2) and following the same mathematical development shown in Equations (3–6), we obtain Equation (7). Hence, each specific term ax that reflects the contribution of each individual crop management practice to crop yield can be calculated as follows: =
(8)
Equation (7) attempts to capture the effect of various management practices on crop yield. Its applicability depends obviously upon the availability of sufficient observations related to each individual management practice. In fact, it could be used whether data time-series describing the effect of one or more individual managements on crop yield are available or not; as it is illustrated below in our case studies. 2.2. Data Three different crops widely cultivated in three Mediterranean countries were selected for our analyses: maize in Egypt, wheat in Greece and potato in Morocco. National level crop yield observations between 1961 and 2006 [30]; and Climate Research Unit (CRU—version TS3) gridded monthly climate data at 0.5° for the same period [31] were used. For each country, our use of the climatic data was restricted to the cultivated areas as documented in [32,33]. To ideally extract the climate-induced crop yield trend using our approach, it is preferable to use observations of yearly variation of each crop management practice relatively to each crop and each country. To our best knowledge, however, such national-level observations do not exist yet, neither for a period as long as the period of our study (46 years), nor for a shorter period. Alternatively, we used the best available observations on crop management that are relevant to our study. These management observations, shown in Figure 2a,b along with crop yield observations (Figure 2c), include total fertilizer consumption (TFC) data as provided by the international fertilizer association [34], and national-scale estimates of total irrigated agricultural lands (TIL) given in [35]. Though not ideal to reach the best possible accuracy when splitting between climate and management contributions to crop
Atmosphere 2013, 4
371
yield trends, TFC and TIL data represent an acceptable alternative, considering that the rate of annual changes in these two variables at the national level reflects the annual changes in crop production. A consideration that is strongly supported by the high and statistically significant (95% confidence limit) correlation between annual changes in crop yield and each of the two variables (Figure 3a–c). Interestingly, furthermore, a literature review shows that some other authors have also used national-level fertilizer applications to analyse national-level crop yield evolution (e.g., [36]—for cereal crops in Poland; [37]—for various crops in Brazil). Figure 2. Temporal evolution of total fertilizer consumption (a), irrigated cropland (b), and crop yield (c); between 1961 and 2006 in Egypt, Greece and Morocco. Crop yield refers to maize and wheat crops (primary y-axis) in Egypt and Greece, respectively; and to potato crop in Morocco (secondary y-axis).
Atmosphere 2013, 4
372
Figure 3. Variation of crop yield changes (y − yo) as a function of total fertilizers consumption changes (F/Fo; filled circles—primary x-axis (bottom)), and as a function of irrigation changes (I/Io, open squares—secondary x-axis (top)), for maize-Egypt (a), wheat-Greece (b) and potato-Morocco (c). The coefficient of determination (R2) of the relationships between crop yield and each of the two variables is also shown. All the relationships are statistically significant at the 95% level (p < 0.05). The subscript “o” denotes initial values (i.e., values at year 1961); while for the sake of a better visualization, y − yo = f(F/Fo) and y − yo = f(I/Io) are illustrated instead of y = f(F) and y = f(I), respectively. The relationships y − yo = f(F/Fo) and y = f(F), and y − yo = f(I/Io) and y = f(I) are indeed strictly similar.
It is worth noting that, like almost everywhere in the world, irrigation spread-out continuously throughout the last five decades in the three countries. Fertilizer consumption increased steadily until the mid-1980s and decreased thereafter in Greece, while it slightly decreased in Egypt and Morocco between the mid-1980s and the mid-1990s before it increases again (Figure 2a,b). Overall, crop yield trajectory has evolved in a similar way to TFC in the three countries (Figure 2a,c). 3. Results 3.1. Climate Our climate trend analyses refer to the periods of May–September, October–June and August–March for maize, wheat and potato crops, respectively. These periods correspond roughly to the growing season of the selected crops in each of the three selected countries [38]. Annual variations of temperature and precipitation for the period of the study are shown in Figure 4a–d. In the three countries, temperature decreased from the early 1960s until the mid-1970s, but increased thereafter. The overall temperature increase (1961 through 2006) reached 0.64 °C, 0.35 °C and 1.15 °C in Egypt, Greece and Morocco, respectively (Figure 4a,b and Table 1). Since the mid-1970s, however, its increase was more substantial, reaching 1.2 °C (0.4 °C/decade), 1.4 °C (0.47 °C/decade) and 1.75 °C (0.58 °C/decade) in Egypt, Greece and Morocco, respectively. Such temperature changes since the mid-1970s are much larger than the observed 0.6 °C global temperature increase since 1950. They are even larger than the IPCC’s projected 0.2 °C/decade increase for the next two to three decades [39]. Precipitation decreased in Greece (5%) and Morocco (30%), but increased in Egypt (9%). Several modelling studies have suggested that combined changes in temperature and
Atmosphere 2013, 4
373
precipitations that are comparable to the observed changes in the three studied countries could have important effects on yield of various crop species [11,40]. Figure 4. Annual variation of average temperature (a) and its anomalies (b) along with annual variation of total precipitation (c) and its anomalies (d), during the growing season between 1961 and 2006 in Egypt, Greece and Morocco. Temperature anomalies were calculated as the difference between current and average values, while precipitation anomalies were calculated as the ratio between current and average values. Precipitation anomalies are shown on the primary y-axis for Greece and Morocco, and on the secondary y-axis for Egypt.
Table 1. Temperature and precipitation trends in the selected three countries, for the 1961–2006 and the 1971–2006 periods. T, P and t refer to temperature (°C), precipitation (cm) and time (year), respectively. p1 and p2 are the two-tailed t-test values for the 1961–2006 and the 1971–2006 periods, respectively. The relationship is statistically significant at the 95% confidence limit when p is lower than 0.05. While our study encompasses the period from 1961–2006 period, statistical analyses are given here as additional information for the 1971–2006 period also, where the trend in temperature change was more evident (see also Figure 4).
Egypt Greece Morocco
1961–2006
1971–2006
p1/p2
T = 0.014t − 6.56 P = 0.017t − 24.26 T = 0.0075t + 0.55 P = −0.0684t + 194.13 T = 0.025t − 31.33 P = −0.233t + 496.7
T = 0.026t − 30.28 P = 0.024t − 37.86 T = 0.03t − 44.36 P = −0.011t + 79.5 T = 0.038t − 58.31 P = −0.169t + 369.43
9e4/~0 0.62/0.64 0.17/~0 0.51/0.94 0/0 0.025/0.22
Atmosphere 2013, 4
374
3.2. Crop Yield To further expand our argument on the limitation of FDA to isolate the effect of climate (and climate change) on crop yield (see Section 2.1), we compared year to year variations of crop yield and TFC (Figure 5a–c). Although very brief, this comparison suggests an interdependence between the variations of the two variables though not always evident. Such an interdependence is sometimes obvious, when both variables vary in the same direction at the same time (e.g., Figure 5a around year 1970), and sometimes lagged when a variation in crop yield corresponds to a similar variation of TFC during the previous year (e.g., Figure 5b around year 1994). That “time-lag” in variation could be at least partly explained by the climatic conditions that prevail during the year of fertilizer applications. During dry years for example, a portion of applied fertilizers remains in the soil after crop harvest and get used by crops during the following year, leading to an abnormal enhancement of yield. In some years, however, crop yield and TFC vary in opposite directions (e.g., Figure 5b,c around year 1967), likely reflecting stronger crop yield response to factors other than fertilization (e.g., extreme climate conditions, plant diseases, etc.). Figure 5. Year to year changes in crop yield (∆y; solid line) and in total fertilizer consumption (∆F; dotted line). For a better visualisation, ∆y and ∆F are expressed as the difference and the ratio between values of two consecutive years, respectively. Panels (a), (b) and (c) refer to maize-Egypt, wheat-Greece and potato-Morocco, respectively.
In our case studies, as illustrated in Figure 3a–c, crop yield changes as a function of fertilizer changes is best explained by a third order polynomial expression: =
+
+
+ δ + ε(t)
(9)
Atmosphere 2013, 4
375
where α, β, γ and δ are the best fit parameters for each location and crop (Table 2). ε(t) is the residual error. We remind that such a relationship (or any other statistical relationship) must be obtained for a period of time (continuous or discontinuous) where, in statistical terms, climate does not change significantly (see Section 2.1). Moreover, it is worthwhile mentioning that it is not necessary to always use a third order polynomial expression to express the relationship between crop yield and any crop management practice. For instance, a linear relationship (first order polynomial expression) might be enough if it gives satisfactory results. Table 2. Statistical relationships between crop yield and crop managements (fertilizer and Irrigation applications) for the three case studies. y, F and I refer to crop yield, total fertilizer consumption and irrigation, respectively (see text for details). y expresses the crop yield difference between any given year and the initial year (i.e., year 1961), while F and I is the ratio of fertilizer consumption and Irrigation, respectively, between any given year and the initial year. R is the correlation coefficient and p is the two-tailed t-test value. The relationship is statistically significant at the 95% confidence limit when p is lower than 0.05. y = f(F,I) 3
Maize—Egypt Wheat—Greece
2
y = −0.0304F + 0.4003F − 0.5656F + 0.9769 y = −0.1027F3 + 0.6308F2 − 0.6045F + 0.1372 y = (−0.0166F3 + 0.3029F2 − 0.9418F) + (28.3442I3 − 100.1485I2 +120.412I) − 48.1972
Potato—Morocco
R2
p
0.90 0.70