Euro - Asian Journal of sustainable energy development policy
A methodology to insert end-users behaviour in energy efficiency scenario modelling13 by Prof. Dimitrios MAVRAKIS Director of Energy Policy and Development Centre (KEPA) of National and Kapodistrian University of Athens (NKUA) Dr. Popi KONIDARI1 Head of Climate Change Policy Unit of KEPA of NKUA 1
Contact details of corresponding author Tel: + 210 7275830 Fax: +210 7275828 e-mail:
[email protected]
Address: KEPA Building, Panepistimiopolis, 157 84, Athens, Greece
Abstract Deviations from the fulfillment of Energy Efficiency (EE) targets are attributed mainly to barriers created by the behavioral patterns of end-users. The methodology, based on the Analytical Hierarchy Process (AHP), concerns the calculation and interlinkage of the total impact factors of behavioral barriers demonstrated by end-users with the input drivers in the EE modeling. Two sets of behavioral barriers for buildings and transport are provided. Comments, advantages and disadvantages are discussed in the conclusions.
Keywords Energy efficiency, behavioral barriers, impact factor, energy modelling. negatively the achievement of such targets (McCollum L. David et al., 2016; European Commission, 2015a, 2015b; European Environmental Agency, 2013). As a consequence, EE policies and measures do not deliver the expected benefits (such as energy savings, reductions in Greenhouse Gases (GHG), employment, poverty alleviation etc) (UNEP, 2014; IEA, 2014).
1. Introduction Energy Efficiency (EE) consists one of the main pillars of efforts to mitigate climate change (IEA, 2014; Energy Efficiency Financial Institutions Group, 2015). Τhere is plethora of policy instruments that support the penetration of EE technologies and practices. Different types of barriers, particularly those linked with end-users behaviour, affect 13
The methodology was developed and implemented in the frame of the Horizon 2020 Research and Innovation project HERON (Grant Agreement No. 649690).
59
Euro - Asian Journal of sustainable energy development policy
features of the ‘real world’ relates to human behaviour. Barriers, related to end-users’ behaviour, need to be incorporated in forward looking EE modelling after being identified and analysed (McCollum L. David et al., 2016; EC, 2015a, 2015c; EEA, 2013).
According to the Energy Efficiency Communication of July 2014, the EU is expected to miss the 20% energy savings target of year 2020 by 1% - 2% (European Commission, 2015a; 2015b; 2014; European Commission – Directorate - General for Energy, 2012). In 2014, three Member States (Estonia, Malta and Sweden) had not achieved sufficient savings in primary energy consumption (EEA, 2016a). Due to this fact, Malta’s 2020 EE target, expressed in final energy consumption, was increased in 2015 from 0.493Mtoe to 0.547Mtoe, becoming less ambitious since this amount is increased instead of being reduced even more (European Commission, 2015a). The Dutch Government lowered its initial reduction target from 30% to 20% (Vringer K. et al., 2016). Three other EU Member States (Germany, Lithuania and Slovakia) had not succeeded in their efforts of reducing sufficiently their final energy consumption so as to remain below their linear trajectory (EEA, 2016b).
The aforementioned demands are based on the following arguments (McCollum L. David et al., 2016): i)
ii)
Models lacking behavioural realism are restricted in evaluating energy efficiency policies and other influences on end-user demand; Improving the behavioural realism of models consequently affects policy-relevant model analysis of EE as part of the climate change mitigation efforts.
However, current modelling of behavioural features in energy-economy and integrated assessment models is relatively limited (McCollum L. David et al., 2016). Models and particularly Integrated Assessment Models (IAMs) represent the behaviour of consumers or energy end-users through economic relationships: energy demand as a function of price, technology investments to minimize levelized costs, etc (McCollum L. David et al., 2016).
Currently, efforts are focused in overcoming existing barriers and increasing the sophistication of energy and economic modelling (European Commission (EC), 2015b; 2014). Key insights in the outcomes of such efforts can guide the effective design and implementation of end-user-focused strategies and public policy interventions to improve the level of EE interventions (by adopting technologies or practices) (Frederiks R. et al., 2015; UNEP, 2014).
End-user behaviour is complex and rarely follows traditional economic theories of decision-making (McCollum L. David et al., 2016; Frederiks R. et al., 2015; Knoblocha F., Mercure J.-F., 2016). End-users patterns of energy consumption are influenced by social-cultural-educational (status quo, social interactions etc), economic (risks of investment, financial incentives) and institutional factors (split incentives, hassle factor etc) that are characterized as barriers (Vringer K. et al., 2016; Frederiks R. et al., 2015; UNEP, 2014).
Forward-looking models are used for medium-tolong-term scenario analyses, aiming to support relevant policy options; some of these models are designed to consider both technological, economical and socio-behavioral elements in developing the scenarios (McCollum L. David et al., 2016; Knoblocha F., Mercure J.-F., 2016). Bridging the gap between these elements has historically been presented as a challenge (McCollum L. David et al., 2016). Demands of improving the design of models so as to become more ‘realistic’ by incorporating features observed in the real world are increasing (McCollum L. David et al., 2016). One group of such
Consequently, a methodology inserting endusers’ behavior into forward looking EE modeling adds value in efforts to have more reliable EE modeling.
60
Euro - Asian Journal of sustainable energy development policy
each barrier on the set of the assumed targets, in EE modeling. Mathematical expressions using the calculated impact factor of barriers provide numerical inputs to energy modelling reflecting the deviation from the set EE target due to end-users’ behavior. Once the procedure is completed, the policy maker can modify accordingly the available inputs so as to reduce the calculated deviation.
2. Methodology 2.1. Concept Developed scenarios for EE include as key drivers (or assumptions) the penetration of EE technologies (Building shell improvement, efficient heating and cooling, heat pumps, more efficient vehicles, etc.) and their supportive policy package (energy labelling, building standards, fuel taxes etc) (ΙΕΑ, 2013; European Communities, 2006). The assumed shares of such technologies combined with the appropriate policy instruments form the synthesis of various scenarios developed with the use of energy models such as LEAP, MARKAL, TIMES, POLES etc (Bhattacharyya C. S. and Timilsina R. G., 2010).
2.2. Rationale for the AHP choice The selection of the AHP allows pair-wise comparisons among the objects that need to be assessed (either criteria/sub-criteria, alternatives, options or barriers). Furthermore, it has the following advantages: • AHP is justified mathematically (specifically, it is mathematical theory of value, reason and judgment, based on ratio scales) (Eakin H., Bojorquez-Tapia L.A., 2008; Kablan M.M., 2004).
The EE target set for a country depends on the aforementioned combination and the consumers’ habits and behavior (IEA, 2013). Each national economic sector has its own EE targets or assigned contribution to the national EE target. Simultaneously, each sector has its own set of barriers towards EE issues (Hochman G. and Timilsina G. R., 2017; Trianni A. et al., 2016; Johnson H. and Anderson K., 2016; HERON, 2015a; HERON, 2015b). Depending on the rationality of these scenarios, assumptions are adopted for overcoming identified existing barriers. Each identified barrier, due to end-users’ behavior towards EE issues, has a different impact in limiting the efforts of achieving any type of energy efficiency target. Quantification of the qualitative information of identified barriers allows the numerical expression of the respective impact factors on the inputs for the forward-looking EE modelling.
• AHP presents better the problem. Its main advantage is the decomposition of the problem into elements (Ishizaka A., Labib A., 2011; Berrittella et al., 2008). Its hierarchical structure of criteria allows users to focus better on specific criteria and sub-criteria when determining the respective weight coefficients through pairwise comparisons (Ishizaka A., Labib A., 2011). • AHP allows pairwise comparisons. Psychologists argue that it is easier and more accurate to express one’s opinion only on two alternatives14 than simultaneously on all (Ishizaka A., Lablb A., 2011). Additionally, the usage of pairwise comparisons does not require the explicit definition of a measurement scale for each attribute (Bozdura F.T. et al., 2007).
The proposed methodology transforms qualitative research outcomes about barriers linked to end-users’ behavior, into quantitative ones. With the use of the Analytical Hierarchy Process (AHP), comparative analysis is conducted among these barriers due to end users’ behavior towards technologies, measures and policy instruments for achieving EE targets. This process reveals and quantifies the negative impact of 14
• AHP offers guidelines in defining the weight coefficients and has a consistency test. “The AHP approach employs a consistency test that can screen out inconsistent judgments, which
Since two alternatives form the pairwise comparisons of AHP
61
Euro - Asian Journal of sustainable energy development policy
makes the results reliable.” (Bongchul K. et al., 2017; Kablan M.M, 2004).
The method reproduces what seems to be a natural method of human mind in perceptions and judgements (Madeira G. J. et al., 2016). It does not require explicit quantification of criteria (Zietsman D., Vanderschuren M., 2014). The users may directly input judgment data without getting into the mathematical background (Duran O., Aguilo J., 2008).
• AHP is suitable for incorporating the preferences of relevant decision makers/stakeholders regarding the importance of the criteria/sub-criteria (Bongchul K. et al., 2017; Fikret K.T., et al., 2016; Ananda J., Herath G., 2009). Due to this advantage, it has been widely used in energy management, business, maintenance engineering, and medical & health care, strategic planning etc (Da A. et al., 2017; Madeira G. J. et al., 2016). Reservations, though, are expressed that the method may be impractical for a survey with a large sample size of as ‘cold-called15’ respondents, because they may have a great tendency to provide arbitrary answers, resulting in a very high degree of inconsistency (Wong K.W.J., Li H., 2008). But there are scholars that support that it can handle uncertain, imprecise and subjective data (Srdjevic B., Medeiros Y.D.P., 2008; Petkov D. et al., 2007).
• AHP has been used only for the determination of the importance of criteria/factors (alone or in combination with other multi-criteria decision analysis methods) (Kuruoglu E. et al., 2015; Kumar S. et al., 2015; Andrejiova M. et al., 2013). 2.3. Outline and steps The methodology, based on the AHP, develops a road map consisted of six steps. It starts with “Mapping, categorization and merging behavioral barriers” (step 1), proceeds with the “Development of the AHP tree and matrices” (step 2), the “Calculation of weight coefficients” (step 3), the “Definition and calculation of the Impact Factors of barriers” (step 4), the “Linkage of Impact factors of barriers with technologies and policies (step 5) and concludes with the “Incorporation of the Total Impact Factors in the forward-looking EE modelling” (step 6).
• AHP allows qualitative and quantitative approaches for solving a problem (Madeira G. J. et al., 2016; Kilincci O., Onal S.A., 2011; Wong J.K.W., Li H., 2008; Duran O., Aguilo J., 2008). The user can deal in this way the inherent subjectivity of the selection process. Pair-wise comparisons are quantified by using a scale (Stefanovic G. et al., 2016).
Step 1: Mapping, categorization and merging of behavioral barriers
• AHP has high popularity. Comparative analysis of Multi Criteria Decision Analysis (MCDA) approaches has indicated AHP to be the most popular compared to other methods due to its simplicity, easiness to use and great flexibility (Nasirov S. et al., 2016; Kilincci O., Onal S.A., 2011; Ho W. et al., 2010; Srdjevic B., Medeiros Y.D.P., 2008; Duran O., Aguilo J., 2008; Babic Z., Plazibat N., 1998).
The mapping of barriers linked with end-users’ behavior towards EE issues is defined by the requirements of the EE scenario modelling (sector and EE technologies). Barriers are sought through: i) Bibliographic research (National Action Plans, Strategies, National Communications, reports from target groups (associations of household owners, chambers, projects etc), published papers); ii) interviews or questionnaire survey (Hochman G. and
15
A telephone call or visit made to someone who is not known or not expecting contact.
62
Euro - Asian Journal of sustainable energy development policy
Timilsina R. G., 2017; Chiaroni D. et al., 2016; HERON, 2015a; 2015b).
consumption, primary or final energy savings, or energy intensity16.
The identified barriers, with the same basic characteristics, are categorized into main groups and sub-groups. Each main group is divided into subgroups if there is a large number of identified barriers. Based on literature research three main groups are foreseen for barriers linked with endusers’ behavior: “Social-Cultural-Educational” (SC-E), “Economic” (EC) and “Institutional” (IN) (Nasirov S. et al., 2016; UNEP, 2014; IEA, 2014, 2013; EEA, 2013; Energy Communities, 2006). The first group is divided into three sub-groups “Social (S)”, “Cultural (C)” and “Educational (E)”.
The next level is the first level of the AHP tree and is structured with the three main groups of barriers: i) S-C-E); ii) EC and iii) IN. The second level consists of the three sub-groups S, C and E. The other two groups do not have sub-groups (Figure 1). Under each group and sub-group, the identified and merged barriers are classified forming the third level. The two sets of barriers of step 1 with the goal are presented in Tables 1 and 2. The comparison of these two sets shows that: i) The number of classified barriers is different for one sub-group (E) and two groups (EC, IN); ii) there are common barriers between the two sets.
Barriers with the same content; behavior or same manner in being handled, are merged into one barrier with a common title. This action is necessary so that the final set of barriers is complete, non-redundant, minimalistic, non-overlapping, mutually independent, decomposable (Zietsman D., Vanderschuren M., 2014; Makropoulos C.K. and Butler D., 2006).
This structure – common for both sectors - is used to form the AHP matrices for the comparative analysis of the next steps. Columns and rows of these matrices refer to the compared groups or sub-groups of barriers or barriers themselves (depending on the level forming the matrix). The AHP matrices are filled in their diagonal with number “1” due to the pairwise comparison of one group or sub-group or barrier with itself. The preferable maximum number for each AHP matrix is 8x8.
Step 1 based on the aforementioned sources and the findings of the HERON project led to two sets of behavioral barriers with universal use, responding to the needs of forward looking EE modelling for the sectors of buildings and transport (HERON, 2015a; 2015b; 2016). These sets are presented in the next step.
Step 3: Calculation of weight coefficients Step 3.1: First level of pair-wise comparisons The three groups of barriers (S-C-E; EC; IN) are compared using the AHP matrix and scale (Tables 3 and 4). Each cell of the AHP matrix is filled after:
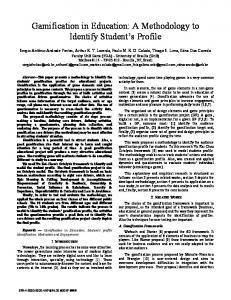
Step 2: Development of the AHP tree and matrices The mapped and classified barriers into groups and sub-groups of step 1 form the AHP tree. Apart from the structure of groups and sub-groups, the goal (zero level of AHP tree) needs to be determined also. Goal reflects the aim of the tree which is the “limiting efforts for achieving the EE target” due to the impact of each barrier as part of this tree (Figure 1). This EE target can be based on primary or final energy
16
https://ec.europa.eu/energy/en/topics/energyefficiency/energy-efficiency-directive
63
i)
comparing the group of each row with the respective group of the column;
ii)
assigning the appropriate - according to judgement - intensity from Table 4;
iii)
the assignment of the intensity (judgement) is based on the following conditions:
Euro - Asian Journal of sustainable energy development policy
a. the first group is more important compared to the second one if the number of the identified barriers under the first group of barriers is higher compared to those under the second one;
experts on EE issues clearly quote this importance. iv)
b. the first group is more important compared to the second one depending on the level of difficulty with which it can be confronted (the more difficult, the more important); c. the first group is more important compared to the second one if it is divided in more different sub-groups; and
Depending on how overall important is the first group, compared to the second; the intensity is assigned by the user. The selected intensity is quoted in the respective cell. If during any comparison, the second group is more important than the first one, then the quoted intensity is 1/intensity.
Table 5 shows a filled AHP matrix where Aij is the content of the cell (i,j); i refers to the row and j to the column. The element of the AHP matrix, A12, expresses how more important is the first group (S-C-E), in limiting the efforts of achieving the EE target compared to the second group of barriers (EC).
d. the first group is more important compared to the second one if the available preferences of
Social
bs1 bsn
Social - Cultural - Educational
Cultural
bc1 bck
Educational
be1 bem
Limiting efforts for achieving the EE target
Economic
bEC1 …. bECj bIN1
Institutional …. bINa
Fig 1: The AHP tree of the barriers.
64
Euro - Asian Journal of sustainable energy development policy
Table 1. Set of behavioural barriers for the building sector. Goal
Group
Sub-group
Barriers (b) bs1: Social group interactions and status considerations
S
bs2: Socio-economic status of building users bs3: Strong dependency on the neighbors in multi-family housing b4: Inertia bs5: Commitment and motivation of public social support
S-C-E C
bs6: Rebound effect bc1: Lack of interest/low priority/Undervaluing energy efficiency bc2: Customs, habits and relevant behavioural aspects
Limiting efforts for achieving the EE target
E
bc3: Bounded rationality/Visibility of energy efficiency bc4: Missing credibility/mistrust of technologies and contractors bE1: Lack of trained and skilled professionals/ trusted information, knowledge and experience bE2: Lack of awareness/knowledge on savings potential/information gap on technologies bEC1: Lack of any type of financial support (lack of financial incentive (Public and Private sector)/ Lack of funds or access to finance) bEC2: High capital costs/Financial risk/ Uncertainty on investment/ High cost of innovative technologies for end-users
EC
bEC3: Payback expectations/investment horizons bEC4: Relatively cheap energy and fuel prices/ misleading Tariff system not reflecting correct prices for energy use/EE bEC5: Unexpected costs (Hidden costs/ Costs vary regionally (Fragmented ability)) bEC6: Financial crisis/Economic stagnation bEC7: Embryonic markets bIN1: Split Incentive bIN2: Legislation issues (Lack of relevant legislation/Lack of regulatory provision /Change of legislation for local/regional administrative division/ Complex/inadequate regulatory procedures) bIN3: Building stock characteristics/aging stock/ Historical preservation bIN4: Poor compliance with efficiency standards or construction standards/ Technical problems/ Performance gap/mismatch bIN5: Lack of data/information-diversion of management
IN bIN6: Barrier to behavior change due to problematic Implementation Network (IN)/governance framework (Inadequate IN/governance framework /Inadequate implementation of policy measures / poor Policy coordination across different levels/cooperation of municipalities) bIN7: Disruption/Hassie factor bIN8: Security of fuel supply
65
Euro - Asian Journal of sustainable energy development policy
Table 2. Set of behavioural barriers for the transport sector. Goal
Group
Sub-group
Barrier bs1: Low satisfaction with public transport/lack of trust bs2: Concerns of vehicle reliability/Hesitation to trust new technologies bs3: Heterogeneity of consumers
S
bs4: Suburbanisation trends/Low density bs5: Mobility problems (Vulnerability of pedestrians / Lack of adequate space for walking/ Cruising traffic/ Parking problems) bs6: Inertia bc1: Car as a symbol status and group influence
C
bc2: Habit and social norm of driving, car ownership and use bc3: Cycling is marginalized
S-C-E
bc4: Attitude (Attitude-action gap /Bounded rationality/Buyer attitude) bE1: Lack of knowledge/information (on green transport/ULEVs/EVs - fuel economy)
Limiting efforts for achieving the EE target
E
bE2: Low/Limited awareness (of impact of EE in transport /towards ecodriving/benefits-environmental impacts) bE3: Confusion about car and fuel costs (conventional vs ULEVs/Evs) – Negative perception bE4: Lack of certified instructors/examiners/technicians/professionals for ecodriving /integrated transport/mobility/ ULEVs/Evs bEC1: Lack of finance/Limited financial incentives for new vehicles/ULEVs/public transport/ - Inefficient or absent fiscal measures for supporting EE
EC
bEC2: Limited infrastructure investment (road/train/cycling) – for public transport bEC3: Low purchasing power of citizens/Financial crisis bEC4: High cost/Low cost competitiveness of electric vehicles - High cost of batteries for electric vehicles bEC5: Payback period of fuel efficient vehicles bEC6: Negative role of Investment schemes/employee benefits encourage transport EE bIN1: Administrative fragmentation and lack of integrated governance bIN2: Transport EE on the Government Agenda/priorities
IN
bIN3: Barriers to behavior change due to problems with infrastructure/public transport services (Inefficient urban/public transport infrastructure and planning/ Undeveloped cycling/walking infrastructure/ Lack of support for rail transportation/Limited rail infrastructure/ Undeveloped infrastructure for recharging of EV) bIN4: Lack or limited policies to support behavior change on specific transport issues (Lack of national strategy for bike and pedestrian mobility/ Limited policy on freight efficiency/city logistics bIN5: Limited/complex funding in urban public transport bIN6: Barriers to behavior change due to no policy support to technological issues/research needs (Immature status of developing technologies for EVs/ULEVs - Range of distance travelled between charges for EVs) bIN7: Contradicting policy goals (particularly road/car-oriented planning)
66
Euro - Asian Journal of sustainable energy development policy
Table 3. AHP matrix for pair-wise comparisons.
Group of barriers
S-C-E
EC
IN
S-C-E
1
A12
A13
EC
A21 = 1/A12
1
A23
IN
A31 = 1/A13
A32 = 1/A23
1
Table 4. Relative importance between comparisons of AHP method.
Intensity
Definition
Explanation
1
Equal importance
Two barriers contribute equally to the goal
3
Moderate importance
Experience and judgement slightly favours the one over the other
5
Essential or strong importance
Experience and judgement strongly favours the one over the other
7
Demonstrated importance
Dominance of the demonstrated in practice
9
Extreme importance
Evidence favouring the one over the other of highest possible order of affirmation
2,4,6,8
Intermediate values
When compromise is needed
Table 5. Calculations in AHP matrix for the respective Impact factors. Group of barriers
S-C-E
EC
IN
W
S-C-E
1
A12
A13
WS-C-E = (1/S1 + A12/S2 + A13/S3)/3
EC
A21 = 1/A12
1
A23
WEC = (A21/S1 + 1/S2 + A23/S3)/3
IN
A31 = 1/A13
A32 = 1/A23
1
WIN = (A31/S1 + A32/S2 +1/S3)/3
Sum
S1 = 1+ A21+ A31
S2 = A12 +1+ A32
S3 = A13 + A23+1
coefficients are defined as “Impact factors (I)” for the groups of barriers. The procedure is the same for all AHP matrices, differences are due to the different rank of the matrix (see Table 5):
Step 3.2: Calculation of weight coefficients for the first level of the AHP tree The necessary calculations of the AHP method are conducted for the determination of the weight coefficients (W) for each group of barriers (first level of AHP tree). The weight coefficients of this level express the contribution of the respective group to the goal. This means in the limitation of efforts for achieving the EE target. Due to this contribution, the calculated weight
a. Sum of each column (add three numbers in this specific case-level); denoted as Si where i refers to the number of the column;
67
Euro - Asian Journal of sustainable energy development policy
b. Divide each number of the first row with the respective sum of the column it belongs to (A11/sum of column 1 = A11/S1, A12/S2, A13/S3 etc);
2017; Da A. et al., 2014; Ishizaka A., Labib A., 2011; Konidari P., Mavrakis D., 2007; Berritella M. et al., 2007). A matrix is consistent (outcomes reliable) if CR* < 0.10, otherwise, the matrix is not consistent and its CR* value should be adjusted. This is done by reassigning intensities and checking the importance of one object (here for the group of barriers) over the other.
c. Sum up the “n” outcomes of step b (here the three outcomes of step b); d. Divide them with n (since there were n outcomes) (n is the number of columns and rows of this AHP matrix) (here divide them with 3 (three outcomes for step c));
The calculation procedure using the respective AHP matrix is (here Table 5 turns into Table 7):
e. The outcome is weight coefficient for group 1 of barriers (located at row 1, column n+1 or a separate column) (sub-groups or barriers in the next levels);
a. Multiply the first cell of the first row with the first weight coefficient (final matrix of step 3.2), the second cell of the first row with the second one, the third cell of the first row with the third weight coefficient) etc;
f. Repeat for the second row the steps b, c, d, e; g. Repeat for the next rows the steps b, c, d, e;
b. Sum the products and divide by the first weight coefficient. This will be A1;
h. Check if each weight coefficient fulfills the condition 0 < W < 1;
c. Multiply the first cell of the second row with the first weight coefficient etc;
i. Check if all together, the weight coefficients, sum up 1 (here the three calculated ones).
d. Sum up the products and divide with the second weight coefficient. This will be A2.
Step 3.3: Calculation of the consistency test Values derived from step 3.2 are tested – before being used - for their consistency following the Saaty approach which requires the calculation of the random ratio of consistency (CR*) of the respective AHP matrix.
e. Repeat the steps a, b for the third row and any other remaining ones respectively. f. Add outcomes A1, A2, …… An and divide the sum with “n”. Here, add outcomes A1, A2 and A3 and divide the sum with number three. This leads to λ.
First, the consistency index (CI) is calculated as 𝐶𝐼 =
𝜆𝑚𝑎𝑥 −𝑛 𝑛−1
g. Calculate CI = (λ – n)/(n-1) for the specific AHP matrix.
(1)
where: λmax is the maximum eigenvalue of the matrix and n is the rank value of the matrix.
h. Calculate CR* = CI/CR (CR value from Table 6). Here CR* = CI/0.58 (matrix 3x3) (Table 7).
Then, the random ratio of consistency (CR*) is calculated as CR*= CI/CR
i. If CR* fulfils the condition 0