visual system of the horseshoe crab, Limulus. We have developed a microcomputer-based instru- ment to provide a versatile, reasonably priced, portable,.
Behavior Research Methods & Instrumentation 1978, Vol. 10 (4),539-545
Experimental Applications A microcomputer-based visual stimulator NORMAN MILKMAN, ROBERT SHAPLEY, and GARY SCHICK Rockefeller University, New York, New York 10021 A microcomputer-based instrument is described that provides visual stimuli for a CRT display and collects and processes response data. The system produces a variety of visual patterns to facilitate the study of the properties of visual neurons of several different animals. The visual patterns include drifting sinusoidal or bar gratings, contrast reversal gratings, and diffuse light. By means of a keypad, the experimenter can select the visual pattern and its parameters, such as depth of modulation, spatial frequency, initial spatial phase, temporal frequency, and rotation angle. We are attempting to analyze the functional connections in the visual pathways of several different animals through the study of responses of visual neurons to a variety of visual patterns. Receptive-field mechanisms of cat retinal ganglion cells are being studied by means of linear or nonlinear responses to particular visual patterns. Retinas of frogs and eels are studied in a similar way. Also under investigation are the spatialtemporal characteristics of linear interactions in the visual system of the horseshoe crab, Limulus. We have developed a microcomputer-based instrument to provide a versatile, reasonably priced, portable, electronic visual stimulator that also serves as a data acquisition and processing system. The visual stimulator provides a wide variety of visual stimulus patterns for a cathode-ray tube (CRT) display. The same instrument acquires response data in the form of shaped or unshaped discrete nerve impulses, or in the form of analog voltages (slow potentials). The microcomputer performs signal averaging to obtain a histogram of the evoked response. When the data are nerve impulses, the Fourier coefficients of the fundamental and second harmonic responses are calculated in real-time. The histogram is available for presentation on an x-y oscilloscope, or x-y plotter, or chart recorder. The Fourier coefficients may be examined on a light-emitting diode (LED) display that consists of two hexadecimal digits. The purpose of the visual stimulator is to provide a diverse set of visual patterns. This set of patterns is rich enough in complexity to enable us to discover the spatial and temporal properties of visual neurons, and yet is defined precisely enough to enable quantitative measurements of neuronal sensitivity. The set of spatial patterns includes localized bars, diffuse light, and spatial gratings. The bars enable us to measure sensitivity We are grateful to Bill Kocsis and the electronics shop of the Rockefeller University for their help in building this instrument. The development was supported in part by Research Grants GMOl789, EYI472, and EY188.
to localized visual stimulation. Stimulation with diffuse light tests the degree of neural antagonism between spatial mechanisms. Stimulation with grating patterns allows the researcher to test two properties: resolving power and linearity of spatial summation. Using periodic spatial gratings to test the spatial resolution of a neural mechanism is analogous to using such gratings to measure the resolving power of a lens. To test resolving power, either drifting gratings or contrast-reversal gratings are used. The spatial-temporal stimulus for the drifting grating can be written as L(x,t) = Lo + L 1 sin (kx - wt), where Lo is mean luminance, L 1 is amplitude, and L 1 /Lo is the contrast of the drifting grating, k is spatial frequency, x is the position variable, w is temporal frequency, and t is the time variable. By varying contrast and spatial frequency to achieve a constant neural output, we measure the spatial-frequency sensitivity of the visual neural mechanisms under study. In order to study spatial linearity, contrast-reversal gratings prove quite useful (Enroth-Cugell & Robson, 1966; Hochstein & Shapley, 1976). The luminance profile in such a pattern can be expressed as L(x,t) = Lo + L1 sin (kx + t/J) . f(t), where the variable t/J is the spatial phase (or position) of the grating in the visual field and the modulation signal, f(t) , is usually sin (wt) or a square wave. It can be shown that if the neural mechanism that responds to the contrast reversal is linear in space and time, the neural response should be a sinusoidal function of t/J, the spatial phase (Hochstein & Shapley, 1976). In particular, there should be two zero crossings or null positions for the grating when (/) is varied between 0 and 2n. Since the bars and gratings are one-dimensional patterns, one must check for departures from radial symmetry in neural spatial mechanisms by varying the spatial orientation of the patterns. This is accomplished in our visual stimulator by means of a spatial rotator circuit. The rotator also enables us to test for direction selectivity, a particularly important case of spatial anisotropy.
539
540
MILKMAN, SHAPLEY, AND SCHICK
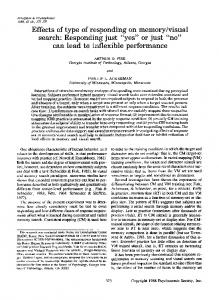
DESIGN STRATEGY The basic design strategy of the visual stimulator is to present a raster of lines on a CRT, and to synchronize them with a z-axis (intensity) modulation signal. This can be used to produce a standing or slowly drifting visual pattern on the screen of the CRT. In order to measure the temporal resolution of neurons, we were forced to use raster rates much higher than normal TV. To achieve adequate spatial resolution, one must produce z-axis pattern signals at rates approaching 150 kHz. These constraints forced us to use the relatively slow microcomputer in the visual stimulator as an executive. The microcomputer updates the spatial pattern and outputs the slow-modulation signals at the end of each sweep of the raster; and it counts nerve impulses or measures analog signals with an AID converter, sets the rotation angle, displays data at the end of the experimental run, and so on. The production of the raster and the z-axis waveform is performed by faster circuitry external to the microprocessor. The overall block diagram of the instrument is shown in Figure I. The visual stimulator consists of the raster generator, rotator, spatial and temporal modulators, multiplier, summer, and microcomputer. Pattern generation is controlled by the microcomputer. Response data are passed to the microcomputer via the data acquisition circuits. The data are processed OVERALL
and a histogram of the averaged signal is transmitted to the histogram display circuitry. Fourier coefficients are available for examination in the LED display as two hexadecimal digits. A keypad is used to enter or examine the parameters of the experiment. Among these are depth of modulation, initial spatial phase, spatial frequency, rotation angle, bar location, temporal frequency, and pattern selection. COMPONENTS Microcomputer The microcomputer consists of a Motorola 6800 microprocessor, an Intel2708 erasable programmable read-only memory (EPROM), random-access memory (RAM) as provided by two Motorola 6810 chips (128 by 8 bit words each), and seven Motorola 6820 peripheral interface adapters (PIAs). The microprocessor communicates with the other units over a unidirectional address and control bus and a bidirectional data bus (like a DEC PDP-ll). The program, with a 256-word sine list, and tables relating to temporal frequencies, reside in the EPROM. Histogram values, Fourier coefficients, and temporary constants are stored in the RAM. The peripheral interface adaptors provide the link between the microcomputer and the rest of the instrument. Each PIA has two sets of 8-bit registers BLOCK
DIAGRAM XV
CRO
- - - - - - - - - - - - --
STIMULUS MTTERN
VISUAL
SYSTEM IN:ER MlCR()(;(M'UTER
MOTalQA 6800 ~p INTEL 2708 EPROM
STlIlY DATA IN
2 MOTOROLA 6810 RAMS 7 MOTOROLA 6820 P1AS
Figure 1. Block diagram of instrument. The instrument consists of a visual stimulator, data acquisition circuits, and data processor. The visual stimulator comprises the raster generator, rotator, spatial and temporal modulators, multiplier, summer, and microcomputer. At the end of each frame, an end-ofsweep (EOS) signal is sent to the microcomputer, causing it to update temporal information. Signal averaging on the response data is performed by the microcomputer. A histogram of the results is sent to the histogram display circuits. Data and experimental parameters are available for examination via the LED display and keypad.
MICROCOMPUTER-BASED VISUAL STIMULATOR that are functionally identical. A set consists of a control register, a data-direction register, and a data register. Bits in the control register set up conditions for "handshake" logic operations with the outside world. The data-direction register contents determine whether the corresponding bit in the data register is to be used as input or output. The data register transfers 8-bit bytes to or from the outside world over a separate set of data lines. Raster Generator The raster generator creates a 512-line raster at a frame rate of 256/sec. It provides the x and y signals for an x-y oscilloscope display and, moreover, provides the master clock for the generation of spatial and temporal functions. Figure 2 shows the block diagram of the raster generator. The function generator (NE 566) provides both a triangle and square wave at a frequency of 512 x 256 cps with the time relationship shown in the figure. An amplified version of the triangle wave centered about 0 V is available to drive the y-axis of an oscilloscope or the raster rotator described below. The square-wave signal drives a nine-stage counter that in turn drives a digital-to-analog (D/ A) converter. As the count increases from 0 to 511, the output voltage changes linearly with increasing counts. The voltage produced by the D/A converter is given by V = K(N/512) - K/2, where K is a constant and N is the count in the counter. This will produce a sawtooth RASTER
NE'566+ RCA 3100 OP, AMP
waveform centered about 0 V as N runs the gamut of numbers Modulo 512. The sawtooth actually consists of a staircase made up of steps each lasting for 1/(256 X 512) sec, as shown in the figure. The same clock that drives the x counter is also used to clock the address register in the spatial modulator. Thus z spatial formation is synched to x position. When x and yare applied to a CRT display, a 512-line raster is created. Each increasing x count produces a new vertical line. Each line is traversed twice for a single x count (due to the triangle for y). The blanking signal produced by the blanking logic is a pulse one clock cycle wide that overlaps the last half of Interval 511 and the first half of Interval O. This signal is used to blank z during x retrace, to mark the start of the frame to the microcomputer, and to initialize spatial circuitry in the spatial modulator. Since the clock rate is 512 x 256 cps and 512 dock ticks are required to produce a frame, the duration of one frame is 1/256 sec. The x and y signals generated are available to drive a scope directly or can drive the rotator that is described next. Rotator Angular rotation about the center of the raster is provided by the rotator through 21T radians in discrete steps. The rotator block diagram is shown in Figure 3. To rotate any point PI to point P2 through an angle 0:, one must operate on x and y as shown by the formulas in Figure 3. The desired angle of clockwise rotation is GENERATOR
BLOCK
DIAGRAM
~ ,, ,' , I
I
I
I
I
I
I
FUNCTION
I
GENERATOR
t
I
o SAWTOOTH OUTPUT lHlOTATED
X
~ BLANKING SIGNAL
>--T'Es sec ,51Zt
TO Z
for
counts 0 thru
511
EOS TO SPATIAL FCT, GEN CL
541
EOS TO MICROCOMpuTER TO ADDR REG SA!lTIAL FCT, GEN
Figure 2. Raster generator. A 512·line raster at a 256-eps frame rate is produced by the raster generator. The NE 566 function generator provides both a triangle and a square wave at a nominal frequency of 256 x 512 cps by selecting an appropriate RC time constant. The square wave is used as a clock signal (el) for line generation along the raster and for clocking intensity (z) information.
542
MILKMAN, SHAPLEY, AND SCHICK ROTATOR
P,t1l;. ,Y.')
BlOCK DIAGRAM
•• ~(l2'\'
o
e: XI = RcOS 8,
Yl= Rsine
~=RCOS ~. - 01. 1,
Y =Rsinc8 -
z
C( )
_z=Rcosecosa.'t Rsinesina =)(,coso(+ 'tjsin
co.,,~e ~~== ~ from PIA lilnes ~ P '-------"
1I'I'Ofotedll. MPR
OAC
~.Rsinecvsa:-
-xcos«
0(
Rcosesin c(
=Y1COsa: -xtsin
'
>0---
0(
Rotated x
KlXCOSCIC+Yslnal)
-K
Rotate d y K(YCosce-XSlnol')
umototed
Figure 3. Rotator. Angular rotation is provided about the center of the raster by the rotator. The rotator is constructed in accordance with the formulas shown in the figure.
intensity. When a flashing raster is desired as described by Patterns 7 and 8 below,S V will be selected. The spatial frequency is defined as the number of cycles of intensity variation per raster. It is the number supplied by the microcomputer to the spatial-frequency PIA. Let us consider how Sl, the spatial sinusoid, is generated as a function of line position N of the raster. At the start of a frame corresponding to N = 0, the load logic transfers twice the number in the initial phase register to the address register. For each succeeding line number, the address register is incremented by the spatial frequency. This is accomplished by transferring the adder contents to the address register. The adder sums the spatial SPATIAL ANDTEMPORAL MODULATORS frequency to the address. Hence, for any count N Intensity (z) modulation is produced by the multi- corresponding to line N, the address A is given by plication of spatial and temporal modulation. As the A = [N(spatial frequency) + 2(initial phase)] Modulo 512, raster is being generated, the spatial modulator provides where N = 0, 1, 2, ... 510, 511. For each frame of the intensity modulation on a line-by-linebasis as a function raster, the number of times the address register of line position, while the temporal modulator provides overflows corresponds to the spatial frequency selected. intensity modulation on a frame-by-frame basis; that is, The address A is used to access a 512-word sine list that the temporal modulation over one frame is constant. contains the function 127 X sine (21TA/512), where o ~ A ~ 511. The list resides in an Intel 2704 EPROM containing 512 bytes that has been blasted to contain Spatial-Function Generator Figure 4 shows the block diagram of the spatial- one complete cycle of a sine wave. The digital output function generator. The spatial function is selected by from the list drives a 0/A converter that produces a the four-channel multiplexer, which has as its signal voltage SI proportional to the number in the list: inputs SI, S2, 0 V, and +5 V. Digital control bits SI = K(l27) {sin [21T(N spatial frequency + 2 initial supplied by the microcomputer select the appropriate phase)]/512}, where K~5/127. To produce a drifting signal as given by the truth table in the figure. SI is grating, the microcomputer is programmed to change chosen when a sinusoidal spatial function is required. the initial phase by a constant increment after each S2 produces a spatial-bar pattern when selected. When frame. This displaces the pattern by a fixed number of o V is selected, the raster will be at background lines per frame. For an increment of l/frame, it will
entered via the keypad as any integer between 0 and 255. Within the microcomputer memory is a 256-word sine list. The number entered is converted to the appropriate addresses in the list and the sine and cosine values are transferred to the corresponding PIAs. 0/ A converters change these numbers to analog voltages proportional to -sine 0: and -cosine 0:, respectively. One inverter and four multipliers (Shapley & Rossetto, 1976) are then used to operate on the unrotated x-y voltages to produce the voltages at the summing amplifiers. The rotated x and y signals are available as the x and y inputs to the scope.
MICROCOMPUTER-BASED VISUAL STIMULATOR
543
SPATIAL FUNCTION GENERATOR BLOCK
DIAGRAM
DIGITAL
CONTRQ.
Sl'l\TIAL
FLtlCTlON
TRIITH
TAIlLE
BIT D
o
AHAl.OG MPXR BIT I
0
SPIlTIALFCT
OV
lOSI
o
/ 9 BIT ADDRESS •
P1AS
a
5V S2
(; \Spaliolfroq
+ 2 , IIi!
(111
modulo 512
DlGIllIl. COiTRDL FOR ANALOG MPXR. GET n£R IAUES
FRCJol
MICROCCM'UTER
Figure 4. Spatial-function generator block diagram. Spatial functions created by this generator are standing-sinusoidal or standing-bar gratings, drifting-sinusoidal or drifting-bar gratings, or constant backgrounds. The spatial function selected is determined by the minicomputer.
take 256 frames to go through a complete cycle. Since 256 frames take 1 sec, the drift rate for an increment of one is 1 cps. If the initial phase is held constant throughout the experiment, Sl produces a standing wave at a preset phase of N cycles corresponding to the spatial frequency. S2 is the signal that produces the spatial-bar function. It is created by comparison logic that compares the 8 most significant bits of the address register A8 with two numbers, NI and N2, supplied by the microcomputer to the "bar" PIAs. A8 =: integer part of: [(Nx SF + 24» Modulo 512) 12, where N =: the line number in the raster, cp =: the number in the initial-phase PIA, and SF =: spatial frequency. Digital comparator I produces an output whenever A8 ~ Nl , while digital comparator 2 provides an output whenever A8 ~ N2. The logical "and" produces S2, which provides 5 V whenever NI ~ A8 ~ N2. The bar width is approximately 2(N2 - NI + 1)/(spatial frequency) lines wide. The starting position of the bar is determined by NI and cp. The number of bars is specified by the spatial frequency. If cp is a constant during the experiment, S2 will be a standing-bar pattern. If cp is a variable, S2 will produce a drifting bar. The signature of the bar (+ or - with respect to background) will be determined by the number provided to the temporal PIA in the temporal-modulation block described below. Temporal Modulator Figure 5 shows the block diagram of the temporalmodulation and z output circuitry. The temporal
function is produced by the multiplying D/A converter. Its voltage output is proportional to the product of a reference voltage input R and the digital data input given by N2. That is, TF =: Kz RN2. Nl is a number provided by the microcomputer to the depth-ofmodulation PIA. The reference R provided by the other 01 A converter is proportional to Nl , so that R =: K 1 Nl. Therefore, TF =: K 1 K z Nl N2. The number NI is a constant that remains fixed throughout the course of an experiment, and it determines the depth of modulation. N2 is the number provided to the temporal PIA. For contrast-reversal experiments, N2 changes at a rate that is consistent with the selected temporal frequency. N2 may correspond to a square wave or a sine wave. For drifting-grating experiments, N2 is a constant. In bar experiments the sign of N2 determines whether the bar luminance is brighter or dimmer than the background. Data Acquisition Circuits Analog data are passed to a Burr-Brown ADC82 8-bit AID converter. A conversion is performed at the end of each sweep. The converted byte is transferred to a PIA that is available to be sampled in an interrupt service routine driven by an end-of-sweep signal. Spike data are expected to be either in the form of TTL pulses or analog pulses in the range of 0-5 V. Two separate BNC connectors are provided on the front panel of the instrument for these signals. A front panel switch is provided for selecting the appropriate signal. The analog signal is sent to a 7413 Schmitt trigger circuit that
544
MILKMAN, SHAPLEY, AND SCHICK TEMPORAL MODULATION BLOCK
a
Z
OJTPUT
OIl
IN ACCOllDANCE WITH
DIAGRAM
FOR A FLASHING GRATING DATA VARYING SINUSOIDALLY SQUARE WAVE
FOR A DRIFTING GRATING DATA OUT OF TEMPORAL PIA
EOUIV. TO ±MAX VALUE
Figure S. Temporal-function generator and z output. The temporal function is provided by the multiplying D/A converter. Its output is proportional to the reference input voltage multiplied by the data inputs provided by the temporal PIA. It determines the maximum voltage swing that can be produced by the multiplying D/A converter. At the start of each frame, the temporal PIA is updated by the microcomputer.
converts it to a TTL level. The TTL signal is used to produce an interrupt that causes the spike to be processed in a spike-interrupt service routine.
VISUALPATIERNS Three different kinds of spatial functions can be produced by the spatial modulator: (1) a sinusoidal grating, (2) a bar grating, and (3) a flxed background. The spatial frequency of a grating and its initial (spatial) phase are determined by the experimenter. The temporal modulator can provide three basic functions: sinusoidal modulation, square-wave modulation, or constant modulation. Modulation amplitude is also set by the experimenter. It is possible to provide as many kinds of stimulus patterns as there are combinations of spatial and temporal functions. Most of the useful patterns are described below. (1) A Drifting-Sinusoidal Grating For a single frame, luminance is distributed sinusoidally as a function of position along the sweep of the raster. For a spatial frequency of N, the luminance pattern consists of N cycles of a sine wave with 512/N lines per cycle. The drift rate is selectable from the set of frequencies that include 118, 1/4, 1/2, 1,2,4,8,16, and 32 cps. During a drifting-grating experiment, the temporal modulation is held constant at a preset amplitude that determines the amount of contrast. Contrast is defined as (Imax - Imin)/(Imax + Imin), where Imax and Imin are the maximum and minimum luminance in the pattern.
(2) A Drifting-Bar Grating In this case, over a single frame there are N bars (with a rectangular luminance profile) that may be either light or dark with respect to a background. In the special case where N = 1, this pattern is a single bar drifting in one direction. (3) Sinusoidal Temporal Modulation of a Spatial-Sinusoidal Grating In this case, temporal modulation is varied sinusoidally at a frequency between 1/8 and 32 Hz. The product of temporal and spatial modulation produces gradual contrast reversals of the spatial patterns. (4) Square-Wave Temporal Modulation of a Spatial-Sinusoidal Grating The spatial pattern is a sine grating, and the temporal modulation is a square wave at one of the selectable frequencies. This results in sudden sharp contrast reversals of the spatial sinusoids. (5) Sinusoidal Temporal Modulation of a Spatial-Bar Grating In this case, temporal modulation is only effective in the bars, so that contrast reversals occur only over selected spatial intervals. The raster between the bars is kept at a constant background intensity. (6) Square-Wave Temporal Modulation of a Spatial-Bar Grating The spatial pattern is similar to Pattern 5 above. However, the square-wave temporal modulation
MICROCOMPUTER-BASED VISUAL STIMULATOR produces contrast reversals within the bars that are sharp and sudden. (7) Diffuse-Sinusoidal Temporal Modulation In this case there is no spatial modulation. The whole raster is sinusoidally modulated. (8) Square-Wave Temporal Modulation of a Constant Spatial Pattern This is similar to Pattern 7 above except that the temporal function is a square wave. COST AND FLEXIBILITY The instrument described was built in the electronics shop at the Rockefeller University and debugged in our laboratory. The in-house cost for the system, including parts and labor, is approximately $4,000 without the display oscilloscope. To the best of our knowledge, there is no single commercial instrument on the market that performs the same tasks. We can and do perform similar experiments with minicomputers (PDP l ls) interfaced to raster generators, as described by Shapley and Rossetto (1976). The cost of such a minicomputer system is in the $20,000 range. Of course, the minicomputer system at the present state of the art is much more powerful and can provide sophisticated systems analysis, but it is not portable.
545
In principle, this system could have been designed using hardware alone. But there are many reasons why such an effort would fail. First, the logical design effort required to perform the same tasks would be Herculean in comparison with. the logic provided by the Motorola 6800 microprocessor and associated parts, including the program in the Intel2708 EPROM. Furthermore, the hardware costs and the labor costs for the wiring make an all-hardware instrument far more expensive. Finally, each time the experimenter wants to do something just a little bit different, he merely has to change the program and reblast the EPROM. One shudders to think of the effort required to achieve equivalent flexibility in a special-purpose all-hardware machine.
REFERENCES ENROTH-CUGELL. c.. & ROBSON. J. G. The contrast sensitivity of retinal ganglion cells of the cat. Journal of Physiology, 1966, 187, 517-552. HOCHSTEIN, S., & SHAPLEY, R. M. Quantitative analysis of retinal ganglion cell classifications. Journal of Physiology, 1976, 266, 237-264. SHAPLEY, R. M., & ROSSETTO, M. An electronic visual stimulator. Behavior Research Methods & Instrumentation, 1976, S. 15-20. (Received for publication July 5,1977; revision accepted August 19, 1977.)