A Middleware Solution to Monitoring Composite Web Services-based Processes Farhana H. Zulkernine and Patrick Martin School of Computing, Queen’s University Kingston, ON K7L 3N6, Canada {farhana, martin}@cs.queensu.ca
Kirk Wilson, Ph.D. Research Staff Member CA Labs, CA, Inc.
[email protected]
Abstract Web services can be composed to create complex business processes that span multiple organizations. Quality of Service (QoS) of such a process is guaranteed by a set of Service Level Agreements (SLAs) between the service providers and the service consumers. Monitoring is required at every service provider and at the service consumer end in order to ensure satisfaction of the SLAs. Distributed monitoring of business processes can be complex and costly. We propose a middleware solution, namely the Performance Monitor (PM) framework, to enable outsourcing of the task of SLA monitoring of both intra and inter-organizational composite Web service processes. We present a prototype implementation of the PM with experimental data to establish the effectiveness of the framework in monitoring and verifying SLAs for a composite process and discuss possible extensions to the framework for more generalized applications.
1. Introduction The World Wide Web is becoming the most efficient communication media, and to follow the current trend towards Service Oriented Architecture (SOA), business organizations are offering different services on the Internet. Web services offer the greatest potential of weaving together multiple services dynamically into a composite service system [7] representing a business process [12], and thus, leveraging Business-to-Business (B2B) and Business-to-Consumer (B2C) communications [8]. However, the success of Web-based business processes largely depends on Quality of Service (QoS) which is guaranteed by Service Level Agreements (SLAs) [5][10]. A set of SLAs are agreed upon between each service provider and service consumer in a business process with a view to maintaining service quality and protecting the rights of the parties involved. To ensure that the SLAs are satisfied, efficient monitoring of the
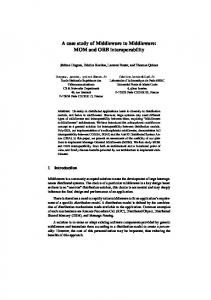
process is essential both on the service provider and the service consumer’s ends. SLAs typically define service quality attributes such as response time, availability and reliability, which the service consumer expects from the service provider. A number of current software products [2][4][6] provide extensive monitoring functionality. However, they all work in organizational domains and are efficient for server-side monitoring at the service provider’s site. The difficulty lies in client-side monitoring of the Web processes due to the distributed architecture, compositional complexity, and network dependency. In complex composite systems, a service may itself be a composite service. As such there can be processes containing sub-processes contributing further to the complexity in distributed monitoring. Service performance statistics can be monitored at the workflow execution engine but these values include network delay. For SLA verification more accurate service performance statistics are necessary. Statistic collection should also have little or no impact of the network. To the best of our knowledge, a proper solution for multi-organizational distributed process monitoring currently does not exist. In this paper, we expand and illustrate the Performance Monitor (PM) module, originally proposed as a part of our earlier work, the Comprehensive Service Management Middleware (CSMM) [25] (as shown in Figure 1). Our current research presents the detailed design of the PM middleware framework, and implements a proof-of-concept prototype to validate the PM framework using an example Web services-based process. The contribution of the research is twofold. First, we present a framework for monitoring and verifying SLAs of composite Web services-based processes. Second, we implement a prototype and provide experimental results to validate the proposed monitoring framework and to examine the overhead of the monitoring technique used by the framework. Additionally, the research also lays out the ground work for automatic creation of a reputation
Service Req. Spec.
Selected services
Policies & Sel. Services
SLAs
Services & params
WorkSLAs & flow Workflow
QoS Report
Service Req. Handler (WS)
Negotiation Broker (WS)
Workflow Manager (WS)
Performance Monitor (WS)
Selects services given service requirements specifications
Applies policies from both consumer and provider to negotiate SLAs
Builds a workflow and executes the given workflow
Monitors component service performances given SLAs
CSMM outputs
CSMM inputs
CSMM (WS)
KB of negotiation policies
Extended UDDI Ontology-based service description
Certified Reputation knowledgebase
Error Tracking and Recovery
Negotiation policies
Reports from WSs
Possible service call Data communication Data external to CSM
Figure 1: Comprehensive Service Management Middleware (CSMM) knowledgebase that can facilitate QoS-based service discovery [24] using the performance data collected by the monitoring middleware. The usability of the framework can be extended to general Web process monitoring, creating federated monitoring system for broker services (that composes other services to provide a higher level service), providing reputation broker services, and monitoring services for low powered mobile and embedded devices. The rest of the paper is organized as follows. The next section defines some concepts and methodologies for monitoring Web services-based processes. Some related works are highlighted in Section 3. The detailed design of the PM and how it can be used for monitoring a
Calls service A
A
Calls process P
Calls service A
B
Service A returns Calls service B
B
Client app. starts
Service B returns Print results Program ends
Service A executes
A
Service A returns
D
Process P
Client app. starts
C
Services return Calls services
E
Services return
Returns from process P Program ends
Figure 2: Petri net representation of (a) a simple workflow, (b) a complex workflow
composite Web service process are described in Section 4. Section 5 illustrates and validates the prototype implementation of the PM. A summary including a discussion of the future work and a list of contributions of the PM conclude the paper in Section 6.
2. Web Service-Based Workflows and Monitoring Techniques A Web service-based workflow typically contains chains of Web services which constitute a business process. Figure 2(a) shows a very simple workflow where the client application calls two different Web services consecutively. Figure 2(b) shows a more complex workflow having multiple chains of Web services that execute concurrently. Two of the three parallel branches constitute a sub-process (enclosed by the dashed line), which is composed of multiple Web services. Each subprocess and individual Web service component in a workflow has to satisfy a SLA, which is negotiated between the service provider and the service consumer before the process begins. When monitoring the SLAs, a sub-process is considered as a single Web service and the SLA is validated for the sub-process and not for its component services. For example, in Figure 2(b) the SLA is monitored for P, which is a composite service. We demonstrate the functionality of the PM using a simple
workflow as shown in Figure 2(a) but the same principles apply to more complex workflows. Communication with Web services is most commonly done using the standard SOAP (Simple Object Access Protocol) [23] messaging protocol. A SOAP message is an XML document that contains an optional Header section for metadata and processing information, and a required Body section for the main message content. As a result, message interception is typically used to monitor Web services. There are two common ways of monitoring Web services using message interception. One way is to build internal agents into the messaging framework at the servers that host Web services, which allow monitoring and reporting of the performance data. The agent should preferably be a standard part of the messaging framework and can provide monitoring data as an additional service. The other way is to build external intermediaries in between the Web service environment and the consumer, such as with CA’s Unicenter [6]. This approach allows easy maintenance at the cost of management overhead, an additional level of message redirection, possible bottlenecks and points of failure. Other monitoring techniques include code level instrumentation with various monitoring and reporting functions or APIs (Application Programming Interfaces). Although this technique has the obvious advantage of reporting extensive and accurate monitoring data, the cost of maintaining the code can be considerable. Publishing management Web services for querying performance data or getting automated policy-based notification from the service providers can provide an efficient solution to the monitoring problem. The Site Manager in our Autonomic Web services Environment (AWSE) [19] is an example of such a management Web service. However, it requires the service provider to implement custom management frameworks such as AWSE. In this paper, we use the internal agent-based technique because of its generality.
3. Related Work Extensive research has been done on server-side resource, network and intra-organizational process monitoring. Several software products are available in the market that can provide comprehensive monitoring data. However, monitoring inter-organizational Web servicesbased processes has received less attention. Momm et al. [14] propose a conceptual manageability infrastructure for SLA-driven management which uses the Common Information Model (CIM) to model management information along with the Web-based Enterprise Management standard to monitor Web service compositions. Our approach is validated using a prototype that uses the basic Web services standards.
Vaculín and Sycara [21] describe an event-based monitoring and error-handling mechanism for OWL-S based semantic Web services using an OWL-S Virtual Machine (OVM) middleware, which is a generic OWL-S processor. The client needs a basic OWL-S processing engine to process OWL events. Our framework does not mandate the clients use any specific tool. Tröger et al. [20] present Adaptive Services Grid Services Infrastructure (SI) architecture that is basically a thin and scalable abstraction layer between the service consumer and the service provider. The SI is used for stateful instantiation of services which allows monitoring using the established Web service standards. The PM relies on messaging and reporting tools for monitoring. Sahai et al. [16] from Hewlett Packard Laboratory (HP Lab) propose a Management Service Provider (MSP) model for remote or outsourced monitoring using agent technology where E-services are instrumented with APIs to enable transaction monitoring by a manager. The basic architecture resembles that of the PM but the implementation details differ. A message tracking algorithm is proposed by Sahai et al. [17] that uses a special data structure for distributed monitoring of services in a composite Web service process. Each service provider executes the algorithm on the data structure that cumulates all the data relating to the execution of the process to confirm proper execution of the process or recovery from failure. This approach adds a processing overhead to each Web service, uses considerable network bandwidth for the transfer of the data, and introduces possible data loss due to failure of a service. The PM applies a more centralized approach to data processing. Both Web Service Management Network (WSMN) Agent framework [13] proposed by HP Lab researchers and CA’s Unicenter [6] use message interception at intermediaries for federated service management. IBM’s Enterprise Workload Manager (EWLM) [4] uses reporting agents to collect monitoring data from services instrumented with the Application Response Measurement (ARM) [11] API. CA Wily SOA Manager [3] is another very recent product from CA that uses agents both at the service provider and the service consumer’s ends to monitor and manage Web service processes. Our approach is much simpler and more standard-based, less intrusive to the service code, and may be generalized for a wider scope of monitoring with an updated message processing layer as a standard monitoring tool.
4. The PM framework The Performance Monitor (PM) can be used as an independent service, as shown in this paper, or as one of the main modules of the Comprehensive Service
Management Middleware (CSMM) [34]. The CSMM provides a complete client-side service management solution by facilitating service selection, SLA negotiation, workflow orchestration and execution, and SLA monitoring. The PM takes a set of negotiated SLAs and a workflow description as input and monitors the performance of the component services to verify that the SLAs are satisfied. It can also be used independent of the CSMM to provide third party distributed workflow monitoring services. We show all the components in the CSMM that are directly connected to the PM in Figure 1 to indicate how the PM is used in the CSMM. The PM comprises two types of disjoint subsystems namely, a Primary Subsystem (PS) and multiple Secondary Subsystems (SS). The SSs monitor service performance at service providers’ locations using one of the monitoring techniques and send the reports to the PS. The PS accepts monitoring requests, receives monitoring reports, analyzes the reports to verify SLAs, and accordingly generates notifications for the respective service consumers. In this paper, we design the SS using the internal agent-based message interception technique to illustrate that the SS can be implemented as a standard integrated part of the message processing layer at the service provider’s site, which can be optionally enabled to monitor selected services hosted by the server. This may require collaboration with the service provider, like all other approaches, but reduces additional system maintenance and message redirection overhead. The integrated approach provides on site monitoring data which is independent of the network performance. Figure 3 shows the two sub-systems of the PM.
services in the workflow during its execution. If a violation of an SLA is detected in the analysis of the monitoring reports, the PMWS sends out notifications to the designated receivers such as the service consumer, workflow executor and the ETR.
4.1. The Primary Sub-system (PS)
Workflow Analyzer (WA)
The Primary Subsystem (PS) collects and processes monitoring requests and reports and communicates with the other modules in the CSMM such as the Error Tracking and Recovery module (ETR) and the Reputation Knowledgebase (RepKB). It consists of four main modules as described below.
Performance Monitor Web Service The Performance Monitor Web Service (PMWS) receives requests for the monitoring service from consumers and reports from the SSs. The consumers provide workflow definitions and SLAs for all the component services as inputs when requesting the monitoring service. The PMWS forwards the information it receives to other modules for processing. After the monitor request is processed it sends a reply message to the service consumer, the SOAP header [23] of which contains the information necessary for monitoring by the SSs. This header information is included in every message that is used to invoke the component Web
SLAs & Workflow Workflow Analyzer
PMDB
Report to the client
Performance Monitor (WS)
Report Analyzer
Expanded PM module Primary Subsystem of the Performance Monitor
SOAP message Reports to 1
Custom Handlers
Reports from WSs
1
Certified QoS Reputation Knowledgebase Error Tracking and Recovery ( To other components in CSMM )
Web Service
SOAP Messaging Framework Secondary Subsystem – On the server hosting Web services
Figure 3: Architecture of the Performance Monitor
The PMWS passes the workflow and the SLA information it receives from the consumer to the Workflow Analyzer (WA). The WA analyzes the workflow and the SLA specifications of each of the component Web services to determine their order of execution in the workflow and the QoS attributes that need to be monitored, and stores the information in a local database. It generates a Process ID (PID) for the workflow and a list of QoS attributes to be monitored for each component Web service and sends the information to the PMWS. The PMWS puts this information in the SOAP header of the message to send as a reply to the monitor request from the service consumer. The WA can be built to support any workflow specification language, such as the WS-BPEL [15], and SLA specification language, such as the WSLA (Web Service Level Agreement) [5].
Performance Monitor Database (PMDB) A local Performance Monitor Database (PMDB) is used to store temporary workflow and SLA information,
PIDs, and performance data from the reports collected from the SSs.
Report Analyzer (RA) Performance reports by the PMWS are forwarded to the Report Analyzer (RA) module. The RA stores the reports according to their respective PIDs and Web service information in the PMDB. It then checks to verify if the SLAs are satisfied. If a violation of the SLA is detected, the RA prepares a report for the PMWS to send to the designated receivers as requested by the consumer and to the ETR.
recovery. In the recovery process, if a change in the workflow and SLA occurs, the PM is notified by the WM to make the necessary changes in its records for monitoring. The RepKB is generated and updated from the monitor data received by the PM. Statistics are calculated from the monitor data based on which reputation scores are assigned to the different Web services monitored by the PM. The automation of reporting certifies the accuracy and dependability of the reputation information in the RepKB, which can be used for efficient service discovery. Detailed descriptions of these components are outside of the scope of this paper.
4.2. The Secondary Sub-system (SS)
5. Prototype Implementation The Custom Performance Monitor Handler (CPMH) makes up the Secondary Sub-system (SS) and is installed as part of the SOAP message processing layer on the server that hosts the Web service. A SOAP message typically goes through several layers of processing after it reaches the destination Web server prior to reaching the appropriate Web service. One of these layers is the SOAP message processing layer, which can contain multiple handlers that intercept the messages, retrieve required information from the SOAP header, and perform necessary pre and post-processing. The CPMH intercepts SOAP messages in both directions, i.e., to and from the Web service, in order to calculate the service response time. The CPMH checks for the PID and the URL to which to send the monitor report. In case of privacy and security concerns, additional privacy policies and encryption techniques can be used as proposed by Sahai et al. [17].
4.3. Associated CSMM Modules The PM connects to an Error Tracking and Recovery (ETR) module, a certified Reputation Knowledgebase (RepKB) and the Workflow Manager (WM) in the CSMM. When a violation of a SLA is detected, the PM reports it to the ETR, which implements a policy-based decision making system to initiate proper action for
CPMH
PMWS WA
RA
PMDB
S1
WS1 WS2 S2
Consumer Application S3
Figure 4: Layout of the servers for the prototype implementation
We illustrate the functionality and validity of the PM by a prototype implemented in our lab as shown in Figure 4. We use the prototype to monitor a workflow similar to Figure 2(a). The workflow is composed of two experimental Web services, WS1 (actual name WSOMAroma) and WS2 (actual name WSCompany) which are executed in sequence. A load generator application written in Java is used as the consumer. It first requests the PM for monitor service and then executes the workflow. The PM (PS) resides on one server (S1), which runs the HTTP server and the application server to host the PMWS. WS1 and WS2 are hosted on a second server (S2), where the CPMH (SS) is installed as a part of the message processing layer. The consumer application runs on a third machine (S3), which is similar to the server machines but requires Java Virtual Machine (JVM) and only the necessary libraries to run the application. We use an Apache 2.2.3 HTTP server [2] with an Apache Tomcat 6.0 application server and Axis2 as the SOAP messaging framework for the Web services. The PMDB is created using IBM DB2 version 9.1. We use IBM Intel Pentium 4 Desktops with 2.66GHz CPU and 512MB of RAM as the server and the client machines with the Microsoft Windows XP Professional Version 2002 Service Pack 2 operating system. In the example scenario we monitor the response time and availability of the services by using the two-way Message Exchange Pattern (MEP) [22] i.e., all the requests for services are matched with a reply. We use simple XML specifications for the workflow and SLAs as shown in Figure 5, which the service consumer sends to the PM to request monitoring services. In response the PM returns a reply message containing a SOAP header block enclosed by the tag as shown in Figure 6 which states the necessary information for the SS. After receiving the reply the service consumer starts executing the workflow and embeds the header information in the SOAP header of the messages used to invoke the component services in the workflow. Figure 7
5.1. Validation Our experimental Web service composition first calls the executeQuery0 operation of the Web service WSOMAroma (WS1) and then the companyQuery0 operation of the Web service WSCompany (WS2) in sequence. executeQuery0 performs a sales related query on the AromaDB [9], which is a DB2 database containing 11 tables with about 70,000 records in one table including 1 Farhana Zulkernine http://cs.queensu.ca/home/farhana/index.htm http://localhost:8080/axis2/services/PerformanceMonitor 2007-06-09 03:01:39.14
Consumer PMWS WS1 WS2
Reply with PID Invoke WS1 Service response Report for WS1 Report to client if any error occurs Invoke WS2 Service response Report for WS2 Report to client as process ends
Figure 7: Message flow in monitoring using the PM an XML data field. companyQuery0 retrieves employee data from CompanyDB, another smaller DB2 database containing 6 tables. In all our experiments service performance is monitored at three different points: at the host Web server using a very basic code-level instrumentation; at the messaging framework using the CPMH and the PM, and at the consumer application. We implement connection pools for the databases in the Web services to reduce the significant impact of DB connection time on service performance as we increase the number of clients. First we show (Figure 8) the differences in response times measured at the code and at the client due to the network and associated software components which are necessary to invoke a Web service. Figure 9 shows the performance of WS2 with and without monitoring at the three levels. Besides the network factor, one of the reasons for the overhead in response time measured at the client level is that all clients are executed on the same machine. For the same run, the overhead measured at the code level is insignificant, which is more clearly shown in Figure 10. Also compared to the client-level monitoring data, the PM provides a much closer measurement to that of the code 1200
WS1_client WS1_Code
1000
WS2_Client WS2_Code
800
600
400
200
0 1
Figure 6: SOAP header content for Web service calls
CPMH
Monitor request
Response Time (ms)
shows the message sequence chart for … our example … scenario. As services … are invoked, the CPMH sends the monitoring data of … the specified QoS … attributes to the … … URLs specified in the SOAP header. The … dashed arrows indicate reports from the CPMH. In ... absence of the required information, no monitoring is done for the message. Figure 5: Parameters for The CPMH the Monitor Request correlates the requests and replies of a Web service by using the PID and other associated context information in the messages. Upon receipt of the reports, the PM validates the SLAs. If a violation of SLA is detected it reports immediately, otherwise sends a general report at the end of the process. We note that the ability to specify multiple receivers, for example Consumer_URL and Manager_URL in Figure 6, makes the PM framework well-suited to distributed systems.
2
3
4
5
6
7
Clients
Figure 8: No monitoring
8
9
10
450
300
Response time (ms)
350
Response Time (ms)
1200
WS2_Monitor_Client WS2_NoMonitor_Client WS2_Monitor_Code WS2_NoMonitor_Code WS2_Monitor_PM
400
250 200
WS1_Monitor_Client WS1_NoMonitor_Client WS1_Monitor_Code WS1_NoMonitor_Code WS1_Monitor_PM
1000
800
600
400
150 100
200
50 0
0 1
2
3
4
5
6
7
8
9
1
10
level, which justifies why the PM is a better tool for SLA verification. Figure 11 shows that without monitoring, the response time of WS1 increases more linearly than with monitoring. The reason behind this is the absence of a workload adaptation technique on the server side causes performance degradation with sudden increase in workload for WS1. WS2 does not demonstrate such behavior because the prior call to WS1 inserts a queuing delay for WS2. Due to the same reason, WS1 performs better with monitoring because then the first call is made to the PM. We verified this hypothesis by inserting a small delay for every process. Figure 12 confirms the performance improvement of WS1although WS2 suffers.
5.2. Discussion We encountered several obstacles in implementing the prototype. We developed Axis2 handlers as SSs for our prototype. When the services are down, the handlers do not function. We implemented a timeout strategy to get around this problem. Ideally the handlers should function even if the services are down. The handlers intercept messages to and from the services to measure response time. For monitoring operations that follow the InOnly Message Exchange Pattern, i.e., Web service calls that do not generate any response other reporting techniques will have to be used. WS2_Monitor_Client WS2_Monitor_PM WS2_Monitor_Code WS2_NoMonitor_Code
400
4
5
6
7
8
9
10
6. Conclusion Monitoring distributed Web services-based processes for the verification of the SLAs poses a challenging problem due to the dependency on the network and the distributed nature of composite processes. Business processes need to be monitored at both service consumer and service provider ends to maintain the QoS. We propose the Performance Monitor (PM) middleware to enable outsourcing of the task of client-side monitoring using established Web service standards. The PM uses multiple SSs which report performance data to a PS. We envision that in future messaging frameworks will have some built-in monitoring features that can be used by tools such as the PM.. The Web service-based architecture of the PM allows any SS to report monitoring data to the PS with little customization and expand the usability of the PM to general Web processes. The PM reduces monitoring overhead on the clients which can be very effective for embedded or limited power mobile devices. It also allows reporting to multiple endpoints, and enables computation of group statistics for multiple processes such as, 98% availability, 5 seconds average response time, or 99% reliability for all transactions of an organization. Although message interception has proven to be an WS1_Monitor_Client WS1_NoMonitorDelay_Client WS1_NoMonitor_NoDelay_Client WS2_Monitor_Client WS2_NoMonitorDelay_Client WS2_NoMonitor_NoDelay_Client
1200
1000
Response Time (ms)
Response Time (ms)
350
3
Figure 11: Effect of workload on WS1
Figure 9: Monitoring overhead for WS2
450
2
Clients
Clients
300 250 200 150 100
800
600
400
200
50 0
0 1
2
3
4
5
6
Clients
7
8
9
Figure 10: Monitoring overhead for WS2
10
1
2
3
4
5
6
Clients
7
8
9
Figure 12: Effect of delay on WS1 and WS2
10
efficient approach to monitoring Web services, it does not provide detailed monitoring data, such as, latency time, database access time, and failure of a component or resource the service is dependent upon. In-code instrumentation can provide a more comprehensive performance report and can be combined with a reporting agent to work as a SS for the PM although it would incur maintenance overhead. Security and privacy measures, such as firewalls, authentication schemes, and different access control policies can create hindrances for monitoring applications by denying access to the messages we need to monitor. As future work, we intend to use other SSs such as our server-side AWSE framework [19], which provides a query interface to get performance data. Server-side monitoring tools that allow subscription to events for getting automated performance reports can also be used as SSs. We would like to explore other QoS attributes that can be monitored, use the PM with the CSMM for comprehensive process management and policy-based notifications, and use the performance data for creating a reputation knowledge base for QoS-based service discovery.
7. References [1] Andonoff, E., Bouzguenda, L., and Hanachi, C., 2005. Specifying Workflow Web Services Using Petri Nets with Objects and Generating of Their OWL-S Specifications. LNCS, Vol. 3590/2005, pp. 41-52, Springer. [2] APACHE HTTP Server, TOMCAT, AXIS2. Retrieved from: http://httpd.apache.org/ June 26, 2007. [3] CA, 2007. CA Wily SOA Manager – Monitor and Manage Web Services Performance. White paper. At: http://www. wilytech.com/solutions/products/SOA-Manager.html. [4] Chan, Y., Min, H., and Winkelbauer, L., 2006. Hardening the EWLM Performance Data, IBM Red Paper, at:
[11]
[12]
[13]
[14]
[15]
[16]
[17]
[18]
[19]
[20]
http://www.redbooks.ibm.com/redpapers/pdfs/redp4018.pdf.
[5] Dan, Davis, Kearney, Keller, King, Kuebler, Ludwig, Polan, Spreitzer, and Youssef, 2004. Web services on demand: WSLA-driven automated management, IBM Systems Journal, Vol. 43 (1). [6] Dmitri Tcherevik 2004. Managing Web Services with Unicenter® Web Services, White Paper, Office of the CTO, retrieved June 4, 2007, at: http://www.ca.com/files/ WhitePapers/uni_wsdm_cto_wp.pdf. [7] Dustdar, S. And Schreiner, W., 2005. A Survey on web services composition. Int. Journal Web and Grid Services, Vol. 1(1), pp. 1-30. [8] Hogg, K. Chilcott, P., Nolan M., and Srinivasan, B., 2004. An evaluation of Web services in the design of a B2B application, in Proc. of the conference on Australasian Computer Science, Vol. 26. [9] IBM DB2 SQL and XQUERY Tutorial, Part 1. Retrieved from: http://www.ibm.com/developerworks/edu/dm-dwdm-0607cao-i.html June 26, 2007. [10] Iyengar, A., King, R., Ludwig, H., and Rouvellou, I., 2003.
[21]
[22] [23] [24]
[25]
Performance and Service Level Considerations for Distributed Web Applications, in Proc. of the 7th World Multi-conference on Systems, Cybernetics, and Informatics (SCI), Orlando, Florida. Johnson, M., 2005. Monitoring and Diagnosing Applications with ARM 4.0. MeasureIT, Issue 3.3, Computer Measurement Group (CMG). Lipton, P., 2004. Composition and Management of Web Services, White Paper, available at: http://www.syscon.com/story/print.cfm?storyid=43567. Machiraju, V., Sahai, A., and Van Moorsel, A., 2002. Web Services Management Network: An Overlay Network for Federated Service Management, Hewlett Packard Technical Report HPL-2002-234. Momm, C., Mayerl, C., Rathfelder, C., and Abeck, S., 2007. A Manageability Infrastructure for the Monitoring of Web Service Compositions. To appear in: 14th HP-SUA Workshop, München. OASIS WS-BPEL (Web Services Business Process Execution Language) 2.0 Draft, 2006. At: http://www. oasisopen.org/committees/tc_home.php?wg_abbrev=wsbpel. Sahai, A., Machiraju, V., and Wurster, K., 2001. Monitoring and Controlling Internet based Services, In Proc. of the IEEE Workshop on Internet Applications (WIAPP'01), San Jose, CA. Sahai, A., Machiraju, V., Ouyang, J., and Wurster, K. 2001. Message Tracking in SOAP-based Web Services, Hewlett Packard Technical Report. HPL-2001-199. Simon, L., Mallya, A., Bansal, A., Gupta, G., and Hite, T. D., 2005. A Universal Service Description Language, Proc. of the IEEE International Conference on Web Services, Orlando, Fl. Tian, W., Zulkernine, F., Zebedee, J., Powley, W., and Martin, P., 2005. An Architecture for an Autonomic Web Services Environment. Proc. of the Workshop on Web Services and Model-Driven Enterprise Information Systems with ICEIS, Miami, Fl. Tröger, P., Meyer, H., Melzer, I. and Flehmig, M., 2007. Dynamic Provisioning and Monitoring of Stateful Services. In Proc. of the 3rd Int. Conf. on Web Information Systems and Technology (WEBIST’07), pp. 434-438, INSTICC, Madeira, Portugal. Vaculín R. and Sycara K., 2002. Automated SLA Monitoring for Web Services Monitoring: An OWL-S based Approach. In Proc. of IEEE/IFIP DSOM, (Ed.) Sirin and Parsia. W3C Message Exchange Patterns, 2002. Available at: http://www.w3.org/2002/ws/cg/2/07/meps.html. W3C SOAP Version 1.2 Part 1: Messaging Framework, June 2004. At: http://www.w3.org/TR/soap12-part1/. Xu, Z., Martin, P., Powley, W., and Zulkernine, F., 2007. Reputation-Enhanced QoS-based Web Services Discovery, In Proc. of the IEEE Int. Conf. on Web Services (ICWS'07), Salt Lake City, Utah, USA. Zulkernine, F., and Martin, P., 2007. Conceptual Framework for a Comprehensive Service Management Middleware, In Proc. of Int. IEEE Workshop on Service Oriented Architectures in Converging Networked Environments (SOCNE'07) in conjunction with AINA 2007, pp. 995-1000, Niagara Falls, Canada.