Technology's Engineering Criteria 2000 (ABET EC2000) Criterion 3 was analyzed. Results indicated ... First established at Purdue University in 1995, the EPICS program aimed to .... oral written learning ethics com design social team. S-B Ï. 2.
AC 2007-2401: CONSTRUCT VALIDITY OF THE EPICS SCALES ACROSS GROUPS: A MIMIC MODELING INVESTIGATION Tao Hong, Purdue University Susan Maller, Purdue University William Oakes, Purdue University Carla Zoltowski, Purdue University
© American Society for Engineering Education, 2007
Construct Validity of the EPICS Scales across Groups: A MIMIC Modeling Investigation Abstract Using the Multiple Indicators, Multiple Causes (MIMIC) modeling approach, this study focused on the investigation of the construct validity of the Engineering Projects in Community Service (EPICS) program evaluation instrument. Possible differential item functioning (DIF) among the observed items were detected and described. The extent to which EPICS students’ gender and major are related to their evaluation on the professional skills and outcomes defined by the Accreditation Board for Engineering and Technology’s Engineering Criteria 2000 (ABET EC2000) Criterion 3 was analyzed. Results indicated that the instrument has acceptable construct validity evidence, and in general gender and major were not predictive of students’ noncognitive measures (e.g., communication and teamwork skills) on the EPICS program evaluation subscales. Background and Theoretical Framework First established at Purdue University in 1995, the EPICS program aimed to integrate engineering undergraduate student teams into local community service multidisciplinary service learning projects. Within EPICS program, teams of undergraduates design, build, and deploy real systems to solve engineering-based problems for local community service and education organizations 1 . It is now operating at 15 universities nationwide with over 1350 students participated 1 . Accreditation Board for Engineering and Technology’s Engineering Criteria 2000 (ABET, 1999) Criterion 3 2 Programs Outcomes and Assessment specifies outcomes college graduates are expected to know and demonstrate from accredited engineering programs. The generality of Criterion 3 objectives require engineering programs to articulate desired program outcomes related to professional skills that the participants can
assess through self-report instruments. In recognition of this complex task, EPICS ABET EC 3 self-report instruments were developed by a team of engineering educators and psychometricians to measure students’ perception of their professional skills and performance and whether an engineering design course effectively promotes the program and Criterion 3 outcomes 3 . Engineering educators will benefit from understanding students’ professional skills level, because critical information will be provided regarding students’ overall perception of the program and a foundation for continuous improvement. Validity is a critical aspect in testing and measurement. It deals with the meaning of a test or instrument, i.e., what is the test supposed to measure and how well it does the job it claims to do. “Construct” is an informed, scientific idea developed or constructed to describe or explain behavior (i.e., intelligence, anxiety, self-esteem, aggression, etc.). Construct validity asks the question of to what extent the test measures the theoretical construct we are interested in. Test or item bias is a factor inherent within a test or item, which has systematically error and prevents accurate, impartial measurement of the object or individual. A test/item is considered biased and thus lacking of construct validity evidence if it is in favor of or against a certain group of individuals. Construct validity can be assessed through factor analysis using the Structural Equation Modeling (SEM) technique. The Multiple Indicators, Multiple Causes (MIMIC) model is a special application of SEM. The general form of a MIMIC model involves some unobserved latent variables “caused” by several x-variables and indicated by several observed yvariables 4 . The model equations are
y = λη + ε η = γ'x +ς where y ' = ( y1 , y 2 , Λ , y p ) are indicators of the latent variable η , and x' = ( x1 , x 2 , Λ , x p )
are the “causes” of η . If combining the two equations above by substituting the second one into the first one, we have y = λγ ' x + λς + ε
= Πx + z Thus, Π = λγ΄ and Cov(z ) = λλ 'ψ + Θ ε , where ψ = Var (ς ) and Θ ε is the diagonal covariance matrix of ε . As one type of structural equation modeling method researchers have when investigating multiple-group differences on a latent construct 5 , MIMIC modeling is critical to validation research. It can be used to (a) fit a theoretical model to a set of data via confirmatory factor analysis (CFA), thus assessing a test’s construct validity, (b) determine whether groups differ in terms of their latent variable means, and (c) investigate potential measurement bias in the measures of these latent variables 6 . MIMIC modeling is especially useful for current research for the following reasons: (1) it works better for small samples 7,8,9 , as opposed to other CFA methods, such as multisample CFA, because there is no need to divide the sample into different groups (e.g., gender or ethnicity groups) which requires the sample size be large enough in each group for accurate parameter estimates, (2) the regular factor analysis analyzes the covariance matrix involving only the response variables, which might not capture the difference across background groups 9,10 . The inclusion of background variables provides MIMIC modeling with important extra information, which enables the researchers to investigate the hypothesis of construct validity and invariance across the sub-population 8 , (3) gender
(Male or Female) and major (Engineering or Non-engineering) were included as covariates in current research to investigate if they are predictive of EPICS scale scores. Using ordinary least-squares regression by directly regressing the observed composite score onto dummy coded background variables will lead to biased regression results because of the measurement error in the observed composite score 11 . In MIMIC modeling, the error terms of the observed indicators are included in model parameter estimation. Although the MIMIC modeling approach has been used considerably in certain areas like Epidemiologic studies 12,13 , no research has applied this multiple group comparison technique to check potential item bias of a set of noncognitive measures used within the context of engineering education. Thus, the purposes of the current study were to use MIMIC modeling to (a) assess the construct validity of the EPICS noncognitive scales via CFA, (b) determine if groups (gender or major) differ on latent means, and (c) test potential gender or major bias of measured variables (observed individual items). Method Participants. The sample was obtained from the 264 students (32% females, 68% males) registered in EPICS program at a major Midwestern U.S. university during the 2005-2006 academic year. Among these students, 75% were in Engineering-related majors (e.g., Electronic Engineering or Civil Engineering), while the rest of 25% were from non-engineering majors. Instrumentation. All data were based on students’ self-ratings on the instrument designed by a team of engineering educators and psychometricians at the same institution. This self-report instrument aimed to conceptualize and measure specific professional skills of the EPICS students, and evaluate whether an engineering design course
effectively promotes the program and Criterion 3 outcomes. Previous study reported the detailed process of scale construction and validation 3 . The ABET Criterion 3 outcomes were formally defined based on theory, empirical evidence, Criterion 3, and the goals of the engineering program. The following eight subscales were included: socialresponsibility, design process, awareness of ethical issues, teamwork, lifelong learning, oral skills, written skills, and communication competence. For each subscale, students record their responses on a 5-point Likert scale (e.g., 1=strongly disagree to 5=strongly agree). The higher the score is, the more the EPICS students agree that the specific engineering design course effectively promotes the program and ABET Criterion 3 outcomes related to their professional skills. The students also took a questionnaire with eighteen demographic questions (gender, race, etc.) along with the survey. Items were reviewed by faulty from the College of Engineering and the College of Education to establish content validity. Item analysis was used to delete, modify and replace poorly performed items (e.g., low item-total correlation or item discrimination). All subscale Cronbach alphas were at or above .90, indicating good reliability and that the scales provided consistent scores. The construct validity of the scales has been supported by methods of confirmatory factor analysis 3 . Data Analysis. LISREL 8.53 was used to estimate the MIMIC model. PRELIS was used to estimate the joint unconditional covariance matrix of the underlying variables and the covariate and its asymptotic covariance matrix 4 . A polychoric covariance matrix of the EPICS subscale scores with maximum likelihood estimation was created as input for the analyses due to the fact that all the items are ordinal in nature. Demographic variables (gender and major) served as covariates or the multiple causes individually to
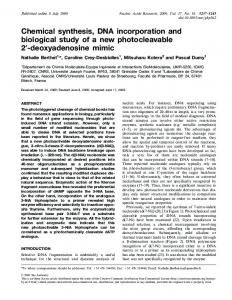
investigate latent mean differences and potential sources of item bias. The analyses in this study were conducted in two major steps. First, CFAs were conducted to fit the onefactor theoretical models to the data. Parameters were estimated and several fit indices were used to examine the fit of the models: Satorra-Bentler’s (S-B) chi-square statistic (χ2) 14 , ratio of chi-square to degrees of freedom (χ2/df), Root Mean Error of Approximations (RMSEA), and Comparative Fit Index (CFI). The chi-square to degrees of freedom ratio with values less than 3.00 indicates good fit 15 . The RMSEA measures the discrepancy between the actual and estimated variance-covariance matrix per degree of freedom, with values equal to or less than .05 indicating good model fit 16,17 . The CFI provides a measure of the discrepancy between a restricted and null model in relation to the fit of the null model, with values above .90 suggesting adequate fit 18,19 . Second, MIMIC models were specified and estimated to investigate the potential gender or major bias for each individual item. The differential effects of each covariate can be investigated by checking if the direct path from the covariate to each observed item is statistically significant 13 . Figure 1 displays a path diagram showing an example of a MIMIC model for the oral skills subscale.
Figure 1: Conceptual Path Diagram for MIMIC Model incorporating a single latent factor (oral) with a single covariate (gender).
gender 1.0
gender
Direct Effect O1
O2
O3 Oral Skills Error
O4
O5
O6
A direct effect of the covariate to an indicator suggested that variance in the measure was explained by group membership in addition to the latent trait 7,8,9 . The loading of the direct effects was considered to be statistically significantly different from zero if the ratio between the parameter estimate and its standard error exceeded two 13 . A direct effect indicates that the subscale contains variance associated with group membership beyond that explained by the latent trait, and latent mean differences
between groups may be confounded by measurement bias. The standardized difference dˆ
was used as an effect size to measure the magnitude for significant group effects 20,5 ,
dˆ =
γˆ
i1 1 2
[Vˆ (ζ )] 1
where, γ is the path between the covariates (e.g., gender) and observed indicators and
Vˆ (ζ ) is the pooled within-group factor variance (e.g., latent factor oral). 1
Results Confirmatory Factor Analysis. Table 1 reports the summary of model fit indices
from the CFAs. The data fit the CFA models adequately well. Although the SatorraBentler’s (S-B) chi-square statistic (χ2) of several subscales were large, the model-data fit was viewed acceptable due to the following reasons: (1) the chi-square statistic (χ2) was significantly affected by the sample size, (2) other model-data fit statistics performed very well and (3) previous study provided similar findings on CFA studies. Thus, these CFA models were used as the baseline models when testing the direct effects in the MIMIC models.
S-B χ2 (df) Χ2/df RMSEA CFI
oral 12.56 (9) 1.4 0.03 0.99
Table 1. Summary of CFA Model-fit Indices Fit Indices written learning ethics com design social team 6.43 48.64 11.54 199.79 315.90 380.44 103.57 (5) (35) (9) (117) (189) (151) (87) 1.3 1.4 1.3 1.7 1.6 2.5 1.2 0.03 0.04 0.03 0.05 0.05 0.07 0.03 0.99 1.00 0.99 0.99 0.93 0.99 0.99
Note. oral=oral skills, written=written skills, learning=lifelong learning, ethics=awareness of ethical issues, com=communication competence, design=design process, social=social responsibility, team=teamwork.
MIMIC Model Analysis. Table 2 and Table 3 report the summary of MIMIC model fit indices for covariates gender and major, respectively. The overall fit of the model is acceptable, except for the social and team subscales which were not shown in the table because of invalid solutions.
Table 2. Summary of MIMIC Model-fit Indices with Covariate gender Model Fit Indices oral written learning ethics com design 2 S-B χ 38.69 14.22 62.68 22.67 302.92 338.64 (df) (14) (9) (44) (13) (126) (208) 2 χ /df 2.7 1.6 1.4 1.7 2.4 1.6 RMSEA 0.08 0.04 0.04 0.05 0.07 0.05 CFI 0.99 0.99 0.99 0.99 0.98 0.99 Table 3. Summary of MIMIC Model-fit Indices with Covariate major Model Fit Indices oral written learning ethics com design S-B χ2 34.39 11.05 58.41 25.39 311.22 337.67 (df) (14) (9) (44) (14) (133) (209) χ2/df 2.4 1.2 1.3 1.8 2.3 1.6 RMSEA 0.07 0.03 0.03 0.05 0.07 0.05 CFI 0.99 0.99 0.99 0.99 0.98 0.93 Table 4 shows those items with significant direct effects (with |t-value| > 2) from the covariate gender (alpha=.05). In this table, the Path Estimate was interpreted as the standardized regression coefficient (direct effects) from the covariate gender to the observed indicators. For instance, the direct effects from gender to item E5 in ethics subscale—I am aware that when gathering information for a product design, it is critical to consider the potential effects (e.g., safety, public health) of the product was -0.194 (|tvalue| = 2.108), indicating potential bias against males: females (coded as zero in the covariate gender) were more likely to positively endorse this Likert scaled item, after conditioning on the latent variable of ethics. When major served as the covariate, however, engineering majors did not tend to score significantly different on any observed item than non-majors.
Table 4. Estimates of Direct Effects from Covariate gender to Potential Biased Items Items with Significant gender Direct Effect (α=0.05) Subscale Item Path Estimate Standard Error t-value ethics Item 5 -0.194 0.092 -2.108 Item 3 -0.179 0.085 -2.100 Item 4 -0.178 0.085 -2.098 Item 6 -0.235 0.084 -2.794 Com Item 9 -0.230 0.085 -2.712 Item 13 -0.215 0.088 -2.460 Item 14 -0.237 0.089 -2.678 Item 15 -0.192 0.088 -2.189 design Item 13 -0.287 0.090 -3.203 Table 5 reports the latent factor means differences. The path from gender to each latent factor indicated that female group generally had a higher latent means on all the subscales except on oral and design. The parameter from major to each subscale showed that students majored in Engineering generally had a lower latent mean score on all three subscales than those non-engineering majored respondents except on design. Effect sizes were found small (.01 - .12). Table 5. Path from Covariates to Latent Factors and Effect Size Measures gender major Latent Factors Path Estimate Effect Size Path Estimate Effect Size oral 0.01 0.01 -0.06 0.01 written -0.09 0.10 -0.03 0.03 learning -0.08 0.10 -0.02 0.02 ethics -0.11 0.12 -0.03 0.03 com -0.05 0.07 -0.09 0.08 design 0.02 0.02 0.02 0.02
Discussion Results indicated that the EPICS scales showed: (a) evidence of strong reliability
and (b) evidence of acceptable construct validity based on CFA model-data fit. Nine items were found to have significant direct effects from covariate gender, thus confounding the interpretation of latent mean differences and indicating potential
measurement bias. Because seven of these nine items belonged to the communication scale, it may be tempting to conclude that male engineering students should be encouraged to take additional communication courses. However, it is unknown to what degree these items (a) may be more difficult for male in a variety of majors, and (b) if males actually differ on the latent trait. That is, with the presence of direct effects, especially on so many items in the scale, latent mean differences are not interpretable. Females and non-engineering majors generally had higher latent means, respectively, although the size effects were small. Considering the need and difficulty in recruiting and retaining female engineering students, these findings are of particular interests because they appear to perform at least as well as males on ABET EC 3 criteria – at least those females who participate in the EPICS program.
References 1. EPICS official website, http://epics.ecn.purdue.edu/about/overview.php 2. ABET (1999). Criteria for Accrediting Engineering Programs. The Engineering Accreditation Commision of the Accreditation Board for Engineering and Technology. http://www.abet.org/eac/eac.htm. 3. Immekus, J. C., Maller, S. J., Tracy, S. and Oakes, W. C. (2005). Evaluating the outcomes of a service learning based course in an engineering education program: preliminary results of the assessment of the engineering projects in community service. Proceedings of the 2005 American Society for Engineering Education Annual Conference & Exposition. 4. Jöreskog, K. G., & Sörbom, D. (2002). LISREL 8 user’s reference guide. Chicago: Scientific Software International. 5. Hancock, G. R. (2001). Effect size, power, and sample size determination for structured means modeling and MIMIC approaches to between-groups hypothesis testing of means on a single latent construct. Psychometrika, 66, 373-388. 6. Muthén, B. (1989a). Latent variable modeling in heterogeneous populations. Psychometrika, 54, 557585. 7. Hancock, G. R. (2004). Experimental, quasi-experimental, and nonexperimental design and analysis with latent variables. In D. Kaplan (Ed.), The Sage handbook of quantitative methodology for the social sciences (pp. 317-334). Thousand Oaks, CA: Sage.
8. Muthén, B. (1988). Some uses of structural equation modeling in validity studies: Extending IRT to external variables. In H. Wainer, & H. Braun (Eds.), Test Validity (pp. 213-238). Hillsdale, NJ: Erlbaum Associates. 9. Muthén, B. (1989b). Factor structure in groups selected on observed scores. BritishJournal of mathematical and Statistical Psychology, 42, 81-90. 10. Muthén, B. (1989c). Multiple-group structural modeling with non-normal continuous variables. British Journal of Mathematical and Statistical Psychology, 42, 55-62. 11. Zumbo, B. D. (2005), Structural Equation Modeling and Test Validation. Encyclopedia of Statistics in Behavioral Science, 4, pp. 1951-1958. 12. Gallo, J. J., Anthony, J. C., & Muthén, B. (1994). Age differences in the symptoms of depression: a latent trait analysis. Journal of Gerontology: Psychological Sciences, 49, 251-264. 13. Grayson, D. A., Mackinnon, A., Jorm, A. F., Creasey, H., & Broe, G. A. (2000). Item bias in the center for epidemiologic studies depression scale: effects of physical disorders and disability in an elderly community sample. Journal of Gerontology: Psychological Sciences, 5, 273-282. 14. Satorra, A., & P. M. Bentler (1994). Corrections to test statistics and standard errors in covariance structure analysis. In A. von Eye & C. C. Clogg (Eds.), Latent variables analysis (pp. 399-419). Thousand Oaks, CA: Sage. 15. Bollen, Kenneth (1989). Structural equations with latent variables. New York, NY: John Wiley & Sons. 16. Browne, M. W., & Cudeck, R. (1993). Alternative ways of assessing model fit. In K. Bollen & J. S. Long (Eds.), Testing Structural Equation Models. Newbury Park, CA: Sage. 17. Hu, L., & Benter, P. M. (1999). Cutoff criteria for fit indexes in covariance structure analysis: Conventional criteria versus new alternatives. Structural Equation Modeling, 6, 1-55. 18. Bentler, P. M. (1990). Comparative fix indexes in structural models. PsychologicalBulletin, 107,238246. 19. Rigdon, E. E. (1996). CFI versus RMSEA: A comparison of two fit indexes for structural equation modeling. Structural Equation Modeling, 3, 369-379. 20. Cohen, J. (1988). Statistical power analysis for the behavioral sciences. Hillsdale, NJ: Erlbaum.