A Mixing Board Interface for Graphics and Visualization Applications Matthew Crider∗
Steven Bergner∗
Thomas N. Smyth∗
Torsten M¨oller∗
Melanie K. Tory♯
[email protected]
[email protected]
[email protected]
[email protected]
[email protected]
Arthur E.
Daniel
Kirkpatrick∗
[email protected]
[email protected] ∗ GrUVi
Lab
Weiskopf∗
♯ Department
Simon Fraser University Burnaby, BC V5A 1S6
A BSTRACT We use a haptically enhanced mixing board with a video projector as an interface to various data visualization tasks. We report results of an expert review with four participants, qualitatively evaluating the board for three different applications: dynamic queries (abstract task), parallel coordinates interface (multi-dimensional combinatorial search), and ExoVis (3D spatial navigation). Our investigation sought to determine the strengths of this physical input given its capability to facilitate bimanual interaction, constraint maintenance, tight coupling of input and output, and other features. Participants generally had little difficulty with the mappings of parameters to sliders. The graspable sliders apparently reduced the mental exertion needed to acquire control, allowing participants to attend more directly to understanding the visualization. Participants often designated specific roles for each hand, but only rarely moved both hands simultaneously. CR Categories: H.5.2 [Information Systems]: Information interfaces and presentation (e.g., HCI)—User Interfaces, Input devices and strategies (e.g., mouse, touchscreen); I.3.6 [Computing Methodologies]: Computer Graphics—Methodology and Techniques, Interaction techniques;
of Computer Science
University of Victoria Victoria, BC V8W 3P6
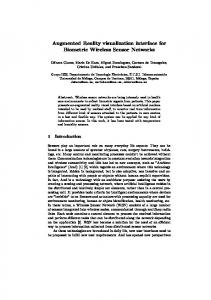
One drawback of many of these interfaces is the large screen space required for the graphical controls, which may reduce space available for the visualization. Another common drawback is the difficulty and time required to manipulate graphical parameter controls using mouse input. Although not difficult, these actions must take place frequently and efficiently in order to maintain users’ engagement. We investigate how physical controls, specifically an audio mixing board (an device that packs a large number of knobs and sliders in a fashion that is easily understood and well known to a large amount of people), can address the two challenges above and enhance the dynamic exploration process for visualization applications. The results of our expert review indicate that the physical nature of mixing board controls enhances user engagement and interaction efficiency. We also augment the physical controls with an overlaid digital display. This is achieved by using a projector casting dynamic labels and portions of the visualization output onto the surface of the mixing board as shown in Figure 1. This allows a large portion of the interface to be moved to the input device, providing a more direct mapping and freeing up screen space for other parts of the application.
Keywords: mixing board, interface devices, TUI, visualization, volume rendering, ExoVis, dynamic queries, parallel coordinates 1
I NTRODUCTION
The exploration of data in medical, engineering, or commercial applications often requires the manipulation of many parameters before a desired result appears, or before insight, understanding, and assurance of the phenomenon represented by the data is gained. Moreover, in many cases, the exploration process is more important than the final resulting images. Experimenting with a range of display options and queries may provide insight not possible with static images alone [17]. Interfaces to explore data through interactive manipulation of parameters have been designed for numerous applications. For example, Tory et al. [26] and Jankun-Kelly et al. [12] developed volume rendering interfaces that allow users to explore and compare parameters such as color and opacity transfer functions, viewing angle, zoom, and rendering method. Similarly, Ahlberg et al. [1] describe dynamic queries, a method to interactively explore multidimensional abstract data by dragging query sliders that filter information based on each dimension.
Figure 1: Physical setup: A Mac OS PowerPC with a 30-inch display, a Behringer BCF2000 mixing board, and a Canon Realis SX50 video projector. The parallel coordinates application is running, with the main window moved to the projector’s display area.
However, the mapping of parameters for data exploration to such a different interface can be quite challenging. Besides the technical issues of creating an API that properly maps the functionality of the mixing board to easy-to-use keystrokes or GUI interactions (see Section 3) we have to deal with the physical limits of the sliders and allocate functionality between the mixing board and graphical con-
trols operated by the keyboard and mouse. The board has several prima facie constraints, such as a fixed number of controls and a fixed spatial arrangement. These constraints can be offset a number of ways through software, for instance by allowing different modes which assign a subset of virtual controls to the physical controls at any point of time. In Sections 5, 6, and 7 we report case studies of using this interface for three visualization applications. The major contributions of our paper include: • We provide an open source API for the interaction of a haptic mixing board with visualization software. The API allows developers to easily add a multi-slider haptic interface (the relatively cheap Behringer BCF2000) to their application. • We present three case studies demonstrating several mappings of parameters to physical controls. • We investigate how physical controls affect the user’s exploration process and task engagement. This investigation is based on an expert review with four participants. 2
P REVIOUS W ORK
Strong arguments can be made for using specialized devices for computer input. Direct manipulation [20] has been well accepted as an efficient and easily-learned means of manipulating objects in graphical user interfaces. Users directly manipulate graphical objects by pointing, selecting, and dragging, taking advantage of natural human abilities to manipulate objects. Users of direct manipulation interfaces experience less anxiety, feel more in control, and become more engaged in their tasks [22]. Traditionally, direct manipulation has been implemented using a generic input device such as a mouse controlling graphic interface widgets. However, this can disrupt the user’s experience of direct manipulation. Common widget-based GUI applications require the user to first acquire the mouse, then move the mouse pointer to acquire a control widget, and then manipulate the widget by means of moving the mouse. Such interactions are much less direct than using specialized input devices. For example, scrolling a document using a mouse wheel feels more direct than manipulating a graphic scroll bar, because the scroll wheel is directly at hand and does not have to be explicitly acquired. In this way, generic input devices can break the flow of a user’s cognitive engagement with the task, negatively impacting performance [5]. Specialized input devices that match the control structure of the task may alleviate this problem. Specialized physical input devices have been shown to outperform equivalent graphical widgets for a variety of applications. For example, Fitzmaurice and Buxton [6] demonstrated that physical or “graspable” user interfaces with specialized shapes and dedicated functions were superior to a generic input device for a target tracking task. Graspable user interfaces essentially act as physical representations of objects in the scene. We distinguish this from our work, where the physical interfaces act as widgets to control various aspects of the scene, rather than direct physical representations of objects within the scene. Such control tasks have also been shown to benefit from physical interfaces. Hunt and Kirk [9] conducted an experiment comparing physical and virtual sliders for setting sound parameters. Participants achieved better results on a target sound matching task using physical sliders. Similarly, Chipman et al. [4] compared a physical slider, a graphical scrollbar, and the mouse wheel for two scrolling tasks. Both physical interfaces performed better than the graphical scrollbar, with the mouse wheel being superior for searching and the physical slider being superior for reciprocal tapping. We propose using an audio mixing board as an input device to control parameters in visualization tools. Physical sliders, buttons, and knobs on the mixing board are mapped to virtual controls in
the application. Mixing boards have long been used to control input and output signals in video and audio applications. However, to our knowledge, mixing boards have hardly been used to control parameter settings for visualization. Shahrokni et. al. [19] applied a force-feedback slider in visualizing laws of physics in an educational game. A few customized physical interfaces have been developed for spatial navigation in 3D visualization applications (e.g., Hinckley et al. [8] and Konieczny et al. [14]). Much less work has been done to examine physical interfaces for nonspatial controls. SeismoSpin [15], a custom physical input device for interacting with earthquake visualizations, was reported to be more engaging and interactive than traditional interfaces. In addition, Rheingans [16] reported using physical sliders to interactively control color mappings in a visualization tool, although the physical interface was not the focus of her work. Superiority of physical interfaces may be attributed to several factors. Acquiring a physical device may be faster than acquiring a graphic widget using the mouse [6]. Additionally, people may be able to use physical devices without removing their eyes from the screen, unlike graphic widgets which must be monitored by direct visual focus. Such non-visual interaction may promote better engagement with the task and more efficient performance. This process is enabled by proprioception (a person’s ability to sense relative positions of parts of their body) and passive haptic feedback (which allows a user to feel the position of an input device). Physical controls also enable two-handed input, which can be more efficient for at least two reasons: less hand movement is needed because the two hands are homed on different controls, and for some types of input, hands can be used simultaneously [3]. A long history of research into two-handed interaction has established effective ways to design two-handed interfaces. For example, Kabbash et al. [13] suggested that the two hands should be used in a dependent way, where the non-dominant hand sets up a frame of reference for precise action performed by the dominant hand. We do not suggest that our mixing board is an optimal two-handed interface, but we do suspect that the ability to use two hands instead of one may impart some benefit. Our design incorporates a digital display which is overlaid on the physical interface. Ware and Rose [29] demonstrated that colocating a physical input device with its graphic representation was beneficial for manipulation in virtual reality, suggesting potential for integrating physical input and graphic output. Physical/graphic integration for desktop applications has been previously reported by Swindells et al. [23]; however, they use different technology and do not focus on visualization parameter control. 3
S ETUP
Since the physicality of the input device is central to our studies, we begin with a system description. 3.1
Physical Setup
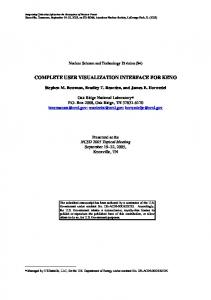
The system comprises a personal computer, a Behringer BCF2000 mixing board, and a Canon Realis SX50 video projector (see Figure 1). The API for our mixing board is platform independent, and can be set up for use on Macintosh, Linux, and Windows XP operating systems. Likewise, the projector has a variety of input ports allowing it to be used on virtually any system. We chose the Behringer mixer (see Figure 2) not only for its platform independence and standardized method of communication (generic MIDI messages), but also for its motorized sliders feature. This allows the applications to set the state of the board. Thus, the board can be initially synchronized with the application, before the exploration process begins. As the application changes its
We feel the applications chosen to integrate with the mixing board present a diverse subset of visualization applications. Of particular interest to us was the variety of interaction types with the three applications: visual filtering of information (a central step in visual exploration, exemplified in Shneiderman’s Visual Information Seeking Mantra [21]), exploration of a visualization parameter space, and spatial navigation. By selecting such varied interaction techniques, common in most visualization tasks, we sought to determine which approach is most suitable for mixing board interaction. 4.2
Figure 2: The Behringer BCF 2000.
state, for example when dynamic constraints apply to the parameters controlled by the sliders, the physical sliders can be updated immediately to reflect this change. Motorized control also supports some forms of haptic interaction, such as detents. 3.2
Software
The control software is based on the RtMidi [18] C++ class library. On top of these general MIDI input and output classes we wrote an API that controls the BCF 2000, using the Qt GUI framework for connecting the messages from the board to our software. Though the RtMidi code can be used with any GUI toolkit, we chose Qt for its platform independence and because it can easily be integrated in our existing visualization system, vuVolume [28], which was based on Qt. It should be noted that because our API communicates to the host computer with standard MIDI messages, the API can be easily extended to other mixing boards and MIDI devices, even ones that do not have the same features or layout as the BCF 2000. The API source code can be publicly downloaded through the vuVolume [28] repository. 4
M ETHOD OVERVIEW
4.1
Research Questions
With the encouraging research concerning physical user interfaces in mind, we wanted to examine the feasibility of such interfaces for visualization applications. The Behringer mixing board, specifically, seemed to provide a good instrument for such tasks as its motorized sliders allow implementation of slider detents and dynamic constraints between sliders. We considered the following questions: • Does the board encourage the user to try more possibilities within the parameter space? • Does the board’s force-feedback mechanism make the interaction more efficient and pleasing? • Does the user interact with the board bimanually? • Does the projection of an interface directly on the board enhance interaction? • How well does the physical interface of the mixer correspond to the existing graphical interface of the software?
Expert Review Protocol
As the input device we are testing has not been used in the context of visualization software, we choose to perform an expert review [25] to obtain first evaluation results. We present three case studies, demonstrating how the mixing board controls and the digital overlay can be used in different visualization applications. As an exploratory study, our focus is not to rigorously evaluate an isolated interaction technique, but to show different possible applications of the mixing board and how they work. We aim to get useful feedback on the use of the mixing board in the various applications, and if it is worth pursuing further work in the area. There were four unpaid participants: three graduate students from external research labs and one technical staff member from our lab at Simon Fraser University. All of the participants were male, and had a strong background in computer science. All three graduate students had experience using scientific visualization software, and were familiar with the terms used to explain volumetric visualization. Each participant looked at all three applications, spending approximately twenty minutes on each application. Participants were asked to think aloud, describing their use of the system and giving opinions on both negative or positive aspects of the interface. One or more observers continuously took notes and facilitated discussion by asking questions. These questions were either formulated before the study (i.e., task-based questions) or related to what the user found easy or difficult with the application. Each session was videotaped, and analysis was done on both the transcripts of the tapes and on notes taken during the sessions. 5
DYNAMIC Q UERIES S TUDY
The concept of dynamic queries was introduced by Ahlberg et al. [1] as a technique for the direct manipulation of databases. A dynamic query system allows the user to execute database queries using graphical controls, such as sliders and checkboxes, and displays the results of the query graphically in real time. For their initial evaluation of dynamic queries, Ahlberg et al. used a system built around the periodic table of the elements. Participants were asked to answer questions about various properties of the elements using either a type-in form or a set of slider widgets. Ahlberg et al. found that the slider interface supported substantially faster performance than the type-in form. 5.1
Our System
We were interested in the potential for a set of physical slider controls to support even better performance than graphical widgets. We developed a system similar to the one used by Ahlberg et al. The periodic table display consisted of 75 elements, each shown in red (if selected) or gray (if not selected). Elements were selected in response to a query over a set of four properties: atomic radius, ionic radius, ionization energy, and electronegativity. Users could specify a lower and upper bound for each property, and only elements with property values within all four ranges were shown in red. Property ranges were specified using eight slider controls, one each for the lower and upper bound of the four properties.
We implemented two different interfaces for our system: the graphical interface used a standard mouse, flat-panel display, and graphical sliders, while the physical interface used our augmented mixing board setup (see Figure 3). The mixing board was rotated 90 degrees counterclockwise from its typical orientation so that the periodic table could be displayed at the top of the board, and to allow horizontal labeling of each of the slider pairs. This projection emphasized the paired organization of the sliders, each manipulating a lower and upper bound of a variable. The slider motors were used to enforce the constraint that the value of the lower bound slider must always be less than or equal to that of the upper bound slider: if the user dragged a lower bound above an upper bound, the upper bound would automatically increase to stay at least as large as the lower bound. 5.2
Study Design
Participants were asked to answer questions about the periodic table. There were five types of questions: • Membership questions asked participants to find an element within a specific range of a single property (e.g. “Find an element with atomic radius between 28 and 33.”) • Comparative questions asked participants to compare two properties of a given element (e.g. “Does the element Cd have a higher atomic radius or ionic radius?”) • Window questions asked participants to find a window, or a range of a given maximum width for a given property, which contained a given minimum number of elements (e.g. “For ionic radius, find a window with a width no greater than 5 containing at least 20 elements.”) • Distribution questions asked participants to identify which third (lower, middle, or upper) of the total range of a given property contained the most elements. • Isolation questions specified a particular region of the table and asked participants to find a property setting which selected a given minimum number of elements in that region, with no elements selected elsewhere in the table (e.g. “Isolate at least 5 elements in column 8A.”) Each participant answered 2 randomly selected questions of each of the 5 types with each of the 2 interfaces, for a total of 20 questions. The order of the physical and graphical interfaces was counterbalanced. After they had answered all the questions, participants were interviewed about their experience. Participants were asked to identify i) the strengths and weaknesses of both interfaces, ii) which interface they thought allowed them to work faster, and iii) which was most enjoyable. 5.3
Results
The most consistently reported advantage of the physical interface, reported by all 4 participants, was the opportunity for moving multiple sliders at the same time. This advantage was particularly relevant to the window and distribution questions, for which property adjustments were most suitably made in pairs. One participant also reported that simultaneous movement was helpful for the comparative questions. Two participants reported that the physical interface allowed them to more easily maintain visual attention on the periodic table, instead of the slider controls. The main advantage reported for the graphical interface was its superior accuracy — three participants claimed that it was easier to select a specific property value using the mouse. Several participants made use of the arrow buttons at the ends of the graphical
sliders for fine tuning, and some also discovered that clicking along the length of the slider area adjusted the value in increments of 5. Both of these interaction techniques appeared to contribute to the reported benefit. Three participants felt that they performed faster overall with the physical interface, while the fourth reported no difference, except for the window questions, for which he felt the graphical interface was faster. Participants did not appear to be substantially faster with either interface when slider movements were infrequent and serial in nature. For example, comparing two properties of one element required only two slider movements, one after the other. Such tasks did not reveal faster performance. On the other hand, when slider movements were frequent or simultaneity could be exploited, the physical interface seemed to be faster for most participants. The most surprising result, as reported by two participants, was that their strategy for answering questions changed with the interface. One participant stated that the physical interface allowed him to “reason better about the problems”, and that it led to fewer redundant property adjustments. Another participant said that the graphical interface made him “think more” before performing a property adjustment, thus leading to less errors and making the task easier. Both participants seemed to suggest that the physical interface allowed more unrestricted exploration of the parameter space than the graphical interface, though the effect of that freedom seemed to be positive for one while negative for the other. 6
PARALLEL C OORDINATES I NTERFACE S TUDY
The parallel coordinates method [10, 30] is a useful technique for exploring high dimensional data. The idea of parallel coordinates was the basis of a general user interface created by Tory et al. [26] to explore volumetric visualizations by using five parameters: camera position, lighting, transfer function (color and opacity), choice of volume file, and type of rendering technique (see Figure 4 for a screenshot). Their interface displays a set of parallel vertical axes, with each axis representing a parameter type. On each axis lie discrete nodes that represent instances of that particular type of parameter. To connect these dimensions and visualize the data, a line segment is drawn from the first axis to each consecutive axis until a node on every axis is connected by a polyline. On top of their interface is a spreadsheet [12] function (see Figure 5) that allows the user to select two axes to be on either the vertical or horizontal plane of a spreadsheet-like graph, providing an overview of all visualizations created by the respective parameter combinations. There are numerous advantages to this type of interface, such as the ability to have a history of parameter settings that can easily be compared, and to easily adjust one parameter and have the system keep track of the rest. We ported the interface of Tory et. al. [26] to the mixing board to see if the sliders promoted a faster search of the space of values. We mapped the camera, lighting, and transfer function parameters onto their own sliders, allowing the user to adjust one parameter without affecting the others. This mapping to the mixing board is augmented by projecting images of the nodes directly onto the board (see Figure 6). Furthermore, the slider motors implemented “snap-to” detents, such that once a slider knob is far enough from the starting node and close enough to a neighbour, the knob will be pulled to the neighbour. This feature, which would be impossible with a non-motorized mixing board, emphasizes the discrete nature of the axes, and provides a visual and haptic cue of the number of nodes (e.g. shorter jumps signify more values). Whenever a parameter set is created, or a slider is moved, the resulting volume is immediately rendered in a separate window. This window also allows for the editing of parameters with the mouse. Once a new parameter value is created it is added to the respective axes in the user interface. Parameter editing in this window imme-
diately affects the visualization. Note that only saved parameters can be adjusted with the mixer — many parameters are complex and multidimensional, and are unsuited for mapping to the mixing board.
location. The volume used in this study is a CT scan of a human head. The scan has been modified to contain an abnormal object (a key) that users can easily recognize when located. 7.1
6.1
Study Design
Participants were asked to explore a CT scan of a human skull. They were asked to find the most aesthetically pleasing visualization, one which might be used as a representative image for a promotional poster. This task was chosen to encourage the user to explore the parameter space freely without explicit directions on what to do. They were first asked to perform the operation using the mixing board, then for comparative purposes to perform the same task using only the mouse. To minimize time spent on creating and fine-tuning parameters, we preset the values for the nodes so that participants could concentrate on exploring the parameter space. 6.2
Results
Initially, we felt that one of the board’s greatest strengths was its ability to support bimanual exploration. However, none of the users applied this technique. We found that each participant preferred (whether or not they were using the mixing board interface) to explore just one parameter type, and upon finding an acceptable value, proceeded to adjust another parameter type. The participants did not have difficulty mapping the discrete nodes of the parallel coordinates interface to the mixing board. The detents provided by the board’s motorized sliders, together with the projected display of the nodes on the mixing board, allowed the users to readily locate the nodes. Every participant stated that they appreciated these two features. Furthermore, due to the graspability of the sliders, participants reported not having to concentrate as much on interface elements and could instead focus on the volume itself. This permitted faster parameter exchanges than the traditional parallel coordinates interface. One user suggested that the mixing board was not sufficiently advantageous for the small amount of parameters we used as presets. However, the participant felt the addition of continuous interpolation would highlight the board’s strengths. Instead of moving automatically to the next node, every adjustment of a slider between a discrete set of nodes would result in a slight change of that parameter approaching the value of the next node, allowing the user to explore the range of values between two predetermined settings. A continuous interpolation of values is not part of the parallel coordinates interface [26] because, in general, an interpolation scheme does not necessarily exist. However, interpolation methods might be feasible for our specific choice of parameters, so that a continuous parallel coordinates interface could be investigated in future work. Another suggestion from one of our users was to implement more than one render window, each with its own constant parameter value (for example, three windows with three different perspectives), wherein the remaining parameters could be adjusted with the mixing board. This seemed to us to be an interesting addition of interactivity to the spreadsheet interface, which might be an attractive avenue to pursue. 7
E XOV IS S TUDY — S PATIAL N AVIGATION U SING 2D V IEWS IN 3D C ONTEXT
In this study we applied the mixing board to a spatial navigation task, positioning a cursor within a 3D volume. We implemented ExoVis [24], a display integrating 2D slice views with a 3D view of a spatial object, into vuVolume [28], an open source volume visualization system. Figure 8 shows our implementation of ExoVis. Each 2D view presents a slice of the volume at the current cursor
Procedure
The cursor location on each of the three principal axes (x, y, z) was mapped to three sliders. Motivation for this mapping is described in Atkins et. al. [2] who found frequent scrolling through one dimension greatly helped users in creating a mental model of 3D medical images. The range of a slider was mapped to the full extent of the bounding box of the volume, such that moving a slider from its bottom most position to the top amounted to a full sweep through the volume. The rendition was updated at a rate of about 25 frames per second, allowing for smooth continuous interaction. The user could manipulate several axes simultaneously, by moving multiple sliders. The axis that changed most recently was highlighted. We asked participants to perform four tasks with the system: • Determine what this dataset shows. (Solution: A scan of a human head.) • Determine what is special about it. (Solution: There is a key inside this head.) • Place the cursor at the abnormality. (Solution shown in Figure 8). • Place the cursor at the right ear lobe (Solution shown in Figure 7). In the course of the tasks the users were also allowed to rotate the volume by using the mouse. This could be done by clicking into the rendering area and dragging the mouse, resulting in a smooth gradual rotation around an axis through the center of the volume orthogonal to the path the mouse pointer would take. 7.2
Results
Participants found the interface generally easy to use. None of the participants needed much introduction to the system. All participants moved each slider slowly and individually. All participants associated each slider to its controlled axis through micro manipulations — touching the slider and observing which screen axis was affected. Due to the immediate feedback and the relatively small number of spatial dimensions (3) this was typically done in a short amount of time (1–5 seconds). One participant stated this procedure of observing what would happen when the hand was moving into a certain direction was analogous to cutting one’s own hair in the mirror — a difficult task that has to be relearned for each new activity. However, since moving a slider is more constrained than moving a hand in free space the effect of a mixer slider is more controllable. One proposal to allow for more permanent learning of axis-slider association is to keep the axes aligned to the screen, so each slider adjusts each axis the same way regardless of the volume’s position. Using the projector to label the sliders with their corresponding axis would be another way of helping the user habituate. All participants pointed out that it was convenient to not have to look at the sliders while performing the manipulation. For some this also included the selection of which axis to manipulate, as the three adjacent sliders were easy to distinguish by feel. Eyes-free operation is unique to this task, because the volume was displayed on a separate screen rather than the mixer surface. All participants quickly switched between different sliders when making their adjustments. The separation of the three spatial dimensions onto three separate sliders was not perceived as a problem by any of the participants.
This is a curious point, especially considering work by Jacob et al. [11] arguing that the control structure of the input device should match the perceptual structure of the task. Three-dimensional navigation has three integral dimensions. However, the ExoVis approach presents separate slices for each spatial axis. This may help to visually decompose the task of 3D navigation into 3 separate decisions, which are then mapped onto three separate sliders. It seems worthwhile to further investigate this aspect, possibly by comparing it with true three dimensional input devices, such as a 3D tracker or a phantom haptic interface. One participant felt that, in contrast to manipulating the more abstract space of the periodic table, the mixer sliders were particularly suited to ExoVis since grabbing a slider and moving it through space felt like moving a slice through the spatial data set. This also reflects a unique aspect of this application, the mapping of continuous slider movement to a continuous change on the screen. None of the participants used the mouse and slider simultaneously. The mouse was used for camera adjustment about 3–5 times in the course of each of the placement tasks, mainly to get a clear view onto a slice or along an axis for fine tuning. Two participants dedicated a specific hand to each device (left for the mouse, right for the sliders) and appreciated the convenience of not having to move one hand from one control to the other. One participant thought it would have been nice to integrate even more parameters for adjustment with the mixing board, such as for rotating the volume, or adjusting the size and opacity of the slicing plane. This suggests that users may be comfortable controlling even more parameters than the three navigation axes provided in this application. Another suggested a combined navigation method, using the mouse for the rough placement and the sliders for fine adjustment. This remark suggests that the mixing board navigation felt more controllable than the mouse and might be especially suited to precise navigation. Some participants criticized the visibility of the semi-transparent slices against the volume. A viable alternative to displaying the slices with the volume is to instead show them in a separate window, though this may cause difficulty in perceptually integrating each slice with its respective axis. These are aspects previously studied in detail [27] and their integration into our mixer based interaction is considered for future work. 8
D ISCUSSION
The expert review highlighted three important outcomes. First, all of the studies demonstrated the mixing board’s capability of allowing the the user to remain focused on the object of interest, without distraction by the control. Because the sliders are graspable, users can exploit their proprioceptive memory and spatial reasoning skills [7] to manipulate the control. This may have freed the users’ attention for a more important perceptual task, understanding the visualization. This informal observation of a relationship between graspability and attention would need further, more detailed study to be confirmed. Second, the use of multiple sliders and both hands varied widely with the application. For dynamic queries, all participants used both hands and at times adjusted multiple sliders simultaneously. In the parallel coordinates study, all activity was unimanual and sequential. In the ExoVis study, two participants controlled the camera position of the volume using the mouse in their left hand, and controlled slicing planes with the mixing board in their right hand. However, in this case the use was sequential. The choice between sequential and simultaneous control is a complex tradeoff. It depends in part on the similarity of the action performed by each hand. For example, in touch-typing, the two hands each perform a similar task. Many people can do this efficiently, and speed increases greatly with practice. On the other
hand, most people have difficulty with rubbing their stomach and patting their head, because it requires independent performance of two different tasks. This is likely the reason why participants who used the Exovis interface bimanually nonetheless moved the mouse and slider sequentially. A second factor forcing sequential use of controls is dependency between them. Participants cited this as a reason why they moved the parallel coordinates controls sequentially: such dissimilar parameters had to be adjusted serially. We note, however, that for a continuous compound selection and positioning task Buxton and Myers [3] found that simultaneous bimanual interaction was in fact possible and faster, despite the somewhat different activities for each hand. Although our task is more complex, with three dimensions of selection and positioning rather than one, Buxton and Myers’s result suggests the possibility that users of our system may have been able to use simultaneous bimanual control with additional practice. The performance implications of bimanual and simultaneous use of controls varies. Serial bimanual interaction offers increased speed from having the hands remain on the “home control”, while simultaneous interaction offers increased efficiency through parallel use of the controls. But simultaneous control only has an appreciable impact for tasks where a large proportion of time is spent adjusting controls. This was true for some dynamic query tasks but not others. For the parallel coordinates task, no big gains were possible, as moving the slider, even serially, is only slightly quicker than drawing lines in parallel coordinates. The third important outcome was that the mixing board was able to adequately map the graphical interface to the physical. Dynamic queries and parallel coordinates, in particular, were easily mapped to the mixing board, as the former application uses sliders as its controls, and the latter’s discrete parameters could easily be interpreted to lie on a sliding axis. The tight coupling of input and output, achieved through the projector, greatly increased the ability to distinguish the effect of adjusting sliders. Furthermore, constraint maintenance, achieved through the motorized sliders, was able to emulate the discrete nature of parallel coordinates and the restriction on possible values in dynamic queries. ExoVis provided the only difficult mapping, as each slider operates in the same direction, whereas the slicing planes moved in three orthogonal directions. Also, the crosshairs were locked to the orientation of the volume, so that after a 180 degree rotation of the volume predicting the effects of the physical sliders required a mental rotation. Our participants avoided this rotation, easily discerning every slider’s parameter by quick, minor adjustments. 9
C ONCLUSION AND F UTURE W ORK
The results of our expert review with four participants can be summarized as follows: (1) the way the mixing board is used for data exploration largely depends on the specific visualization application; (2) the video projection onto the mixing board enhances tasks that spatially combine the visualization and the interface (e.g. the dynamic query application); (3) the mixing board seems to facilitate the exploration of a wider parameter space (as reported by two participants for dynamic queries); (4) the haptic detents appear to be useful for discretized parameters (e.g. in the parallel coordinates interface); (5) the graspability of the controls seems to lead to more efficient user interaction when the controls are moved frequently (e.g. in dynamic queries). Although the mixing board supports bimanual interaction, we found participants primarily used it for sequential rather than simultaneous bimanual interaction. A mixing board with motorized sliders has proven versatile, making it a promising interaction device for a variety of visualization applications. For example, the mixing board can be used for discrete and continuous parameters alike. Haptic detents are particularly useful for discrete parameters. The video projection of
displayed elements onto the board also provides a customizable interface. Therefore, we think that the three tested applications are only a small subset of interesting visualization tasks that could benefit from the mixing board. Our expert review brought up some ideas worth pursuing in future implementations of the mixing board for data exploration. The expert review provides a basis for a formal user study that could measure task performance: dynamic queries showed signs of being the most promising application for such a user study because the queries are clearly specified tasks. On a more qualitative level, we have learned how the ExoVis and parallel coordinates application could be further investigated and improved. For example, the parallel coordinates interface could benefit from a continuous interpolation between the discrete parameters or from a merging of spreadsheets and slider interactions in a coordinated-views interface with several windows. In the ExoVis application, it would be useful to compare physical sliders to graphical sliders for moving a slice through a volume to see the evolution of the slice — an interaction technique radiologists call “cine mode”. Finally, additional visualization applications could be investigated in the context of the mixing-board interface. A basic question remains unsolved and needs further attention: to which degree and in which applications is bimanual interaction facilitated by the mixing board? We anticipate that the use of bimanual interaction largely depends on the details of the exploration task, which could be addressed in future studies. 10
ACKNOWLEDGEMENTS
We thank Brendan Moloney for providing us with his implementation of a GPU accelerated parallel volume renderer. Funding for this research was provided by the National Science and Engineering Research Council and the Canada Foundation for Innovation. R EFERENCES [1] C. Ahlberg, C. Williamson, and B. Shneiderman. Dynamic queries for information exploration: an implementation and evaluation. In CHI ’92: Proceedings of the SIGCHI conference on Human factors in computing systems, pages 619–626, New York, NY, 1992. ACM Press. [2] M. Atkins, A. Knight, A. Kirkpatrick, and B. Forster. Evaluating user interfaces for stack mode viewing. In Proceedings of the SPIEMedical Imaging 2007, volume 6515, 2007. [3] W. Buxton and B. Myers. A study in two-handed input. In CHI ’86: Proceedings of the SIGCHI conference on Human factors in computing systems, pages 321–326, New York, NY, 1986. ACM Press. [4] L. E. Chipman, B. B. Bederson, and J. A. Golbeck. Slidebar: analysis of a linear input device. Behaviour and Information Technology, 23(1):1–9, 2004. [5] S. Faisal, P. Cairns, and B. Craft. Infoviz experience enhancement through mediated interaction. In ICMI’05 Workshop on Multimodal Interaction for the Visualisation and Exploration of Scientific Data, pages 3–9, September 2005. [6] G. W. Fitzmaurice and W. Buxton. An empirical evaluation of graspable user interfaces: towards specialized, space-multiplexed input. In CHI ’97: Proceedings of the SIGCHI conference on Human factors in computing systems, pages 43–50, New York, NY, 1997. ACM Press. [7] G. W. Fitzmaurice, H. Ishii, and W. A. S. Buxton. Bricks: laying the foundations for graspable user interfaces. In CHI ’95: Proceedings of the SIGCHI conference on Human factors in computing systems, pages 442–449, New York, NY, 1995. ACM Press/Addison-Wesley Publishing Co. [8] K. Hinckley, R. Pausch, J. C. Goble, and N. F. Kassell. Passive realworld interface props for neurosurgical visualization. In CHI ’94: Proceedings of the SIGCHI conference on Human factors in computing systems, pages 452–458, New York, NY, 1994. ACM Press.
[9] A. Hunt and R. Kirk. Radical user interfaces for real-time control. In EUROMICRO, pages 2006–2012. IEEE Computer Society, 1999. [10] A. Inselberg and B. Dimsdale. Parallel coordinates: a tool for visualizing multi-dimensional geometry. In VIS ’90: Proceedings of the 1st conference on Visualization ’90, pages 361–378, Los Alamitos, California, 1990. IEEE Computer Society Press. [11] R. J. K. Jacob, L. E. Sibert, D. C. McFarlane, and J. M. Preston Mullen. Integrality and separability of input devices. ACM Transactions on Computer-Human Interaction, 1(1):3–26, 1994. [12] T. Jankun-Kelly and K.-L. Ma. Visualization exploration and encapsulation via a spreadsheet-like interface. IEEE Transactions on Visualization and Computer Graphics, 7(3):275–287, 2001. [13] P. Kabbash, W. Buxton, and A. Sellen. Two-handed input in a compound task. In CHI ’94: Proceedings of the SIGCHI conference on Human factors in computing systems, pages 417–423, New York, NY, 1994. ACM Press. [14] J. Konieczny, C. Shimizu, G. W. Meyer, and D. Colucci. A handheld flexible display system. In VIS ’05: Proceedings of the 16th Conference on Visualization ’05, page 75, Minneapolis, Minnesota, 2005. IEEE Computer Society Press. [15] M. McKelvin, R. Nestande, L. Valdez, K.-P. Yee, M. Back, and S. Harrison. Seismospin: a physical instrument for digital data. In CHI ’03: CHI ’03 extended abstracts on Human factors in computing systems, pages 832–833, New York, NY, 2003. ACM Press. [16] P. Rheingans. Color, change, and control for quantitative data display. In VIS ’92: Proceedings of the 3rd conference on Visualization ’92, pages 252–259, Los Alamitos, CA, 1992. IEEE Computer Society Press. [17] P. Rheingans. Are we there yet? Exploring with dynamic visualization. IEEE Computer Graphics and Applications, 22(1):6–10, Jan/Feb 2002. [18] G. Scavone. The RtMidi Tutorial. http://www.music.mcgill. ca/∼gary/rtmidi/, 2006. [19] A. Shahrokni, J. Jenaro, T. Gustafsson, A. Vinnberg, J. Sandsjo, and M. Fjeld. One-dimensional force feedback slider: going from an analogue to a digital platform. In NordiCHI ’06: Proceedings of the 4th Nordic conference on Human-computer interaction, pages 453–456, New York, NY, 2006. ACM Press. [20] B. Shneiderman. Direct manipulation: A step beyond programming languages, pages 461–467. Morgan Kaufmann Publishers Inc., San Francisco, CA, 1987. [21] B. Shneiderman. The eyes have it: A task by data type taxonomy for information visualization. In Proceedings of 1996 IEEE Symposium on Visual Languages, pages 336–343, Boulder, CO, 1996. [22] B. Shneiderman. Direct manipulation for comprehensible, predictable and controllable user interfaces. In IUI ’97: Proceedings of the 2nd international conference on Intelligent user interfaces, pages 33–39, New York, NY, 1997. ACM Press. [23] C. Swindells, M. J. Enriquez, K. E. MacLean, and K. S. Booth. Colocating haptic and graphic feedback in manual controls. Technical Report TR-2005-28, University of British Columbia, Computer Science, 2005. [24] M. Tory, A. E. Kirkpatrick, M. S. Atkins, and T. M¨oller. Visualization task performance with 2D, 3D, and combination displays. IEEE Transactions on Visualization and Computer Graphics, 12(1):2–13, Jan./Feb. 2006. [25] M. Tory and T. M¨oller. Evaluating visualizations: Do expert reviews work? IEEE Computer Graphics and Applications, 25(5):8–11, 2005. [26] M. Tory, S. Potts, and T. M¨oller. A parallel coordinates style interface for exploratory volume visualization. IEEE Transactions on Visualization and Computer Graphics, 11(1):71–80, 2005. [27] M. K. Tory. Combining 2D and 3D views for visualization of spatial data. PhD thesis, Simon Fraser University, Computer Science, 2004. [28] vuVolume – an Open Source toolkit for volume visualization. http: //sourceforge.net/projects/vuvolume, 2006. [29] C. Ware and J. Rose. Rotating virtual objects with real handles. ACM Transactions on Computer-Human Interaction, 6:162–180, 1999. [30] E. J. Wegman. Hyperdimensional data analysis using parallel coordinates. Journal of the American Statistical Association, 85(411):664– 675, Sept. 1990.
Figure 3: The physical interface for the periodic table. At the top the periodic table is projected, with currently selected elements in red. The sliders are below, with a projected overlay showing the controlled parameters and their current values. For example, the bottom two sliders have set the lower bound of electronegativity to 14 and its upper bound to 49.
Figure 4: The parallel coordinates interface. Shown on the left are the axes which we mapped to the mixing board. On the right is a history of rendered images.
Figure 5: The spreadsheet function. The two axes of the spreadsheet represent the two axes selected in parallel coordinates. All other parameters, depicted on the left side of the window, remain constant.
Figure 6: The physical interface for our parallel coordinates application. Shown are the three variable parameters: camera position, lighting, and transfer function.
Figure 7: ExoVis system showing the solution to the task of locating the cursor at the right ear lobe.
Figure 8: ExoVis system showing the solution to our key task. The 3D cursor is navigated using three sliders on the mixing board. The visualization shows the position of the cursor by displaying a 3D cross hair. Transversal, sagittal, and medial slices are displayed outside of the volume, parallel to their original locations.