NASA/TM—2014-218118
AIAA–2014–0719
A Mode Propagation Database Suitable for Code Validation Utilizing the NASA Glenn Advanced Noise Control Fan and Artificial Sources
Daniel L. Sutliff Glenn Research Center, Cleveland, Ohio
April 2014
NASA STI Program . . . in Profile
Since its founding, NASA has been dedicated to the advancement of aeronautics and space science. The NASA Scientific and Technical Information (STI) program plays a key part in helping NASA maintain this important role. The NASA STI Program operates under the auspices of the Agency Chief Information Officer. It collects, organizes, provides for archiving, and disseminates NASA’s STI. The NASA STI program provides access to the NASA Aeronautics and Space Database and its public interface, the NASA Technical Reports Server, thus providing one of the largest collections of aeronautical and space science STI in the world. Results are published in both non-NASA channels and by NASA in the NASA STI Report Series, which includes the following report types: • TECHNICAL PUBLICATION. Reports of completed research or a major significant phase of research that present the results of NASA programs and include extensive data or theoretical analysis. Includes compilations of significant scientific and technical data and information deemed to be of continuing reference value. NASA counterpart of peer-reviewed formal professional papers but has less stringent limitations on manuscript length and extent of graphic presentations. • TECHNICAL MEMORANDUM. Scientific and technical findings that are preliminary or of specialized interest, e.g., quick release reports, working papers, and bibliographies that contain minimal annotation. Does not contain extensive analysis. • CONTRACTOR REPORT. Scientific and technical findings by NASA-sponsored contractors and grantees.
•
•
•
CONFERENCE PUBLICATION. Collected papers from scientific and technical conferences, symposia, seminars, or other meetings sponsored or cosponsored by NASA. SPECIAL PUBLICATION. Scientific, technical, or historical information from NASA programs, projects, and missions, often concerned with subjects having substantial public interest. TECHNICAL TRANSLATION. Englishlanguage translations of foreign scientific and technical material pertinent to NASA’s mission.
Specialized services also include creating custom thesauri, building customized databases, organizing and publishing research results. For more information about the NASA STI program, see the following: • • • • •
Access the NASA STI program home page at http://www.sti.nasa.gov E-mail your question to
[email protected] Fax your question to the NASA STI Information Desk at 443–757–5803 Phone the NASA STI Information Desk at 443–757–5802 Write to: STI Information Desk NASA Center for AeroSpace Information 7115 Standard Drive Hanover, MD 21076–1320
NASA/TM—2014-218118
AIAA–2014–0719
A Mode Propagation Database Suitable for Code Validation Utilizing the NASA Glenn Advanced Noise Control Fan and Artificial Sources
Daniel L. Sutliff Glenn Research Center, Cleveland, Ohio
Prepared for SciTech 2014 sponsored by the American Institute of Aeronautics and Astronautics National Harbor, Maryland, January 13–17, 2014
National Aeronautics and Space Administration Glenn Research Center Cleveland, Ohio 44135
April 2014
Acknowledgments
The author would like to acknowledge the efforts of D. Podboy, L. Smith, R. Loew, B. Groening, E. Mysliwiec, and J. Mirecki of TFOME for their support in model assembly and testing. This work was supported by the Fundamental Aeronautics, Subsonic Fixed Wing Project.
Trade names and trademarks are used in this report for identification only. Their usage does not constitute an official endorsement, either expressed or implied, by the National Aeronautics and Space Administration.
This work was sponsored by the Fundamental Aeronautics Program at the NASA Glenn Research Center.
Level of Review: This material has been technically reviewed by technical management.
Available from NASA Center for Aerospace Information 7115 Standard Drive Hanover, MD 21076–1320
National Technical Information Service 5301 Shawnee Road Alexandria, VA 22312
Available electronically at http://www.sti.nasa.gov
A Mode Propagation Database Suitable for Code Validation Utilizing the NASA Glenn Advanced Noise Control Fan and Artificial Sources Daniel L. Sutliff National Aeronautics and Space Administration Glenn Research Center Cleveland, Ohio 44135
Abstract The NASA Glenn Research Center’s Advanced Noise Control Fan (ANCF) was developed in the early 1990s to provide a convenient test bed to measure and understand fan-generated acoustics, duct propagation, and radiation to the farfield. A series of tests were performed primarily for the use of code validation and tool validation. Rotating Rake mode measurements were acquired for parametric sets of: (i) mode blockage, (ii) liner insertion loss, (iii) short ducts, and (iv) mode reflection.
1.0
Introduction
The NASA Glenn Research Center (GRC) has been involved in several programs (Advanced Subsonic Technology, Quiet Aircraft Technology, and the Fundamental Aeronautics Subsonic Fixed Wing) whose goals were the reduction in transport aircraft noise attributed to the turbofan engine. A component of turbofan noise (Ref. 1) is the fan noise caused by rotor-stator, and other interactions, coupled to duct propagation that radiates to the farfield. Computational aero-acoustic (CAA) codes and unique measurement tools are required to enable the development of noise reduction technologies. In order to validate these codes and tools, it is necessary to have an acoustic database. Parametric studies were performed for several conceptual representations: (i) mode blockage due to stator vanes or rotor blades, (ii) liner insertion loss, (iii) the effects of short ducts on radiation, and (iv) mode reflection due to duct terminations. The intent is not to document specific cases as relevant to a modern turbofan but to provide a database for code validation. Nor will a significant portion of the data be presented, but rather limited samples. The database was acquired on the Advanced Noise Control Fan (Refs. 2 and 3) (ANCF) test bed that was built in the early 1990s (Refs. 4 and 5) to evaluate noise reduction concepts and to provide databases for CAA code validation. Figure 1 shows the Aero-Acoustic Propulsion Laboratory where the ANCF is located and Figure 2 is a photo of the ANCF. A Configurable Fan Artificial Noise System (CFANS) was utilized to generate and control circumferential modes (m). The system consists of four axially distributed rows, each with 16 circumferentially distributed sets of electromagnetic drivers flush mounted on the inner wall. There are two spool pieces, each having two driver rows (see Figure 3). A LabVIEW (National Instruments Corporation) program is used to generate the waveforms sent to each driver independently, in the proper phase relationship to generate the desired circumferential mode. The signals to each row can be adjusted globally to effect the radial distribution, if desired. The practical limits of the system are |m-order| ≤ 7, and frequency ≤ 1500 Hz. Figure 4 shows the typical high quality output from the CFANS for a sample case where mode m = 2 was the target mode generated. The upper row of 3-D “tombstone” plots is at 480 Hz (equivalent to BPF on ANCF) and the lower row is for 960 Hz (equivalent to 2BPF). The two columns represent data from two different builds (limited teardown and reassembly, about one month apart) for a limited repeatability demonstration. The target mode is at least 20 dB above any other individual mode, and mostly 10 dB above the sum of all other extraneous modes. This is shown in the small bar graph above and to the right of the 3-D plot. The repeatability (admittedly limited) is within a decibel. Table I provides the modes generated and their cut-off ratios for several hub-to-tip ratios
NASA/TM—2014-218118
1
(σ) inside the duct, for the studies documented in this paper. The modes were measured by the Rotating Rake mode measurement system mounted at the duct radiation plane. The Rotating Rake (Ref. 6) system was developed and implemented by GRC in the 1990s to measure turbofan duct acoustic modes. The system is a continuously rotating radial microphone rake that is inserted into the duct. It provides a complete map of the acoustic duct modes present in a ducted fan. The schematics call out the location of the rotating rake measurement location(s), generally at the duct inlet or exit planes. Figure 5 shows the propagation angles that are referenced in the relevant sections.
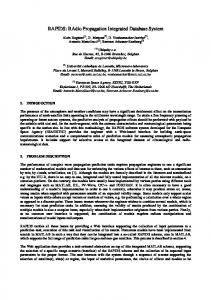
Figure 1.—Aero-Acoustic Propulsion Laboratory
Figure 2.—Advanced Noise Control Fan
Figure 3.—Schematic of Configurable Fan Artificial Noise System
NASA/TM—2014-218118
2
TOT—Total Power in Harmonic (all modes) R/S—Power in Rotor/Stator Interaction Mode OTH—Power in other modes (non-R/S modes) Figure 4.—Sample Output of Configurable Fan Artificial Noise System
Frequency (Hz) 480 “”
TABLE I.—MODES GENERATED FOR PARAMETRIC STUDIES USING CFANS Cut-off ratios (σ, hub-to-tip ratio) Modes Inlet R/S (σ = 0.0) (σ = 0.375) 1.77 1.89 ±(2,0) 1.02 1.03 ±(4,0)
580 600 700 880
+(2,0) +(2,0)/(2,1) +(2,0)/(2,1) +(2,0)/(2,1)/(2,2)
2.14 2.21/1.01 2.58/1.17 3.24/1.48/0.99
960 “” “”
±(2,0)/(2,1)/(2,2) ±(4,0)/(4,1) ±(6,0)
3.54/1.61/1.08 2.03/1.16 1.44
NASA/TM—2014-218118
3
3.79/1.72/1.02 2.06/1.22 1.45
Exhaust (σ = 0.5) 2.01 1.04
4.03/1.53/2.09/1.22 1.45
Figure 5.—Schematic of ANCF in Blockage Configurations
2.0
Mode Blockage
2.1
Setup
The objective of this portion of the test was to obtain the effect of geometrical obstructions on mode propagation, i.e., blockage (or transmission loss). Blockage effects were measured separately for stationary geometry (stator vanes) or for rotating geometry (fan blades). In order to provide a larger database, and taking advantage of the flexibility inherent in a no-flow condition, the existing ANCF stator vanes were pitched at a range of angles. Geometry of fixed 3-D surfaces prevented pitching the stator vanes a full 90°, therefore the tip gap was increased to allow for this rotation. The center-body was retained, creating a transition from σ = 0 at the inlet to σ = 0.5 at the exhaust exit plane. These configurations are shown schematically in Figure 6 and pictorially in Figure 7. The baseline case was a clean duct, with no stator vanes or fan blades. A parametric set of modes (Table I) were generated at either the forward or aft driver set, and measured by the opposite rotating rake. That is: modes generated by the forward driver set were measured by the exhaust rake; modes generated by the aft driver set were measured by the inlet rake. Fourteen or 28 stator vanes were installed at various pitch angles (Table II) and the rake mode measurements repeated. Separately, the rotor blades were installed at three different pitch angles. The nominal pitch angle for ANCF is 28° and that configuration was run at three different fan speeds. The fan pitch angle was changed by ±10° and run at a single fan speed for those two angles. The assumption is made that the source does not change so that the blockage can be computed by subtracting the mode PWL measured with stators installed from the mode PWL measured in the clean configuration (either with flow or without flow). The configurations were tested over a period of several weeks whereby the ambient temperature varied by 10 °F. The mode frequencies generated were at constant frequency, corrected to standard day (59 °F). Note that this is standard for duct propagation, but does not take into account any changes in the driver response due to changes in actual driver frequency.
2.2
Results
The blockage is defined as the mode amplitude measured by the rotating rake with the duct in the clean configuration minus the mode amplitude measured with the desired blockage installed between the source and the rake. Thus, a positive number indicates the mode amplitude has been reduced due to blockage. Figure 8 shows the results for mode blockage at various stator vane configurations for modes at 480 and 960 Hz. The blockage for the forward propagating direction (generated by the aft drivers, propagation through the obstruction, and measured by the inlet rake) is shown in Figure 8(a) (480 Hz) and Figure 8(b) (960 Hz).
NASA/TM—2014-218118
4
Modes generated by driver spools are measured at opposite rake. Assumption is source does not change with the insertion of blockage or the addition of flow.
(a) Clean Duct
(b) Stationary Blockage
(c) Rotating Blockage Figure 6.—Schematic of ANCF in Blockage Configurations
NASA/TM—2014-218118
5
TABLE II.—BLOCKAGE CONFIGURATIONS TESTED (a) Stator vane configurations 14 vanes 28 vanes -------------------------α=20° α=45° α=45° α = 45° ~ δ = 1.63 in. α = 45° ~ δ = 1.63in. -------------------------α = 90° ~ δ = 1.63 in. Designation: Pitch Angle (α) ~ tip gap (δ)
(b) Fan blade configurations θ = 18° (1800 Ω) θ = 28° (0, 900, 1800 Ω) θ = 38° (900 Ω)
(a) Clean Duct Configuration
(b) 28 Vane—45° Pitch Configuration
Figure 7.—Photos of ANCF in Mode Blockage Configurations
Figure 8.—Circumferential Mode Blockage Levels from Stator Vanes
NASA/TM—2014-218118
6
Figure 9.—Circumferential Mode Blockage Levels from Rotor Vanes
The case labeled clean is actually the difference between two clean cases several weeks apart. As such it can provide an estimate of the significance for a measured blockage value. This number is about ±1 dB. Anything less than that cannot be assumed to be a result relevant to blockage. Little blockage is seen at low m-orders in either direction. These modes’ circumferential propagation angles are relatively low as a result of their higher cut-off ratio. The higher order circumferential modes (four at 480 Hz, six at 960 Hz) are significantly blocked as a result of their higher circumferential propagation angles (Ψθ)—see Figure 5(a). The stator vane count is seen to increase the mode blockage levels. Thus, it appears as if projected area is the biggest influence on blockage levels under these conditions. Blockage levels obtained with the rotor (alone) at various rotor RPM (Ω) and pitch angles (α) are shown in Figure 9.
3.0
Liner Evaluation
3.1
Set-Up
Figure 10 shows the schematic of the ANCF configuration for the evaluation of insertion loss due to a liner. The liner used was a single-degree-of-freedom (SDOF) liner with a screen mesh on a 34 percentopen-area (POA). The normalized design resistance for the liner is 1.7ρc. The liner core depth is 0.85 in.; resonance frequency is 3221 Hz. The rotating rake ring was installed in one of two locations: upstream (Figure 10(a)) of the liner to measure the modal PWL at the entrance, and downstream (Figure 10(b)) of the liner to measure the modal PWL at the liner exit. Comparing the two results in liner insertion loss (positive number indicates attenuation). These rake configurations were tested for both the liner exposed and taped over (to provide a hard-wall baseline).
3.2
Results
Figure 11 shows the mode PWLs measured at the entrance and the exit for the hard-wall and the liner. Figure 11(a) shows that at BPF the insertion loss is minor—not surprising as this frequency was not the
NASA/TM—2014-218118
7
design frequency. Note that in general the comparison of the mode strength at the entrance to the HW is comparable to the mode strength at the entrance of the liner. An exception is that mode 4 HW to SW entrance comparison shows a huge variation in PWL. This is thought to be due to being close to cut-off and being more susceptible to reflections. Figure 11(b) shows the insertion loss at 960 Hz, near the target design of the liner. The attenuation is much greater, and increases as the mode number increases. This is expected as the higher mode numbers have lower cut-off ratios—it is generally accepted that liners are more effective at cut-off ratios near unity (Ref. 7) since the mode angle is propagating into the liner (see Figure 5(b)).
(a) Entrance Measurement Plane
(b) Exit Measurement Plane Figure 10.—Schematic of Liner Configurations Tested
NASA/TM—2014-218118
8
(a) 480 Hz
(b) 960 Hz Figure 11.—Liner Configurations Results
4.0
Short-Duct Effects
Duct mode propagation theory assumes a long duct as defined by the Length to Diameter ratio (L/D > 1) in order for the classic mode structure to develop along the predicted analytical forms. In reality, even a cut-off mode can be said to “propagate” from the source, albeit at a significant decay rate. Modes that are well below cut-on may decay at a rate of 80 to 100 dB per duct diameter, while a mode just below cut-on may decay at a rate of only 2 to 3 dB per diameter (Ref. 8).
4.1
Set-Up
To investigate this effect, the ANCF/CFANS was tested in two duct lengths, with the actuated driver row 1 diameter from the duct exit, and 1/4–diameter from the duct exit (Figure 12). The modes were measured at the inlet entrance plane. The duct exit was filled with absorptive material to prevent reflections as well as farfield contamination from duct aft radiation. For this portion of the test, corresponding far-field directivity data were acquired. The farfield array was kept at a constant distance from duct inlet entrance plane.
4.2
Results
Typical in-duct mode results for the two duct lengths are shown in Figure 13. The generated mode was m = +2 or m = –2. Figure 13(a) shows the modal decomposition. For the long duct all of the “extraneous” modes have decayed to the measurement floor ~ 75 to 80 dB. The modes in the short duct configuration have not decayed, nearly equal in strength to the target mode. Figure 13(b) illustrates this by comparing the total PWL in all modes, PWL in the generated mode, and the sum of the non-target mode. For the long duct the majority of the power is in the target mode, for the short duct the extraneous modes carry more energy. The effect in the far-field indicates that the modes measured at the inlet plane do in fact propagate to the farfield. Figure 14 shows the tonal directivity for m = ±2. The long duct directivity shows the characteristic flat lobe associated with a well cut-on mode. Note the symmetry between the positive and negative mode. The pattern radiated from the short duct shows significant departure from the classical directivity. It also shows an asymmetry between the positive and negative generated mode. These effects are due to axisymmetric variation (Ref. 9) resulting from multiple modes.
NASA/TM—2014-218118
9
(a) Long Duct, L/D = 1
(b) Short Duct, L/D = ¼ Figure 12.—Effect of Duct Length on In-Duct Modes
(a) Individual Modes
(b) Modal Summation
Figure 13.—Effect of Duct Length on In-Duct Modes
NASA/TM—2014-218118
10
Figure 14.—Effect of Duct Length on Far-field Directivity
5.0
Mode Reflection
5.1
Setup
In order to provide a clean, cylindrical duct, for this experiment the ANCF was built up off of the stanchion that normally supports the fan and duct sections that make up the nacelle. That is, the spool pieces were stacked up in a vertical orientation based on the floor. This removed center-body and support pylon from the arrangement, providing a constant area cylindrical duct. Two configurations were tested in this setup: (a) with the flow lip attached, and (b) without the flow lip attached, which left a bare flange as the exit termination (Figure 15 and Figure 16). The entire stack rested on the floor, and approximately 6 in. of foam material was placed in the bottom of the stack to minimize reflections from the floor. Typically, a single rake, extending from the outer-wall to the duct centerline, has been mounted to measure duct modes. It has been known (Refs. 10 and 11) that measuring at a single axial location will not be able to account for reflections in the duct, therefore, for this experiment an additional rake was mounted on the same rotating ring as the original. This second rake was adjustable in the axial direction over the range of 2.5- to 10.5-in., in fixed, 1-in. increments, and was mounted 180° in the circumferential direction from the original rake, which remains fixed in the axial direction. Figure 17(a) and Figure 17(b) show this arrangement. Data were acquired from the dual rakes in order to provide the two-point axial variation needed to compute the reflection. Reflections were created using two methods. The first method relies on the natural reflections due to an open-ended exit termination. The ring containing the dual rotating rake system was mounted at the exit of the ANCF stack-up (Figure 15(a)). The single driver row (C) farthest from the exit termination was used to generate the modes in Table I. This configuration was run with the flow lip attached—this was assumed to minimize reflections, and with the flow lip removed, creating a sharp 90° flanged exit—this was assumed to create reflections. A second configuration was used to generate artificial reflections, see Figure 15(b). This was accomplished by locating the dual rake ring in the center of the stack-up. Driver row C was used to generate the “primary” wave and driver set B was used to generate the “reflected” wave. Each driver row was actuated independently and the modes were measured by the dual rakes. Then both sets were activated simultaneously and the resulting superposition was measured.
NASA/TM—2014-218118
11
(a) Termination Reflection Configuration
(b) Artificial Reflection Configuration
Figure 15.—ANCF in Mode Reflection Configurations
(a) With flow lip attached
(b) With flow lip removed
Figure 16.—ANCF in Off-Stanchion Configuration
The concept is that the measured combination 𝐵 + 𝐶 is the resulting superimposed mode and is equal to B+C measured independently and mathematically combined. Thus any technique to separate the “primary” from the “reflected” wave will result in B and C that can be compared to the independent measurements for code validation (B and C are arbitrary amplitudes generated by driver rows B and C). NASA/TM—2014-218118
12
(a) Second Rotating Rake with Extensions
(b) Close-up of Rotating Rake Separation
Figure 17.—Dual Rakes on Same Rotating Ring
This assumes that there are no other reflections, either from the duct exit, the anechoic termination, or the rakes themselves. It also assumes that the driver rows generate the same mode PWL (magnitude and phase) independently and when combined. It also assumes that the rake response is independent of the mode propagation direction.
5.2
Results
The dual rake measurements were evaluated to determine if the basic assumptions were correct. Data from each rake were acquired when installed separately, in each of the two circumferential locations, in a reverse orientation, and with both rakes installed so that the adjustable upstream rake blocked the fixed rake. Table III shows these results. In general the results agree to within a decibel. Figure 18 shows typical results from the dual rake measurements. The fixed rake mode PWLs are compared to the adjustable rake levels as a function of separation distance. Figure 18(a) is data at 480 Hz where a single radial mode is cut on; Figure 18(b) shows data at 960 Hz where three radial modes are cuton. The flow-lip on and flow-lip off cases are compared. The data show that the mode PWL variation in axial distance is greater with the flow-lip removed, indicating a stronger reflection, due to constructive and destructive interference, as expected. Note also that the fixed rake measurements are constant as the movable rake is adjusted (also as expected).
PWL in dB 1BPF (2,0) (4,0) 2BPF m=2 (2,0) (2,1) (2,2) m=4 (4,0) (4,1) (6,0)
TABLE III.—MODE PWLS FOR A RANGE OF MODES, FREQUENCIES, AND RAKE ORIENTATIONS Fixed rake Fixed rake Fixed rake Extended rake Fixed rake blocked 0° position 180° position 0° position 180° position 0° position Standard orientation Standard orientation Reverse orientation Standard orientation Standard orientation 116.5/116.2 99.1/98.1
116.9/116.8 98.7/98.0
116.6 98.1
116.1 98.9
116.1 98.2
113.7/113.3 106.0/105.6 108.5/107.7 110.9/110.8 112.9/112.3 109.2/108.4 110.4/110.0 113.7/112.4
113.0/113.3 105.7/105.6 107.3/107.2 110.4/111.0 112.3/112.3 108.8/108.8 109.7/109.8 112.9/112.9
113.5 105.2 108 111 112.3 108.3 110.1 113.2
112.7 105.1 106.4 110.5 111.8 108 109.4 112.3
113.3 105.5 107.8 110.8 112.4 108.5 110.2 112.7
NASA/TM—2014-218118
13
Figure 18(c) shows a sample of the data from the dual-row configuration. In this sample, m = 2 was generated and the rakes were separated axially by 6.5 in. The amplitude of driver row C was held constant. The amplitude of driver row B was varied to simulate variation of the strength of the “reflection” from 1.0 to 0.25. This is indicated on the plot by “G”; the ratio of the driver row B amplitude to driver row C amplitude. The mode PWL from each row actuated alone and together is presented. Variations in the sum 𝐵 + 𝐶 are seen as the strength of the artificially generated reflection is modified.
(a) 480 Hz—Termination Reflection
(b) 960 Hz—Termination Reflection
(c) 480 Hz—Artificial Reflection Figure 18.—Changes in Mode Levels with Axial Distance (m=+2)
NASA/TM—2014-218118
14
6.0
Conclusion
Parametric sets of mode propagation databases were acquired for the purpose of computational aeroacoustic and acoustic measurement tool validation. Limited samples of the data were presented and analysis limited to ensuring the database is valid relative to basic acoustic concepts. The complete data and geometry referred to in this paper are available upon request.
References 1. Hubbard, H.H., ed., Aeroacoustics of Flight Vehicles: Theory and Practice: Volume 1, NASA Reference Publication 1258, Vol. 1, WRDC Technical Report 90-3052. 2. Loew, R.A., Lauer, J.T., McAllister, J., and Sutliff, D.L., “The Advanced Noise Control Fan,” NASA/TM—2006-214368, also AIAA–2006–3150, Nov. 2006. 3. McAllister, J., Loew, R.A., Lauer, J.T., and Sutliff, D.L., “The Advanced Noise Control Fan Baseline Measurements,” NASA/TM—2009-215595, also AIAA–2009-0624, Oct. 2009. 4. Heidelberg, L.J., Hall, D.G., Bridges, J.E., and Nallasamy, N., “A Unique Ducted Fan Test Bed for Active Noise Control and Aeroacoustics Research,” NASA TM–107213, also AIAA–96–1740. 5. Sutliff, D.L., Nallasamy, N., and Elliott, D.M., “Baseline Acoustic Levels of the NASA Active Noise Control Fan Rig,” NASA TM–107214, also AIAA–96–107214. 6. D.L. Sutliff. “Rotating Rake Turbofan Duct Mode Measurement System,” International Journal of Aeroacoustics, June 2007. 7. Rice, Edward, J., “Spinning Mode Sound Propagation in Ducts with Acoustic Treatment,” NASA TN D-7913, May 1975. 8. Tyler, J.M and Sofrin, T.G., “Axial Flow Compressor Noise Studies,” SAE Transactions, Vol. 70, 1962. 9. Heidelberg, L.J., Sutliff, D.L., and Nallasamy, M., “Azimuthal Directivity of Fan Tones Containing Multiple Modes,” NASA TM-107464, AIAA 97-1587. 10. Hall, D. G., Heidelberg, L., and Konno, K., “Acoustic Mode Measurements in the Inlet of a Model Turbofan Using a Continuously Rotating Rake: Data Collection/Analysis Techniques,” AIAA Paper No. 93-0599, 1993. 11. Cicon, D.E. and Sofrin, T.G., “Method for Extracting Forward Acoustic Wave Components from Rotating Microphone Measurements in the Inlets of Turbofan Engines,” NASA CR-195457, April 1995.
NASA/TM—2014-218118
15
Form Approved OMB No. 0704-0188
REPORT DOCUMENTATION PAGE
The public reporting burden for this collection of information is estimated to average 1 hour per response, including the time for reviewing instructions, searching existing data sources, gathering and maintaining the data needed, and completing and reviewing the collection of information. Send comments regarding this burden estimate or any other aspect of this collection of information, including suggestions for reducing this burden, to Department of Defense, Washington Headquarters Services, Directorate for Information Operations and Reports (0704-0188), 1215 Jefferson Davis Highway, Suite 1204, Arlington, VA 22202-4302. Respondents should be aware that notwithstanding any other provision of law, no person shall be subject to any penalty for failing to comply with a collection of information if it does not display a currently valid OMB control number. PLEASE DO NOT RETURN YOUR FORM TO THE ABOVE ADDRESS.
1. REPORT DATE (DD-MM-YYYY)
2. REPORT TYPE
01-04-2014
Technical Memorandum
3. DATES COVERED (From - To)
4. TITLE AND SUBTITLE
5a. CONTRACT NUMBER
A Mode Propagation Database Suitable for Code Validation Utilizing the NASA Glenn Advanced Noise Control Fan and Artificial Sources
5b. GRANT NUMBER 5c. PROGRAM ELEMENT NUMBER 5d. PROJECT NUMBER
6. AUTHOR(S)
Sutliff, Daniel, L. 5e. TASK NUMBER 5f. WORK UNIT NUMBER
WBS 473452.02.03.07.03.02 7. PERFORMING ORGANIZATION NAME(S) AND ADDRESS(ES)
8. PERFORMING ORGANIZATION REPORT NUMBER
National Aeronautics and Space Administration John H. Glenn Research Center at Lewis Field Cleveland, Ohio 44135-3191
E-18860
9. SPONSORING/MONITORING AGENCY NAME(S) AND ADDRESS(ES)
10. SPONSORING/MONITOR'S ACRONYM(S)
National Aeronautics and Space Administration Washington, DC 20546-0001
NASA 11. SPONSORING/MONITORING REPORT NUMBER
NASA/TM-2014-218118 12. DISTRIBUTION/AVAILABILITY STATEMENT
Unclassified-Unlimited Subject Categories: 07, 09, and 71 Available electronically at http://www.sti.nasa.gov This publication is available from the NASA Center for AeroSpace Information, 443-757-5802 13. SUPPLEMENTARY NOTES
14. ABSTRACT
The NASA Glenn Research Center’s Advanced Noise Control Fan (ANCF) was developed in the early 1990s to provide a convenient test bed to measure and understand fan-generated acoustics, duct propagation, and radiation to the farfield. A series of tests were performed primarily for the use of code validation and tool validation. Rotating Rake mode measurements were acquired for parametric sets of: (i) mode blockage, (ii) liner insertion loss, (iii) short ducts, and (iv) mode reflection. 15. SUBJECT TERMS
Aeroacoustics; Ducted fans; Fan noise; Test 16. SECURITY CLASSIFICATION OF: a. REPORT
b. ABSTRACT
c. THIS PAGE
U
U
U
17. LIMITATION OF ABSTRACT
UU
18. NUMBER OF PAGES
22
19a. NAME OF RESPONSIBLE PERSON
STI Help Desk (email:
[email protected]) 19b. TELEPHONE NUMBER (include area code)
443-757-5802 Standard Form 298 (Rev. 8-98) Prescribed by ANSI Std. Z39-18