Aug 15, 1997 - Flight planning as it is described above has to take into account service intervals, ..... origin to a destination has taken a sequence of legs (possibly only one leg) a so .... solving MCP-PATH is beyond the scope of this paper.
Direktor: Univ.-Prof. Dr.rer.nat. Dr.rer.pol. Ulrich Derigs
SYNOPSE { A Model-Based DSS for the Evaluation of Flight Schedules for Cargo Airlines J. Antes L. Campen U. Derigs WINFORS, University of Cologne C. Titze G.-D. Wolle Lufthansa Cargo AG, Frankfurt August 15, 1997
ina r fü r Sem
d un h ik rc at ea rm fo R e s in fts o n s ha ti sc era irt p W O
ZU KOLN UNIVERSITAT SEMINAR FU R WIRTSCHAFTSINFORMATIK UND OPERATIONS RESEARCH
RS
WINFO
1 Introduction A cargo airline o�ers the conceptually simple service to transport a certain amount of goods from an origin to a destination within a certain time interval at a given price. For this purpose the airline keeps a eet of aircrafts and/or leases capacities from other companies, especially ground capacities for transporting goods to, from, and between airports. The tactical planning problem of such airlines is to design a (weekly) ight schedule which allows the most pro table service of the unknown market demand for the next period{the next six months in general{using the available capacities, i.e. aircrafts, ground transportation, and handling capacities at the airports. So far an algorithmic and fully automated generation of ight schedules seems to be infeasible due to the extremely high complexity of the planning situation. Flight planning as it is described above has to take into account service intervals, is (sequentially) interdependent with other decisions on building rotations for single aircrafts and crew assignments, and thus the whole decision complex is beyond the possibility of becoming fully structurable into a complete and e�ciently computable model [2]. Therefore, this planning and design problem can only be solved by an interaction between planner and computer, i.e. by a so called Decision Support System (DSS) [14]. And here the use of evaluative models which allow the analysis of a plan with respect to di�erent criteria seems to be an adequate approach for several reasons. It is quite common to design a new schedule by altering the plan which is the basis for operations of the present period by adapting service capacities to projected changes in customer demands and/or changes in eet and airport characteristics. Moreover, the ability to evaluate a solution is a necessary prerequisite in a systematic search procedure for constructing solutions. In this paper we describe such a DSS called \SYNOPSE" which has been developed at WINFORS (University of Cologne) in collaboration with the planning division of Lufthansa Cargo AG. SYNOPSE stands for \System zur Netzoptimierung und Planung Strategischer Entscheidungen". According to the DDMparadigm [12] of the DSS concept the architecture of any speci c DSS can be described by three modules - the data, model, and dialog component. The data component of a DSS consists of a database and a database management system with the database containing all the factual information necessary to describe a concrete planning situation. The model component contains one or more quantitative planning models associated with appropriate solvers. Here a planning model is de ned as a \constructive problem description" by which the relationships between courses of actions and consequences are translated into the form of a \mathematical/computational problem". The combination of models, data, and solvers is controlled by the model management system. The dialog component can best be interpreted as the language of interaction between planner and system, i.e. a so called action-language describing the planners actions, and a so called presentation-language describing the computers presentation of results from model calculations [11]. Given an estimated amount of service requests and a candidate ight schedule our models calculate the maximal possible contribution to pro t which can be 1
obtained by ful lling service requests according to the ight schedule. Thus, although the approach taken by SYNOPSE is evaluative, i.e. no plans are suggested, the models we use are optimization models which, given market-demand, transportation and handling capacities, construct an optimal assignment between demand and capacities. To determine this assignment and it's value complex mathematical programming problems are solved. A system allowing such calculations can be used for analysis in di�erent ways: 1. based on a xed demand di�erent ight schedules can be compared with respect to their contribution to pro t, 2. the robustness and adaptability of a schedule with respect to changes in service requests can be evaluated through simulation, 3. bottlenecks with respect to transportation capacities o�ered by a ight schedule can be identi ed, and 4. potentials for creating higher contribution to pro t through the acquisition of additional market-demand can be identi ed. The paper is organized as follows. In section 2, we describe the planning situation, i.e. we represent the relevant concepts or object classes in the planner's world of discourse and based on this conceptual scheme we describe the logical (relational) scheme of the SYNOPSE-database. In section 3 we describe a family of optimization problems which are elements of the model base. These models re ect planning problems at di�erent levels of detail used at di�erent stages in the planning process, i.e. we state purely volume oriented models neglecting time constraints as well as a exible model taking into account these time considerations and restrictions to ground handling. In section 4 we describe shortly the implementation of the DSS, its software and hardware components, and the development strategy. In section 5 we nally describe the usage of SYNOPSE in a planning situation, i.e. we state the basic information needs that arise for a planner who is confronted with the evaluation of a schedule and the associated analysis strategies.
2 The Planning Situation: Data Model From the verbal description of an air-cargo service given in the introduction we can identify three basic entity types in our world of discourse:
AIRPORT with a three letter identi er and a name PRODUCT with an identi er and a description and TIME with the only attribute time being a tuple composed of three domains
day of week = f1; : : : ; 7g hour = f0; : : : ; 23g minute = f0; : : : ; 59g. 2
Unlike the situation a passenger airline faces the goods transported by a cargo airline are extremely heterogeneous [15, chapter 11] [7, chapter 12] with a precise description of all units to be transported being neither available during the planning phase nor relevant. Therefore, a catalogue of relevant attributes like standard, express, hazardous, etc. has been developed to identify product types which require di�erent handling. In that respect PRODUCT is the class of all conceptually di�erent product types and each good to be transported is assigned to at least one speci c type. The market-demand can be described as a set of estimated or booked service requests. Such a request has several attributes with the origin and destination airport being the dominant characteristic. Therefore, these request objects are commonly referred to as \O&D's" or \O&D-pairs". Conceptually the object class OD can be modelled as a complex 5-ary (recursive) relationship-type between
AIRPORT playing the role of an origin and a destination, respectively TIME playing the role of an availability and due time, respectively, and PRODUCT with the additional attributes giving the quantity measured in kg and the yield or freight rate given in $ per kg. Note that for each O&D we require the origin to di�er from the destination as well as a positive di�erence between the due time and availability. Also we do not consider the criterion \volume" of a request in this planning phase. The ight schedule on the other hand can be described as a set of so called legs. Here a leg is a direct ight between two airports o�ered at the same time every week during the planning period. In our scheme we model the object class LEG as a 4-ary (recursive) relationship-type between
AIRPORT playing the role of an origin (from) and the destination (to), reTIME
spectively, and playing the role of a departure and arrival time, respectively,
with the additional attributes of a ight designator for identi cation, the capacity of the leg measured in kg and the operating cost of the leg measured in $ per kg. Note that we require for each leg di�erent origin and destination airports and a positive di�erence between arrival and departure time. There are certain incompatibilities between product-types and legs, i.e. an express item should in general not be transported on leased capacities etc. The validity of a leg with respect to the di�erent product types is modelled by a relationship-type L P FEASIBLE associating entities from LEG and PRODUCT, i.e. every relationship element identi es a feasible assignment. The relevant information re ecting the ground handling, i.e. the import, export and transfer of the goods at the airports is modelled by a relationship-type GROUNDHANDLING between the entity types AIRPORT and PRODUCT with the following attribute pairs 3
LEG_PROD
AIRPORT
from
to
origin
destination Transfer
amount
LEG
depart
OD
arrive
avail
PRODUCT
due
TIME
Figure 1: The Entity Relationship Model
(imp time, imp cost)
giving the time and cost for import of a certain good, i.e. handling at the destination airport (exp time, exp cost) giving the time and cost for export of a certain good, i.e. handling at the origin airport (trans time, trans cost) giving the time and cost for transfer at an intermediate airport, i.e. unloading and reloading the goods
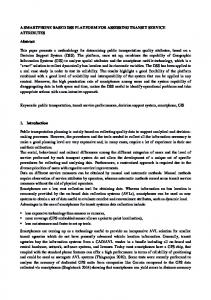
with times measured in minutes and cost measured in $ per kg. Transportation, either real or planned can now be described by an association between the object types LEG and OD, i.e. a relationship type LEG OD re ecting the usage of a certain leg for a certain O&D by an attribute giving the amount measured in kg. Given an instantiation of LEG OD, the contribution to pro t can be derived by a simple arithmetical operation. It is the decision model which describes the optimal instantiation, i.e. an optimal choice of amount-values for the entities from LEG � OD. Figure 1 gives the graphical representation of our conceptual data scheme using the common symbols of the entity-relationship [8, pp 39-88] model. Taking into consideration the complexities of the relationship-types which are unrestricted in all cases, the associated relational scheme can be constructed via a standard 4
concept name alias AIRPORT A LEG L L P FEASIBLE F PRODUCT P yield y cost c
ight designator f capacity u destination d origin o Table 1: Aliases used in optimization models transformation, i.e. introducing a basic relation for each entity-type and each relationship-type, introducing for relations representing relationship-types all the primary keys from associated entity types as foreign keys and describing referential integrity conditions appropriately [8, pp 172-177]. Note that in the logical data model, i.e. the relational scheme, we use a standardized time description and represent all time-associations as attributes, i.e. we do not introduce a base relation TIME. This is a common approach.
3 The Problem Description: Decision Models The following description of the evaluation of a ight schedule is based on the data scheme given in section 2, i.e. we assume that an instantiation of LEG, OD and L P FEASIBLE is given. Note that in the following we use the notation which is commonly used in mathematical programming, i.e. we write o(od) instead of the relational notation OD.o for referring to the value of attribute o for an od-tuple. Also we use the one-letter aliases given in table 1 and denote the only derivable attribute of the scheme, the amount for the LEG OD-type and base relation by x, i.e. x(l; od) is the amount in kg of \good" od 2 OD which is transported over leg l 2 L. Note that for the rst two models we neglect any time restrictions making these models suitable for analyzing strategic aspects, i.e. questions concerning the capacitative balance between market-demand and eet structure, the potentials for strategic alliances etc. Our rst model is an immediate translation of the description given in section 2, specifying integrity constraints for the amount-attribute through restrictions on x and introducing the contribution to pro t value as objective function. The rst two models represent the planning alternatives as arc- ows in a network with the airports being the nodes and the legs de ning the arcs. While in the classical transportation problem the optimal distribution of one homogenous good is considered, here we have to consider di�erent commodities, leading to the so called multi-commodity network ow problem [1, chap. 17]. 5
In our rst model these commodities are the di�erent O&D's in OD, thus leading to the de nition of the above decision variable.
Model 1. Multi-ODP-Commodity Flow Formulation (MCF-ODP) 1 0 X X @ X A (1-1)
max
2
od OD
subject to (1-2)
X
2L:o(l)=i
l
(1-3) (1-4) (1-5)
x(l; od) ?
X 2L:d(l)=i
l
X 2
2L:o(l)=o(od)
y(od) � x(l; od) ?
od OD
2L
c(l) � x(l; od)
l
l
8 > � ?q(od) i = d(od) 8 i 2 A; od 2 OD := 0 else x(l; od) � u(l)
8l2L
x(l; od) � 0 x(l; od) = 0
8 l 2 L; od 2 OD 8 l 2 L; od 2 OD : (p(od); l) 62 F
Here the objective function calculates the di�erence between total yield and operating cost. Constraints (1-2) are the so called ow balancing constraints, which restrict the amount of ow for any O&D to at most q(od), and control that for each O&D the amount leaving o(od) is arriving at d(od). Constraints (1-3) control that the usage of a leg does not violate the capacity constraint while (1-4) allows only nonnegative amounts to be transported and disallows infeasible association of O&D's to legs. In the second model we work on an aggregated view. For every leg we consider the OD-entities with the same destination as one object, i.e. in relational terms we build the projection DP = PROJ OD and assign a variable x to each tuple or entity in DP � L . Thus we de ne
x(l; dp) = amount in kg of product p(dp) with destination d(dp) transported on leg l. With this aggregation all O&D's with the same destination are treated as one commodity. To ease notation we introduce two index sets. DP(od) = fdp 2 DPjd(od) = d(dp) ^ p(od) = p(dp)g gives for every O&D the associated entity in the projection DP while OD(dp) = fod 2 ODjd(od) = d(dp) ^ p(od) = p(dp)g gives the inverted view, i.e. it gives for every object in DP the entities from OD which have been aggregated.
6
Model 2. Multi-DP-Commodity Flow Formulation (MCF-DP) 1 0 X X BB X C y(od) x(l; dp)C x(l; dp) ? max A @ 2
(2-1)
od OD
?
2L;dp2DP(od):
2L;dp2DP(od):
l
X
l
o(l)=o(od)
2L;dp2DP
d(l)=o(od)
c(l) � x(l; dp)
l
subject to (2-2)
X 2L:o(l)=i
x(l; dp) ?
2L:o(l)=i
l
(2-4) (2-5) (2-6)
2L:d(l)=i
x(l; dp) ?
X 2L:d(l)=i
l
X 2
dp DP
X
x(l; dp) � ?
2
q(od) 8 i 2 A; dp 2 DP : i = d(dp)
od OD(dp)
l
l
(2-3) X
X
X
x(l; dp) �
2
q(od)
8 i 2 A; dp 2 DP : i 6= d(dp)
od OD(dp): i=o(od)
x(l; dp) � u(l)
8l2L
x(l; dp) � 0 x(l; dp) = 0
8 l 2 L; dp 2 DP 8 l 2 L; dp 2 DP : (p(dp); l) 62 F
The advantage of the DP-formulation over the ODP-formulation is the smaller size of an instantiation and thus the possibility to solve larger problem instances in shorter time. Yet, one has to pay for this advantage with the loss of \routing information". Thus the application of the second formulation is recommendable if ight schedules are evaluated on their contribution to pro t-value only. If more information about the routing, the usage of legs etc. is required, an associated ODP-solution has to be constructed. In our system this is done by a routine \ROUTER", which given a DP-solution pushes odp-units from their o-nodes to their d-nodes. Note that given a DP-solution the ODP-solution need not be unique. A detailed description of the straight-forward pushing process is beyond the scope of this paper. Computational experiences have shown that the two-phase-approach, i.e. solving the DP-formulation followed by ROUTER is not only more e�cient with respect to memory-requirements, but also consuming less CPU-time than the single-phase ODP-approach. Yet, for larger instances and/or the necessity to incorporate more constraints into the model, i.e. considering time-windows for the demand and cost as well as duration for ground handling, formulations based on the multi-commodityarc- ow model become intractable and so called path- ow-formulations should be used [1, chap. 17]. Path-models are based on the obvious fact that any unit transported from an origin to a destination has taken a sequence of legs (possibly only one leg) a so called path or itinerary connecting the origin with the destination. Note that in a solution to the problem for every od 2 OD the amount which is transported 7
is usually split over several itineraries. These paths can be (re-)constructed through pushing routines similar to ROUTER. If in the path formulation all possible itineraries are assumed to be given then the optimization problem is simply to select the optimal combination of paths which leads to a standard linear program. The advantage of this approach is the possibility to consider rather general and complicated constraints for feasibility of transportation in the path-construction phase, i.e. keeping this knowledge away from the optimization model, thereby reducing the complexity of the optimization phase and allowing the same standard (LP-)solution procedure for a wider range of di�erent planning situations. Moreover, this approach allows for scaling, i.e. it is not necessary to construct all possible paths. Working with a \promising subset" of pro table paths only, reduces the size of the problem instance but may lead to solutions which are not optimal in general, yet highly acceptable in quality. Finally, an approach called column-generation allows to generate feasible paths on the run during optimization and thus keeps problem size manageable throughout the optimization process [5, 6]. In the following we rst describe the concept of itineraries or paths more precisely. A path for an od 2 OD is a sequence s = (l1 ; : : : ; l ( )) of legs l 2 L; n(s) � 1 with the following property i
n s
o(l1 ) = o(od) d(l ) = o(l +1 ) d(n(s)) = d(od) i
i = 1; : : : ; n(s) ? 1
i
A path is called od-feasible if additional requirements are ful lled which vary with the problem de nition. Here we consider several types of constraints:
availability-time avail (od) + exp time (o(od); p(od)) � dep (l ) due-time arr (l(s)) + imp time (d(od); p(od)) � due (od) transfer-time arr (l ) + trans time (d(l ); p(od)) � dep (l ) for i = 1; : : : ; n(s) ? 1 if f(l ) = 6 f(l ); i.e. the aircraft 1
i+1
i
i
changes from l to l +1 product feasibility (l ; p(od)) 2 F. i
i
i+1
i
i
For every od 2 OD we denote by S(od) the set of od-feasible itineraries. Note that a path may be feasible for many di�erent O&D's. In our model we have to distinguish these roles and consider multiple copies of the same path assigned to di�erent O&D's. Given an itinerary s 2 S(od) we can easily calculate the operating cost c(s) for
8
transporting one unit (kg) on this path:
X
n(s)
c(s) =
c(l ) + exp cost (o(od); p(od)) i
i=1
X?1
n(s)
+
trans cost(o(l ); p(od)) i
i=2: f (li 1 )=f (li )
? 6
+ imp cost(d(od); p(od)) For the following model we introduce for every s 2 S(od); od 2 OD a decisionvariable x(s) = amount (in kg) of od transported via s. Moreover we de ne an indicator-variable � : L � S ! f0; 1g � �(l; s) := 10 ifelseleg l is contained in path s Then the model for constructing a feasible combination of paths giving maximal contribution to pro t is as follows:
Model 3. Multi Commodity Path Flow Formulation (MCF-PATH) X X (3-1) max (y(od) ? c(s)) � x(s) 2
2
od OD s
subject to
X
(3-2) (3-3) (3-4)
X X 2
od OD
2
s
S (od)
2
s
S (od)
x(s) � q(od)
8od 2 OD
S (od)
�(l; s) � x(s) � u(l) x(s) � 0
8l 2 L 8s 2 S(od); od 2 OD
From an (optimal) solution to MCF-PATH the following information can be obtained in a quite straight forward way:
� for each O&D the set of itineraries used for transporting together with the
associated amount, the total amount which is transported as well as the amount which is left at the origin together with the associated revenue. � for each leg the set of all O&D's and the associated amount transported over the leg � for each airport the amounts of goods originating/destining/transfering and � for each pair of airports the amount of goods transported between them. Also the optimal dual solution gives important and helpful information to be used in the analysis: 9
� the value of the dual variable ! for constraints (3-3) gives the increase of l
the objective function value per unit increase of the capacity u(l) of leg l. � the value of the dual variable �od for constraints (3-2) gives the increase of the objective function value per unit increase of the demand q(od). � the reduced cost value r(s) P for an itinerary s 2 S(od) de ned by r(s) = (y(od) ? c(s)) ? (�od + 2 �(l; s)! ) gives for each itinerary which is not used (more precisely for each non basic variable x(s)) the amount by which the yield (freight rate) of this od has to be increased in order to make transportation of one unit of this od using s pro table. l
l
L
Applying column generation to solve MCF-PATH the reduced cost values for itineraries which so far have not been introduced into the LP-model and thus could not be considered for optimization indicate optimality of the LP-solution or potential improvements through the introduction into the LP-model. For a speci c od the k most promising paths in S(od) to be introduced into the LP-model can be constructed by computing the k-shortest (constrained) paths between o and d. A detailed description of the column generation technique for solving MCP-PATH is beyond the scope of this paper. We will report on our implementation in another paper.
4 Implementation: Development and Architecture In this section we describe the implementation of SYNOPSE, here we shortly discuss
� the development process and we outline � the technological basis with the hardware and software tools etc. The work on SYNOPSE was initiated by the demand of a major scheduled cargo airline to evaluate the consequences of a very speci c and complex change in their regular schedule, a task for which so far used manual and informal, expertise-based procedures and processes seemed to be not reliable enough. At the beginning of the project a signi cant amount of time and e�ort was invested to get a precise de nition of the concepts and business rules used in the cargo industry, i.e. to (re-)construct the assertions and terms communicated in the business language into a formal data scheme describing the architecture of the database. Then a comprehensive data analysis led to the speci cation of attributes and the identi cation of the information sources. What is commonly called the \data problem", e.g. the situation that relevant data is not available in the right quality, in the right level of detail etc. turned out to be crucial throughout the whole project and has caused many \modeling compromises". Also, at the beginning, the managers could not su�ciently describe their expectation for the functionality of the supporting system, mainly because of their lack of experience with model-based analysis. 10
Because of these two circumstances an iterative development process [14, pp 74] through a sequence of prototypes was the only feasible approach. In this early phase we used the model MCF-ODP to evaluate the modeling approach in general, i.e. to demonstrate the consequences of incorporating constraints into the model and/or aggregating the model due to missing data, insu�cient accuracy of data etc. Quite a substantial discussion concerned the right de nition of operating cost for transporting all goods on individual legs and the handling of cargo at airports. So for instance, our rst models produced solutions, where a huge amount of freight was routed through very small airports. This was considered as unappropriate because of the airports limited handling capacities. Therefore, we introduced into the model the concept of \hubs" in a di�erent manner from the conventional use within the airline company, i.e. we distinguished between airports for which transfer is possible/not possible. For representing the models we used the mathematical programming language AMPL [9] as a generator of the input to the linear programming solver CPLEX [4]. Using a mathematical programming language like AMPL was a necessary requisite to allow the iterative development and the many experiments with different model alternatives obtained through introduction/dropping of constraints in a timely manner etc. After all using AMPL was a success factor. With conventional modeling, i.e. the individual programming of matrix-generators rapid prototyping would not have been possible. The experience with the rst prototypes resulted in the following insights for the management:
� The analyst's rst idea to evaluate and analyze schedules based on stan-
dardized and detailed reports is impractical and representations allowing di�erent use at di�erent levels of detail as well as the support of di�erent analytical processes with di�erent views is necessary. � The system should be able to assist evaluations at di�erent stages during the entire planning process and should therefore also be able to work at a disaggregated level incorporating rather complex constraints. Due to the fact that the scheduling experts because of the novelty of the approach were not able to express a standard model for an analyzation process we designed the presentation logic of SYNOPSE around the views which a planner can de ne for a given schedule, using these views as dimensions or directions during the analysis and allowing operations on these views. Thus our development is very much in the avor of the generally suggested ROMC-approach [3, 13] . The analytical capabilities of SYNOPSE are described in more detail in section 5. Because of the analyst's experience with PC's especially the Windows operating system and various end-user tools like spreadsheets and word processors the front end of SYNOPSE had to be implemented in a PC environment. To allow a exible work ow management, the use of UNIX-workstations for solving large scale models as well as a future connectivity to corporate database servers we designed SYNOPSE using the client server architecture concept, which allows the distribution of functionality. In gure 2 we display the architecture of SYNOPSE. 11
SYNOPSE Data
Dialog
Model
AMPL MS Access CPLEX
Dos/Windows 3.11
AIX 4
Pentium 166 MHz PC
RS6000/3CT
Figure 2: The Architecture of SYNOPSE We implemented the dialog and the data component on the client using MS ACCESS for Windows 3.11. For the model component we used the modeling language AMPL together with the LP solver CPLEX. The pair AMPL-CPLEX was placed on the server together with the optimization-models. During the development phase we used an IBM RS 6000 model 540 with AIX 3.2.5 for the server. For the analysts we combined server and client on a Pentium 166 Mhz PC in order to have a stand-alone system.
5 Usage: Analyzing Freight Flows and Schedules SYNOPSE is based on the conceptual idea that the evaluation of a given ight schedule can be performed on the basis of an associated optimal freight routing, i.e. the investigation of an associated routing giving maximal contribution to pro t for a xed estimated demand. Confronted with such an optimal freight routing the analyst will after checking the plausibility of the solution by comparing the proposed routing with his experience, i.e. routings actually implemented in operation, search for weaknesses and opportunities of the given schedule as well as investigate the sensitivity of the schedule's quality with respect to changes in the demand. Based on the results of this rst analysis he will formulate changes in the schedule and/or in the demand pattern leading to a modi cation of the problem instance which has to be solved for further analysis. 12
Confronted with a schedule, the planner can take di�erent views associated with the basic object classes legs, O&D's and airports, respectively, which can be thought of de ning the dimensions in a conceptual search space. Weaknesses like a capacity bottleneck or a capacity surplus as well as opportunities like pro table O&D's can be identi ed by studying critical objects from these classes, i.e. single legs, O&D's and airports which themselves are identi ed through extreme indicator-values in the model's optimal solution. Here the most important indicators are the leg's load factors and the O&D's production levels as well as certain values from the LP-dual. Here the load factor of a leg l is the percentage of all units transported over l compared to total capacity. The production level of an O&D is the percentage of the amount which is actually transported compared to the demand quantity. Thus to enable a determined investigation of a given schedule we provide listings of critical legs and critical O&D's as starting points for the analysis. Obviously, a completely used leg, i.e. a leg with a load factor of 100 % may indicate a capacity bottleneck. There are two ways of supporting the analysis of this fact. One way is to check the load factors on all parallel legs, i.e. those legs that are candidates for alternatively transporting the O&D's transported on this leg. If every parallel leg has a load factor of 100 % and one of the associated O&D's is not completely produced, then the leg is a bottleneck and increasing the capacity between the origin and destination airport introducing an additional parallel leg, for instance, may increase total yield and contribution to pro t. A second indicator for the relative shortage of capacity is the value of the dual variable associated with the leg's capacity constraint (3-3), i.e. the dual price of the leg. Here large values indicate the potential that by only a small capacity expansion a relative large increase in pro t can be realized. SYNOPSE supports this kind of analysis by the presentation of a list of fully used legs together with their dual prices and the possibility to generate the list of parallel edges by a simple mouse click to an entry in the list. On the other hand a leg with an extreme low or even zero load factor seems to indicate a capacity excess, i.e. that the leg is super uous and can be deleted from the schedule thereby increasing pro t. Yet, in most cases such a simple conclusion is invalid since the leg may be or become part of an aircraft routing, i.e. so called ights with the other legs of the routing being heavily utilized. Here the analyst has to use his knowledge about existing ights to draw adequate conclusions. Another indicator of a possible capacity shortage is an unsatis ed demand, i.e. the fact that a certain O&D has a production level below 100 %. If in the optimal solution the demand quantity of a certain O&D is not completely transported this indicates either a capacity shortage, i.e. that the schedule does not o�er su�cient capacity and with respect to the scarce transportation resources other O&D's are more pro table, or it indicates that another unit of the O&D is not pro table, i.e. the freight rate does not compensate the cost of an additional unit since one would have to use an itinerary which although o�ering capacity has operating cost exceeding the O&D's yield. Again there are two approaches to support this kind of analysis. First, SYNOPSE presents a list of all unsatis ed O&D's and allows the generation of the 13
associated itineraries via mouse click. Yet, then the analysis becomes quite complex. Following the sequence of legs of an itinerary one can check the load factor of these legs as well as of their parallel legs and thus identify a capacity shortage and one can identify the other O&D's which are transported on these legs and thus are more pro table. This may lead to many alternative candidates for modi cations. A second approach would be to look at the reduced cost coe�cients of those itineraries for the O&D which are non-basic, i.e. which are not used in the present freight ow. If these values are all strictly negative, this indicates the relative inpro tability of the O&D under consideration. On the other hand if an O&D is fully satis ed this indicates a relative profitability. Again, in this case a high value of the dual price of this O&D, i.e. the value of the dual variable for the O&D's quantity-constraint (3-2) suggests to increase the demand quantity, i.e. it suggests the acquisition of more demand for this speci c O&D. During the analysis of a critical object the planner will encounter more critical objects of di�erent types and thus change his view. Thus the dialog management has to allow for the exible evaluation along search paths of the dimensionality described above with the provision of memory aids and the possibility of freezing, versioning and backtracking to objects and situation descriptions constructed along the search path. We will shortly describe the associated features which are implemented in the present version on SYNOPSE. During the analysis of a schedule the planner may encounter several objects which he wants to analyze under certain aspects through a modi cation of their characteristics. SYNOPSE maintains a so called change-list into which the planner can insert candidates for later modi cations. Finally, based on this list the planner can generate a new problem instance which then will be solved again by SYNOPSE. During the course of an analysis the analyst may create several sets of modi cations he wants to have evaluated. To support this what-if analysis as well as a systematic schedule evaluation and improvement through this kind of simulation we implemented a versioning function. The initial schedule to be evaluated or to be improved is called the base schedule leading to an associated base solution, i.e. optimal freight ow. Each time a set of modi cations is de ned, and the resulting instance is solved via SYNOPSE, this creates a so called version of the base schedule. Now, the analyst may want to create modi cations of versions, i.e. sequences of modi ed instances to be evaluated and he may then want to undo certain modi cations and restart analysis from a version created earlier in the simulation process. SYNOPSE keeps track of these versioning paths and allows backtracking by maintaining a so called version-tree. Starting with the base instance and solution as the root each modi cation of an instances creates a new labeled node which is connected with the node of the old instance by an arc. In this way it is possible to reconstruct any predecessor of an instance as, for example, the base schedule itself. To support the analysis of the e�ects of such modi cations, i.e. to support the comparison of di�erent versions of a base schedule, SYNOPSE allows to keep two problem instances active for analysis and presents the di�erences of the 14
Figure 3: Example: the O&D listing associated optimal freight routings. Obviously the comparison in terms of key values as for instance contribution to pro t, total yield etc. can give only a rst and rough idea of the impact of the changes. For a deeper and more detailed what-if analysis SYNOPSE presents the di�erences between the versions in form of three so called �-listings stating for all (common) O&D's the di�erence in total yield measured in $ and total transportation measured in units as well as for every (common) leg the di�erence in load factor, dual price and idle cost. In most cases the modi cations issued by the analyst will be rather small in order to reduce the complexity of the entire analysis. Often, yet not necessarily always, this will result in only a few local changes in the freight ow. In this case a simultaneous presentation of the two freight ows in form of such a list of di�erences ranked by decreasing delta values gives a compact and easily readable view and enables a quick check whether some anticipated changes have materialized, and thus the new version should be kept for further analysis and modi cation. After a sequence of changes has been issued and the modi cations have accumulated to a schedule which is rather di�erent from the base schedule it may be advisable to declare this schedule to be a new base schedule.
A Working Example In the following we outline the analysis for a small arti cially constructed instance displaying some of the associated presentations (SYNOPSE screenshots). Although this example is quite simple it already demonstrates the high complexity of the analysis in general and the high volume of relevant information which has to be organized and presented properly to support the di�erent views and navigation paths of the analysis. From the ordered list of production levels ( g. 3) the analyst is informed about 15
Figure 4: Example: SYNOPSE's complex analysis screen unsatis ed demand by the optimal freight ow. In this case he learns that only 66.48 tons of standard freight from Frankfurt to Abu Dhabi { i.e. for the O&D FRA AUH S is transported which is a production level of only 4,47 % and leads to a loss in yield of 82.560 DM. With a mouse click on the associated line the analyst can activate the next screen ( g. 4) which gives information about the critical O&D under consideration and allows the analysis of the corresponding itineraries. The screen shows that in the present solution only one itinerary FRA-BAH-AUH via Bahrain is used. Now the analyst can start from either the origin or the destination to evaluate all legs which are parallel to the legs used in this itinerary. From the actual screen he can already see that all legs between the origin FRA and BAH, the rst intermediate airport on the itinerary are fully used. Activating a next screen he will see that all legs between BAH and the destination AUH are fully used as well. Together with this information he can always see the O&D's which are transported on these parallel legs and which because of this fact are more pro table than the critical O&D analyzed at the moment. Now we assume that the analyst knows of an alternate itinerary for the critical O&D connecting FRA with AHU via KWI (Kuwait). The graph in gure 5 represents the situation with the three legs between FRA and KWI and the one available leg between KWI and AHU. Further analysis reveals that the capacity on the leg KWI and AHU is fully used and thus this connection is the bottleneck. Knowing about a charter option of 20 tons, the expert may now introduce an additional leg connecting KWI and AHU with it's chartered capacity into the change-list ( g. 6). With this modi cation we have created a new version which is solved. The old solution (A) and the new solution (B) can now be compared. Since the analyst is interested in the di�erence on the critical legs of the itinerary, he will start 16
BAH
%
0 10
10
0%
0%
10
0%
10
FRA
AUH
10
0%
10
0%
0%
4.1
10
3%
KWI
Figure 5: Example: an overview
Figure 6: Example: the change list
17
Figure 7: Example: the leg listing the analysis using the leg view and activate the screen shown in gure 7. He immediately sees that as it was anticipated another 20 tons of the O&D are transported on the newly introduced leg and one of the existing legs between FRA and KWI which had unused capacity. This fact is verifyable via the O&D listing as in screen 8, too.
6 Final Remarks In this work we have presented SYNOPSE, our model-based DSS for evaluation of ight schedules for cargo airlines by describing its conceptual as well as technological basis; our experiences during development as well as its analytical capabilities. SYNOPSE has evolved over time as it is common to all speci c DSS and even at the moment the system is under permanent revision. Through the work with the several versions of SYNOPSE the analysts have not only learned about the use of model-based DSS in concrete decision situations. The creation of new insights into the complex interdependencies of the planning situation extending the analysts expertise has probably a much larger e�ect on future planning than the creation of relevant information for a speci c decision instance. The analysts are now in a much better position to specify their need and to evaluate institutional computer-based planning systems developed for their department. Thus our work with SYNOPSE has again demonstrated that developing a Decision Support System is more a service task than the manufacturing of a product and \The Purpose of Mathematical Programming is Insight, not Numbers" [10],
18
Figure 8: Example: the new O&D listing
19
References [1] Ahuja, R. K., Magnanti, T. L. & Orlin, J. B. [1993]. Network Flows: Theory, Algorithms, and Applications, Prentice Hall, London. [2] Antes, J. [1997]. Structuring the process of airline scheduling. WINFORS Working Paper, University of Cologne, Germany. URL: http://www.informatik.uni-koeln.de/winfors/pub/ja-sor97-1.ps [3] Carlson, E. [1979]. An approach for designing decision support systems, Data Base 11. [4] cpl [1989]. Using the CPLEX Callable Library. Version 4.0. [5] Dantzig, G. & Wolfe, P. [1960]. Decomposition principle for linear programs, Operations Research 8(1): 101{111. [6] Dantzig & Wolfe [1961]. The decomposition algorithm for linear programs, Econometrica 29(4): 767{778. [7] Doganis, R. [1991]. Flying O� Course: the Economics of International Airlines, second edn, Harper Collins Academic, London. [8] Elmasri, R. & Navathe, S. B. [1994]. Fundamentals of Database Systems, second edn, Benjamin/Cummings, Redwood City. [9] Fourer, R., Gay, D. M. & Kernighan, B. W. [1993]. AMPL: A Modeling Language for Mathmatical Programming, body & fraser. [10] Geo�rion, A. M. [1976]. The purpose of mathematical programming is insight, not numbers, Interfaces 7(1): 81{92. [11] Holsapple, C. W. & Whinston, A. B. [1996]. Decision Support Systems{A Knowledge-Based Approach, West Publishing, Minneapois/St. Paul. [12] Sprague, Jr., R. H. [1986]. A Framework for the Development of Decision Support Systems, in , third edn, chapter 1, pp. 3{28. [13] Sprague, Jr., R. H. & Carlson, E. [1982]. Building E�ective Decision Support Systems, Prentice Hall, Engelwood Cli�s, NJ. [14] Sprague, Jr., R. H. & Watson, H. J. [1993]. Decision Support Systems{ Putting Theory into Practice, third edn, Prentice Hall, London. [15] Wells, A. T. [1994]. Air Transportation: A Management Perspective, third edn, Wadsworth. Belmont, ISBN: 0-534-21504-1.
20