The software versions used were InfoZoom 3.40 EN Professional from humanIT AG ... front of a SmartBoard, a large 60â diagonal touch- sensitive electronic ...
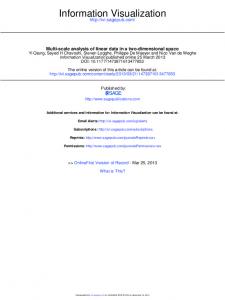
Sixth International Conference on Information Visualisation (IV03), London, U.K. IEEE Press, Los Alamitos, CA, 373-381.
A Model of Synchronous Collaborative Information Visualization Gloria Mark, Keri Carpenter, Alfred Kobsa Department of Information and Computer Science University of California, Irvine {gmark, kcarpent, kobsa}@ics.uci.edu Abstract In this paper we describe a model of the process by which people solve problems using information visualization systems. The model was based on video analysis of forty dyads who performed information visualization tasks in an experiment. We examined the following variables: focused questions vs. free data discovery, remote vs. collocated collaboration, and systems judged to have high and low transparency. The model describes the stages of reasoning and generating solutions with visual data. We found the model to be fairly robust across task type, collaborative setting, and system type, though subtle differences were found. We propose that system transparency can support some stages of the process, and that support is needed in the last stage to help users translate their findings from visual to written representations.
1. Introduction Recently there has been a surge of interest in developing systems to aid in visual data mining and discovery. As more and more real world tasks involve collaborative decision-making about data, the response has been the development of a large number of collaborative visualization environments (see e.g., CoVis [5], Cspray [16], CVD and Cave6D [11], TIDE [19], iScape [3], COVISA [24], and several proto-types of DIVA [20] and [4]). Yet despite the rise of development of systems to support visual data mining, so far user studies have been largely neglected. We maintain that user studies are essential to understand how groups can use visualization systems to make decisions about data. In [12] we performed a user study and discovered that groups were more accurate than individuals in problem-solving with information visualization systems, but only when the system was transparent. (Transparency thereby refers to the system's quality to invoke an easyto-understand system image in users [18].) Yet in this previous study we did not identify the processes by which groups made decisions. We feel this is important in helping to inform design. In this paper we report on new results that address more in-depth the processes underlying collaborative information visualization. This
study is part of a larger investigation to understand differences between collaborative and individual information visualization. Current practice in data analysis and computersupported cooperative work (CSCW) in organizations led us to consider examining several variables in our study. First, there are different purposes for using information visualization systems. In a survey of daily activities of data analysts, [6] found that answering focused questions is currently the most frequently occurring type of data analysis. Focused question tasks are when one has a very specific query in the data. For example, with census data, one might ask, “What proportion of the people in the U.S. are Catholic?” A second type of task is when people use information visualization systems for exploratory analysis. An example of such a free discovery task is when a researcher explores trends in the U.S. urban population using census data. We thus examined how decisionmaking processes are affected by the type of task. Second, current collaborative practice in organizations involves collaboration both when people are collocated and also remote from each other. These distinctions are made in the field of CSCW ([8], [15]). We therefore investigated how different kinds of collaborative configurations affects decision-making processes using information visualization systems. Third, the value of offering system transparency has been shown to provide benefits such as greater visibility for interactivity and feedback [10], satisfaction [14], and in general, an improved understanding of the relationships between system input and output [8]. We would therefore expect that an information visualization system with greater transparency would lead to different kinds of behavior. We also looked at how decisionmaking processes differ when systems offer different degrees of transparency.
1.1.
Related work
[13] developed a methodology for collaborative data mining where participants work at different times. The methodology is neutral with regard to the data mining methods used (which may include information visualization). Participants' activities are far more
independent than is the case in our same-time setting. Based on this methodology, [2] conducted an experiment with teams in four different European countries who performed collaborative data analysis including information visualization. They found "that the added value of collaboration of different groups on this task was much smaller than hoped" and suggest that "information exchange should be made more efficient and synchronization should be improved". Our results reported in this paper caution that even if one makes information exchange much more efficient (by switching from different-time to same-time collaboration, and direct communication) this does not necessarily increase the added value of collaboration.
1.2 Visualization systems used in this study In this experiment, we have chosen two different visualization systems: InfoZoom (formerly Focus [21][22]) and Spotfire (formerly IVEE [1]).1 InfoZoom presents data in three different views. The wide view shows the current data set in a table format, with rows representing the attributes and columns the objects. The compressed view compresses the visualization horizontally to fit the window width. Numeric data values are thereby plotted as horizontal cell-wide bars whose distance from the row bottom corresponds to their values. A row may be sorted in ascending or descending order, with the values in the other rows being rearranged accordingly to make each column represent one object. This operation reveals dependencies between characteristics (like positive or negative correlations between numeric attributes). Hierarchical sorting of two or more attributes is possible as well and can, e.g., reveal differences in the distribution of numeric attributes dependent on one or more non-numeric attributes. In the overview mode, the values in the rows become detached from their objects. Rows here represent the value distributions of attributes in ascending or descending order, and are independent of each other. In all three views, values of (identical adjacent) attributes become textually, numerically or symbolically displayed whenever space permits this, which facilitates the comprehensibility of the data [9]. Fig. 1 shows portions of InfoZoom's compressed mode, with data from a web-based dating service containing users’ self-descriptions. The weights of the individuals are hierarchically sorted in ascending order by their response to the question “Do you participate in sports?” The upper line shows the weight distributions of these groups (there is a small third group that did not answer this question). The lower line shows the average 1
The software versions used were InfoZoom 3.40 EN Professional from humanIT AG (www.humanIT.com) and Spotfire DecisionSite 6.3 from Spotfire, Inc. (www.spotfire.com).
weight per group. Those who engage in sports are heavier than those who do not. InfoZoom's central operation is “zooming” into information subspaces by double-clicking on attribute values, or sets/ranges of values. InfoZoom thereupon shows records only that contain the specific attribute value(s). Spotfire offers several types of mostly familiar
Figure 1: InfoZoom's compressed view visualizations, including scatterplots, bar charts, pie charts, graphs, parallel coordinates, trellises, etc. Unlike in InfoZoom, they are independent stand-alone visualizations. Two variables can be selected for display in the x and y coordinates, and a few additional variables can be selected for coding by color, shape, etc. Fig. 2. shows a bar chart visualization of the average weights by response to the sports question. Focusing on information subspaces is performed by excluding or including attribute values using sliders, checkboxes and radio buttons in the so-called “query device” of the system.
Figure 2: Bar chart visualization in Spotfire
1.2.
System transparency
The design of the interface of information visualization systems uses a variety of approaches. A system is generally regarded as “transparent” if it evokes an easy-to-understand system image in users [18]. Conspicuity of the system’s functionality, for instance through toolbars with well-designed icons, contributes towards system transparency. For information visualization systems, we posit that the ready visibility of
all data dimensions also contributes to system transparency since this enables users to construct more easily a model of the visualized data and the underlying domain. The two systems seem to rank differently in terms of system transparency. In Spotfire, a significant portion of the system's functionality is not immediately visible and directly accessible. Instead, a “Properties” menu must be accessed which contains controls for numerous parameters that can influence the shape of the visualization. On the data visualization side, Spotfire displays relatively few variables that must be deliberately selected. [9] found that Spotfire therefore imposes fairly high "cognitive setup costs" on users: they needed considerable time to choose among the different visualizations that Spotfire offers and to set them up correctly, particularly when solutions included several variables and therefore several steps. Users must plan ahead what variables to use and how to visualize them. Selecting a visualization for the first one or two variables imposes severe restrictions on the display of the remaining variables. The upfront planning must therefore be very thorough and comprehensive so as to avoid dead ends. This planning moreover must be performed without assistance from a visualization and takes considerable time. Users of InfoZoom, in contrast, can rely much more often on visual cues when accessing both data and system functionality. (The only major exceptions are the dialog windows for defining new "derived" variables and for the charting function, both of which violate the otherwise relatively straightforward "click on what you want" paradigm.) [9] found that users can interact very effortlessly with the system. Users can also plan incrementally, i.e. perform a few steps, see how far they have come, and proceed or switch to a different view if the partial plan turned out to be wrong (some users even developed a "click first - think afterwards" problem solving behavior). InfoZoom can therefore be regarded as more transparent than Spotfire.
2. Methodology 2.1.
The Experiment
In this paper we report on a video analysis of subjects performing information visualization tasks in an experiment. One hundred undergraduate students participated who had majors in computer science or engineering at the University of California, Irvine. All subjects had at least one year of computer usage. Subjects were paid $25 for their participation.
Subjects were randomly assigned in a 2 x 3 betweensubjects design, to use either InfoZoom or Spotfire, and to work in three types of configurations: 1. Alone (N=20 subjects), 2. Remotely where two subjects sat at workstations in adjacent rooms using an application-sharing program, Netmeeting, and a speaker phone (N=20 pairs; see Figure 3), or 3. Collocated where two subjects worked side-by-side in front of a SmartBoard, a large 60” diagonal touchsensitive electronic whiteboard (N=20 pairs; see Figure 4). The experiment lasted two hours: 20 minutes of training, 30 minutes of focused questions, and 40 minutes of exploratory data discovery. The remaining time was used for setting equipment and transitions between tasks.
2.2.
Analysis Methods
Subjects were audio and videotaped. We also recorded their screen activity using a screen capture utility. The Alone and Netmeeting subjects were each videotaped using an IBM computer camera mounted on the top of their computer. The Smartboard subjects were videotaped using a regular videocamera set up approximately 5 ft. from the Smartboard. In neither condition could subjects view their images on the video. Two different coders analyzed the videotapes that were projected onto a wall. The screen recordings and videotapes were viewed jointly. Grounded theory [23], a research methodology that involves the systematic generation of theory from data, was used to identify concepts unique and common to the conditions. 75 hours of videotapes were coded.
2.3.
Tasks performed
Subjects performed two types of tasks using the visualization systems. The first task was a focused question task in which subjects viewed anonymized data from an online dating service to answer ten specific questions, such as: "Did males cheat more on their girlfriends than females on their boyfriends?" (other examples are given in Figs. 1 and 2). This was an objective task where correct answers could be measured. The second task was an open-ended discovery task in which subjects were instructed to discover as many findings in the data of a population survey as they could. The data was of general relevance such as Gender, Wage, Years of Experience, etc. and no special background knowledge was required to comprehend it.
Interaction Alone Netmeeting SmartBoard Group Avg.
System InfoZoom Spotfire 116(103) 123(100) 134(101) 176(156) 115(114) 169(145) 125(107) 172(150)
Average 120(101) 154(131) 141(132) 149(129)
Table 1: Average completion time per problem (and standard deviations) in seconds for focused questions Figure 3. Subjects working in Netmeeting condition
Figure 4. Subjects working in the Smartboard condition using InfoZoom
3. Results
3.2. A model of the process collaborative information visualization
of
In this section, we present a model of the process that we found to hold in the group conditions for solving information visualization tasks. We describe how the model can take into account the type of task, the kind of tool used, and the nature of the collaborative setting. Our model is based on an analysis of the verbal interaction and system behavior in the group conditions. This observation of the human-computer interaction supplied numerous clues regarding the sequence and intentions behind the process of solving information visualization tasks. In the Alone condition, we could not infer the reasoning processes, as there was no verbal interaction and the screen activity did not provide enough clues to inform us of the individual subjects’ processes. The model therefore only applies to collaborative settings. We discovered that the process of collaborative information visualization occurs in a series of stages (figure 5). Though some differences existed according to task, tool, and collaborative configuration, the model can still explain the basic processes.
We first report the speed of task completion for the focused question task.
3.1.
Time to completion
Table 1 shows the average completion time per problem for focused questions. An ANOVA indicates that subjects using InfoZoom were significantly faster in solving the problems than subjects using Spotfire: F(1,58)=6.8, p