Abstract. There is a high rate of software development projects that fails. ... A Model to Detect Problems on Scrum-based Software ... waste corporate resources.
A Model to Detect Problems on Scrum-based Software Development Projects
ABSTRACT There is a high rate of software development projects that fails. Whenever problems can be detected ahead of time, software development projects may have better chances of success, and therefore save money and time. In this paper, we present a probabilistic model to help ScrumMasters to apply Scrum in organizations. The model’s goal is to provide information to the project’s ScrumMaster to help him to be aware of the project’s problems and have enough information to guide the team and improve the project’s chances of success. We published a survey to collect data for this study and validated the model by applying it to scenarios. The results obtained so far show that the model is promising.
Categories and Subject Descriptors D.2 [Software Engineering]: Management
General Terms Management
Keywords Agile, Bayesian network, Project Health, Scrum
1.
INTRODUCTION
It is easy to search the Internet and find software development projects horror stories. A study [7] showed that 26 to 34 percent of IT projects fails. Project cancellations waste corporate resources. Furthermore, they require special management skills and critical business decisions. Thus, money and time can be saved if problems in the projects are detected early enough. Boehm [3] identified the top six reasons for software project failure: incomplete requirements, lack of user involvement, lack of resources, unrealistic expectations, lack of executive support and changing requirements and specifications. Most of these reasons are caused by communication and interaction issues between developers and stakeholders.
Permission to make digital or hard copies of all or part of this work for personal or classroom use is granted without fee provided that copies are not made or distributed for profit or commercial advantage and that copies bear this notice and the full citation on the first page. To copy otherwise, to republish, to post on servers or to redistribute to lists, requires prior specific permission and/or a fee. Copyright 200X ACM X-XXXXX-XX-X/XX/XX ...$10.00.
One of the reasons that agile software development processes and frameworks, especially Scrum, have recently become popular on software development is because they focus on improving collaboration between developers and stakeholders, and responding to change of requirements. Even though - in theory - Scrum is a simple framework, it is hard to be applied 1 . Some stakeholders and developers do not understand or are not used to Scrum principles, such as: collaboration between business and development team, selforganization and incremental product development. Thus, applying Scrum on a software development project does not guarantee increased - compared to applying a traditional approach - project’s chances of success. In this paper, we present a probabilistic model to help ScrumMasters to apply Scrum in organizations. The model’s goal is to provide information to the project’s ScrumMaster to help him to be aware of the project’s problems and have enough information to guide the team and improve the project’s chances of success. Software projects have many uncertainties, and one of our challenges was to model them. According to Torkar et al. [20], several researchers have used Bayesian networks to model uncertainties on software projects and had succeeded. Therefore, we decided to model a Scrum-based software development project using a Bayesian network, which was never done before. After deciding to use Bayesian network, the challenge was to define the directed acyclic graph (DAG) and the node probability tables (NPTs). To define the DAG, we identified Scrum-based software development projects’ key factors and their relationship through literature research and discussions with a group of specialists. To define the NPTs, we published a survey, statistically analyzed the collected data and used the information to generate expressions that automatically populate NPTs. Finally, the model was validated incrementally. First, we tested each NPT and compared the actual results with expected results. Afterwards, we validated the model by applying it to scenarios and checked if the model would be useful for a ScrumMaster to identify areas in the project that needs improvement. We concluded that the model is promising.
2.
RELATED WORKS
The most challenging steps to model software projects are identifying the key factors and modeling the uncertainties. It has been the theme of several studies. To identify software projects key factors, researchers collect data from experts through surveys and focus groups [4, 5]. As far as we are concerned, researchers used fuzzy logic [1, 8], Bayesian 1 K. Schwaber. Scrum is Hard and Disruptive. http://www.controlchaos.com/storage/scrumarticles/Scrum%20Is%20Hard%20and%20Disruptive.pdf , 2006.
network [20, 15, 19, 18, 9, 12, 16, 10] and system dynamics [14] to model software development projects. Ahmed and Muzaffar [1] and Engel and Last [8] used fuzzy logic to model software projects to make better cost and time estimates. Ahmed and Muzaffar presented an effort prediction framework that is based on type-2 fuzzy logic to allow handling imprecision and uncertainty inherent in the information available for effort prediction. Ahmed and Muzaffar showed that their studies are promising. Engel and Last presented a model to estimate software testing costs and risks using fuzzy logic paradigm. Engel and Last demonstrated that applying fuzzy logic methodology yields results comparable to estimations based on models using the probabilistic approach. Several researchers used Bayesian networks to model uncertainties on software projects [20, 10]. Nagy et al. [15] presented a quantitative model for project health evaluation that helps decision makers to make decisions earlier. Nagy et al. used a Bayesian network to estimate impact factors that affect software development. Settas et al. [18] and Stamelos [19] used Bayesian networks to help managerial decision making by modeling software project management anti-patterns. Settas et al. provided a mathematical model for a project management anti-pattern that can be used to measure and handle uncertainty in mathematical terms. Fan and Yu [9] and Pendharkar et al. [16] used Bayesian networks to perform risk analysis on software projects. Hearty et al. [12] used a Bayesian network to model the extreme programming (XP) methodology. The model was used to make quantitative effort predictions and risk assessment. However, only two XP practices were introduced into the model and Hearty et al. focused on project level predictions. Kahen et al. [14] described a system dynamics approach to investigate the consequences on long-term evolution of software processes due to decisions made by the managers of these processes. This work aims at contributing to the development of techniques for strategic management, planning and control of long-term software-product evolution. Given the studies we cited above and our model’s goals, the best suited technique is Bayesian network. It provides means to make forecasts, as fuzzy logic and other techniques, but it handles missing data. Also, it provides a simple approach to represent the key factors in a Scrum-based software project and to modify the existing model to best suit a given project needs.
3.
MODEL OVERVIEW
The model is a Bayesian network that represents a Scrumbased software development project composed by one development team. ScrumMasters should use it to identify problems in the project and guide the team to improve the project’s chances of success. The ScrumMaster should observe the status of specific factors from the project and feed the model with the data collected. The model outputs data with probability values that represent the current status of key factors in the project. The ScrumMaster should analyze the data and use the model to identify problems and prioritize the areas that must be improved. The output data can be used to discuss about action points to be taken in order to improve the project’s chances of success with the development team, Product Owner and stakeholders. The prioritization of the areas that must be improved should be a collaborative activity and the model should be used just as a source of information to guide the discussion. Finally, after the prioritization of areas to be improved and action points to be taken, the ScrumMaster guides the team to seek improvement and can use the model again in the future to check the project status.
4.
BUILDING THE MODEL
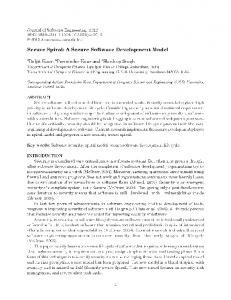
The problem of building the model can be divided into identifying key factors and the relationships, and quantifying the relationships. As stated earlier, the model is a Bayesian network. The DAG that composes the Bayesian network represents the key factors and the relationships in a Scrum software development project. The NPTs that compose the Bayesian network represent the relative intensity between the relationships that have the endpoint in common. Given that, the problem of building the Bayesian network can be divided into: defining the DAG and defining the NPTs. On the DAG, each node represents a key factor, and there is an edge between two nodes whenever they relate to each other. Also, for each edge, the influenced key factor on the relationship is the edge’s endpoint. Furthermore, each key factor has possible states and each one of them has an associated probability. Given that, each key factor represents a set of tuples N = {(s1 , p1 ), . . . , (s|N | , p|N | )}, where si is a possible state and pi is the associated probability. Also, we have the set of key factors F = {N1 , . . . , N|F | }. Furthermore, we have the set of edges R = {(Nj , Nk ) | Nj ⊂ F ∧ Nk ⊂ F }, where Nj is the initial point and Nk is the endpoint of the edge. Therefore, the problem is to find all elements of the sets F and R. To find all elements of the set F , we need to identify all key factors Na , and for each key factor Na , find all the possible states si and associated probability pi , where a ≤ |F | and i ≤ |Na |. Finally, to find all elements of the set R, we need to identify all fj and fk where fj and fk ∈ F. A NPT can be represented by P r = {A|B}, where A is a dependent variable and B is a set of parent nodes. Thus, the set P = {P ri , . . . , P r|P | } represents all the NPTs for the Bayesian network. So, the problem is to find all the elements of the set P . To find them, for each P ri where 1 ≤ i ≤ |P |, we need to quantify the relationship between A and Bj , where 1 ≤ j ≤ |B| and Bj ∈ B. To define the DAG, we broke down the problem into two sub-problems: identify the elements of F and R, and identify the elements of N . Just to clarify, on the first sub-problem we are only interested on the names of the key factors to define the nodes from the DAG and the relationships to connect the nodes and build the DAG. On the second subproblem, we worry about identifying the possible states and its probabilities for each node on the DAG. To solve the first sub-problem of defining the DAG, we researched the literature from respected practitioners 2 [17, 6] to identify the initial elements of F and R. Afterwards, we presented the initial elements (key factors) to eleven experts and refined the sets of elements (key factors) during oneto-one discussions. The experts that participated on these discussions include professionals with experience as ScrumMaster, Scrum Product Owner, Project Manager, Agile Coach, consultants and team leaders in companies located in Brazil, United States of America, Europe and India. We used an incremental procedure to identify the elements of F and R. We identified high-level key factors on software development projects using Scrum and broke them down until we found independent variables that represented key factors that could be observed by a practitioner. To clarify the understanding and because of space constraints for this paper, we only show how we built part of the DAG. We considered that the highest-level factor for any project is the project progress. This way, we identified the name of the first element of F : Project progress. To measure the progress of a Scrum software development project, we need 2 K. Schwaber and J. Sutherland. The Scrum Guide. http://www.scrum.org/Portals/0/Documents/ Scrum%20Guides/Scrum Guide.pdf , 2011.
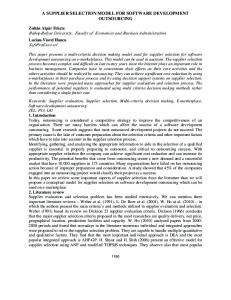
to measure the quality of the product being developed, the product management quality and the work validation quality. In Scrum, the product is built incrementally and the Scrum Product Owner is responsible for product management activities. So, we identified the name of three more elements of F : Product increment quality, Product Owner overall work quality and Work validation quality. For the key factor Work validation quality, the work can be validated during the Sprint Review Meeting or by having stakeholders giving feedback outside of this meeting. During the Sprint Review, the Scrum Product Owner should check the acceptance criteria for each sprint item and the sprint goal, and the stakeholders should give feedback on the results presented during the meeting [17]. Given this, we identified the name of five more elements of F : Sprint Review meeting, Stakeholder feedback outside of the Sprint Review meeting, Acceptance criteria for sprint items, Sprint goal, and Stakeholders feedback. Figure 1 shows the resulting DAG for the key factors explained. To define the rest of the DAG, we followed the same process. At the end of the process of defining the DAG, F was composed of seventy-two elements and R was composed of seventy-one elements. Figure 2 shows the final DAG. Product Increment Quality
Stakeholders Feedback
Sprint goal check
Sprint Review Meeting achieving its goals
Work Validation Quality
Acceptance Criteria check
Stakeholders feedback outside of the Sprint Review Meeting
Project Progress
PO Overall Work Quality
Figure 1: Partial directed acyclic graph for the Bayesian network To solve the second sub-problem of defining the DAG, for each element in F , we identified three ordinal states. By ordinal states, we mean that there is a logical order for the states. For example, for the key factor Product Owner overall quality, we have the states: High quality, Moderate quality, and Low quality. For the associated probabilities pi , we initially set all the independent nodes to 33%. The values of pi will be defined after the ScrumMaster observes the project and sets its values. The next step was to define the NPTs. To define the NPTs, we followed two steps: published a survey to collect data from practitioners and order the relationships by its relative magnitude and developed an algorithm to automatically populate the NPTs given the analysis from the empirical study. For each NPT that needed to be defined, we created a question on the survey. To pre-test the survey, we published an initial draft of the survey using Surveytool 3 to the same group of experts that helped refining the list of key factors. The group of experts responded and commented each question of the survey. Furthermore, we performed one-to-one discussions regarding the survey wording, format and content with each expert. As a result of the pre-test, we defined a template to be used to formulate all questions and decided to include a glossary explaining each technical term used on 3
SurveyTool. http://www.surveytool.com
the survey. One of the most important decisions during the pre-test was regarding the scale used to collect the practitioner’s opinion for each relationship. Initially, the idea was to use interval scale because we could use the results to directly create the mathematical expressions necessary to automatically populate the NPTs. On the other hand, during the pretest we concluded by consensus with all the experts that it would be confusing for practitioners to express their opinion on interval scales and it would increase the survey complexity. More importantly, because it would be confusing and complex to respond to the survey using interval scales, it would not give us accurate enough answers to be used to create the mathematical expressions. So, by consensus, we decided to use the 5-point Likert scale, ranging from ( Very Low Influence) to ( Very High Influence). Consequently, instead of giving us input to directly create the mathematical expressions to populate the NPTs, the survey results gave us, for each question, an ordered list of the relationships by its relative magnitude. The ordered lists were used to create mathematical expressions to populate the NPTs. After the survey was pre-tested, it was published using Surveytool. The survey was published on Scrum-related groups on LinkedIn, Scrum.org authorized to publish the survey on its Facebook Fan Page wall, and ScrumAlliance published it on its Twitter account. For this empirical study, the dependent variables are each relationship between the factors, and the independent variables are each practitioner that answered all the questions from the survey. So, we have seventy-one dependent variables and forty independent variables. The survey has a total of twenty-one questions and for each question we performed a hypothesis test. The goal was to identify if there is any difference between the relative magnitudes of the relationships involved in each question. So, the null hypotheses claim that there is no difference. For questions that had more than two relationships, we performed Friedman test. Otherwise, we performed Wilcoxon test. For the questions that we performed Friedman test, whenever the null hypothesis was refuted, we performed Wilcoxon-NemenyiMcDonald-Thompson post-hoc [13] test with the purpose of ordering the relationships by its relative magnitude. To calculate the margin of error and confidence level given the 2 sample size, we used SS = Z p(1−p) given in the work of C2 Bartlett et al.[2], where SS is sample size, Z is the Z value, p is the percentage picking of a choice and C is the confidence level. Given that the sample size is forty, the margin of error calculated is 13% and the confidence level is 90%. The survey results are presented as follows. • Collective ownership, Team size, Team physical distribution, Members expertise, Members motivation and Members personality influence Development team teamwork skills with the same intensity. • Pair programming and Peer code review has more influence over Code inspection quality than Static code Analysis. • Test coverage analysis, Automated tests and Code refactoring have more influence on Code quality than Documentation. • Code quality, Code integration frequency and Code inspection quality influence Software engineering techniques quality with the same intensity. • Pursue for continuous improvement and Software engineering techniques quality have more influence over Development team competence than Development team teamwork skills.
Figure 2: Complete directed acyclic graph for the Bayesian network • Clear and stable, Critical attributes to satisfy customer needs described, Broad and engaging goal, and Short and concise influence Product vision quality with the same intensity.
• All participants present, Answer the three basic questions and Monitor sprint progress have more influence over Daily Scrum Quality than Fifteen minutes limit. • Daily Scrum quality, Sprint items and priority not changed during Sprint and Development team competence influence Sprint progress with the same intensity.
• Launch date defined, Product vision quality and 3 to 5 top features described influence Release plan with the same intensity.
• Size estimation quality and Task breakdown quality have less influence over Sprint backlog quality than Product backlog items are properly detailed.
• Product backlog management influences Product backlog quality with more intensity than Release plan. • Communicator and negotiator, Available and qualified, Empowered and committed, Leader and team player and Visionary and doer influence Desired personal characteristics of the Product Owner with the same intensity.
• Broad and realistic goal, Team velocity defined, Sprint backlog quality and Sprint length influence Sprint planning quality with the same intensity. • Sprint progress and Sprint planning quality influence Product increment quality with the same intensity.
• Product backlog quality and Product Owner personal characteristics have more intensity over Product Owner overall work quality than Progress tracking.
• Stakeholders feedback, Check if acceptance criteria for sprint items were achieved and Check if sprint goal was achieved influence Sprint Review meeting achieves its goals with the same intensity. • Sprint Review meeting achieves its goals and Stakeholder feedback outside of the Sprint Review meeting influence Work validation quality with the same intensity. • Negotiable, Independent, Considers non-functional requirements when necessary, Estimated size is small and Testable have less influence over Product backlog item properly detailed than Clear acceptance criteria. • Considers risk and Considers technical dependencies have less influence over Product backlog properly ordered than Considers business value. • Product backlog is estimated, Product backlog is emergent, Product backlog properly ordered and Product backlog items properly detailed influence Product backlog management with the same intensity.
• Product Owner overall work quality, Work validation quality and Product increment quality influence Project success with the same intensity. After we performed statistical analysis on the data collected on the survey and reached the conclusions already cited, the next step was to create the mathematical expressions to automatically populate the NPTs. To define the NPTs, we assumed that the node states are ranked and used AgenaRisk 4 characteristic of having a double truncated normal distribution (TNormal distribution) for ranked nodes [11]. The TNormal distribution is characterized by two parameters: mean and variance. The mean is calculated by a weighted expression that reflects that influence of the parent nodes on the given node. The variance reflects the confidence in the result. For all nodes, we assumed that the confidence is high and constant. Given that, we set the variance for all nodes as 5.0E −4 , which is the minimum 4
AgenaRisk. http://www.agenarisk.com
possible value to set the variance on AgenaRisk. AgenaRisk supports four types of weighted expressions: weighted average, weighted minimum, weighted maximum and mix minimum-maximum. For all nodes, we used the weighted average because we assumed that there is not the case that a parent node is essential to skew the central tendency in the ranked node to any of the extreme possible values in our model. To define the weights in the weighted average expressions, we used the results of the statistical analysis on the survey results. For each question in the survey, we generated one weighted expression to automatically populate a NPT. We created an algorithm to translate the ordered list of relative magnitude of relationships into a weighted expression, shown in Algorithm 1. Since we used the 5point Likert scale, we used the scale to compare the relative magnitude of the relationships. For example, a relationship with relative magnitude Very High Influence is greater than a relationship with relative magnitude High Influence. For example, for the node Code inspection quality, the expression is 3A+3B +C, where A represents the relationship Peer code review - Code inspection quality, B represents Pair programming - Code inspection quality and C represents Static code analysis - Code inspection quality. The reasoning behind this algorithm is that we used an ordinal scale and this means that we do not know the difference between the possible values on the Likert scale. For example, we cannot say that the difference between Very High Influence and High Influence is the same as the difference between Moderate Influence and Low Influence. Given this, we ignored the difference on the Likert scale and only focused on if there is difference between the relationships or not. Since the model’s goal is only to raise flags to probable problems and guide the project’s improvement, the NPTs only need to be accurate enough to fulfill this goal. Data: n = the number of relationships Result: Weighted expression to create a NPT for i ← n to 0 do Get the relationship with greatest relative magnitude; Add the relationship to the expression with the weighted value of i; if there are any more relationships with the same relative magnitude then m = the number of additional relationships with the same relative magnitude; current section becomes this one; for j ← m to 0 do Add the relationship to the expression with the weighted value of i end Decrement i by the number of additional relationships you added to the expression; end end Algorithm 1: Algorithm that translates the survey results for a question into a mathematical expression to populate a NPT
5.
VALIDATION
The model validation followed two stages: NPTs validation and model validation. Before validating the entire model, we incrementally tested the outputs of all the NPTs to validate the weighted expressions we calculated. To validate the NPTs, we compared the actual results with the expected results and judged if the actual results were acceptable. Afterwards, we input data from ten different scenarios and
Node Project progress Product Owner overall work quality Product increment quality Work validation quality
Bad 24% 71% 0% 0%
States Moderate 74% 29% 51% 50%
Good 2% 0% 49% 50%
Table 1: Scenario results for highest level nodes in the model judged if the model represents the scenarios properly. Due to space constraints, this paper limits itself to state that the NPTs and model validation were successful and present one of the scenarios used to test the model. This scenario represents a Scrum-based software development project that has a highly capable and organized development team but does not have a person committed and skilled to play the role of the Product Owner. Furthermore, the stakeholders do not collaborate closely with the team. The expected result for this project is to have a small chance of reaching its goals, and the major reasons for the failure are the Product Owner low work quality and lack of proper work validation. After defining this scenario, we defined the values for the input nodes in the model and ran it on AgenaRisk. Table 1 gives the values for the nodes Project progress and its parent nodes, which are the most important nodes for the initial analysis. By analyzing the results on Table 1, we can check that the model results are acceptable, because it raises a flag that the project progress is not going well and the biggest reasons for it are the bad work validation process and bad quality of work performed by the Product Owner. Furthermore, by analyzing the values of the nodes Work validation, Product Owner work quality and their parents, the ScrumMaster can observe which problems are the major sources for having the current values on the node Project progress and use this information to lead the project to improve the chances of succeeding.
6.
THREATS TO VALIDITY
The empirical study has internal and external threats. Regarding the internal threats, there is no control regarding the people that answered the survey and how many times did each person respond it. Furthermore, people might have answered the survey without the necessary dedication and gave answers that did not represent his real point of view. Regarding the external threats, it is not possible to notify all the practitioners with experience on Scrum project management about the existence of the survey. We attempted to minimize these threats by publishing the survey on several professional Scrum project management groups and having ScrumAlliance to publish the survey to its members. There are also threats regarding the entire model. Even though a group of experts evaluated and refined the list of key factors that we identified through literature review, there is still a chance that the key factors identified are not enough to model a Scrum-based software development project. To minimize this threat, we researched the work of respected practitioners and chose a group of experienced and successful experts with background working in different countries. Furthermore, the numbers of answers collected might not be enough to represent the opinion of the most qualified experts on Scrum project management. Finally, the assumptions we made to create the NPTs expressions might not be correct and we might have had success with the validation because we did not use enough scenarios.
7.
CONCLUSIONS
In this paper, we presented a Bayesian network that models a Scrum-based software development project in a way that it can be used by a ScrumMaster to detect problems in the project. We generated a list of the key factors and their relationships in a Scrum-based software development project through literature research and refined it by discussing with a group of specialists. After refining the list of key factors and relationships, we built the Bayesian network’s directed acyclic graph. Furthermore, we published a survey and collected the opinions from forty practitioners to quantify the relative intensity of the relationships. We statistically analyzed the collected data and used them to define the NPTs for the Bayesian network. Afterwards, we tested the calculated NPTs and concluded that the results were acceptable. Finally, we validated the model by using it to represent scenarios and concluded that it would be useful for a ScrumMaster to use it to detect problems and help improving the chances of success of a Scrum-based software development project. Currently, case studies are been performed in two companies located in Brazil. Both companies have been using Scrum for several years. For each company, we are working with one project. For each case study, we consider an individual project as the unit of analysis. Each one is planned to last three months and had the project’s ScrumMaster to use the model and check the output. Preliminary results show that the model is robust to identify problems in a Scrum-based software development project. Currently, both case studies are in the phase of having the ScrumMaster to analyze the data and lead the improvements. The research questions considered are: Is the model robust to identify problems in a software development project using Scrum? and Is the model useful to help ScrumMaster to lead their teams to improve chances of project success?. We expect to show that the model identifies and not ignores problems that impact the project progress and that it is useful for ScrumMasters to use it as a source of information to improve the project’s chances of success. Each case study will be used to answer the research questions. At the end of the three months, each project’s ScrumMaster will be interviewed.
Acknowledgment We would like to thank the people that helped pre-testing the survey, anonymously took the survey and ScrumAlliance for divulging the survey to its members.
8.
REFERENCES
[1] M.A. Ahmed and Z. Muzaffar. Handling imprecision and uncertainty in software development effort prediction: A type-2 fuzzy logic based framework. Information and Software Technology, vol. 51, no. 3, pp. 640-654, 2009. [2] J.E. Bartlett, II, J.E Kotrlik and C.C Higgins. Organizational Research: Determining Appropriate Sample Size in Survey Research. Information Technology, Learning, and Performance Journal, vol. 19, no. 1, pp. 43-50, 2001. [3] B. Boehm. Software Engineering Is a Value-Based Contact Sport. IEEE Software, vol. 19, no. 5, pp. 95-97, 2002. [4] J. Chen, S. Huang. An empirical analysis of the impact of software development problem factor on software maintainability. Journal of Systems and Software, vol. 82, no. 6, pp. 981-992, 2009. [5] T. Chow, D. Cao. A survey study of critical success factors in agile software projects. The Journal of Systems and Software, vol. 81, no. 6, pp. 961-971, 2008.
[6] M. Cohn. Succeeding With Agile Software Development Using Scrum, First Edition, Addison Wesley, 2009. [7] K. El Emam and A.G. Koru. A Replicated Survey of IT Software Project Failures. IEEE Software, September/October, vol. 25, no. 5, pp: 84-90, 2008. [8] A. Engel and M. Last. Modeling software testing costs and risks using fuzzy logic paradigm. Journal of Systems and Software, vol. 80, no. 6, pp. 817-835, 2007. [9] C. Fan and Y. Yu. BBN-based software project risk management. Journal of Systems and Software, vol. 73, no. 2, pp. 193-203, 2004. [10] N.E. Fenton, P. Krause and M. Neil. Software measurement: Uncertainty and causal modeling. IEEE Software, vol. 19, no. 4, pp. 116-122, 2002. [11] N.E. Fenton, M. Neil and J.S. Caballero. Using Ranked Nodes to Model Qualitative Judgments in Bayesian Networks. Proc. of IEEE Transactions on Knowledge and Data Engineering, Vol. 19, Issue 10, pp: 1420-1432, 2007. [12] P. Hearty, N. Fenton, D. Marquez and M. Neil. Predicting project velocity in XP using a learning dynamic Bayesian network model. IEEE Transactions on Software Engineering, vol. 35, no. 1, pp. 124-137, 2009. [13] M. Hollander and D. A. Wolfe. Nonparametric Statistical Methods, Second Edition, New York: John Wiley & Sons, 1999. [14] G. Kahen, M.M. Lehman, J.F. Ramil and P. Wernick. System dynamics modelling of software evolution processes for policy investigation: Approach and example. Journal of Systems and Software, vol. 59, no. 3, pp. 271-281, 2001. [15] A. Nagy, M. Njima, and L. Mkrtchyan.A Bayesian Based Method for Agile Method Software Development Release Planning and Project Health Monitoring. Proc. of the 2010 International Conference on Intelligent Networking and Collaborative Systems, Thessaloniki, Greece, 2010. [16] P.C. Pendharkar, G.H. Subramanian and J.A. Roger. A Probabilistic Model for Predicting Software Development Effort. IEEE Transactions on Software Engineering, vol. 31, no. 7, pp. 615-624, 2005. [17] R. Pichler, Agile Product Management with Scrum: Creating Products That Customers Love. First Edition, Addison Wesley, 2010. [18] D. Settas, S. Gigi, P. Sfetsos, I. Stamelos and V. Gerogiannis. Using Bayesian Belief Networks to Model Software Project Management Antipatterns. Proc. of the Fourth International Conference on Software Engineering Research, Management and Applications (SERA’06), Seattle, Washington, USA, 2006. [19] I. Stamelos. Software project management anti-patterns. Journal of Systems and Software, vol. 83, no. 1, pp. 52-59, 2010. [20] R. Torkar, N.M. Awan, A.K. Alvi and W. Afzal. Predicting Software Test Effort In Iterative Development Using a Dynamic Bayesian Network. Proc. of the 21st IEEE International Symposium on Software Reliability Engineering, San Jose, USA, 2010.