Interspecific competition between species influences their individual growth and performance. Neighborhood effects become especially important in ...
44 International Journal of Information Systems and Social Change, 1(4), 44-65, October-December 2010
A Modeling Approach to Simulate Effects of Intercropping and Interspecific Competition in Arable Crops Heike Knörzer, Universität Hohenheim, Germany Simone Graeff-Hönninger, Universität Hohenheim, Germany Bettina U. Müller, Universität Hohenheim, Germany Hans-Peter Piepho, Universität Hohenheim, Germany Wilhelm Claupein, Universität Hohenheim, Germany
AbStrACt Interspecific competition between species influences their individual growth and performance. Neighborhood effects become especially important in intercropping systems, and modeling approaches could be a useful tool to simulate plant growth under different environmental conditions to help identify appropriate combinations of different crops while managing competition. This study gives an overview of different competition models and their underlying modeling approaches. To model intercropping in terms of neighbouring effects in the context of field boundary cultivation, a new model approach was developed and integrated into the DSSAT model. The results indicate the possibility of simulating general competition and beneficial effects due to different incoming solar radiation and soil temperature in a winter wheat/maize intercropping system. Considering more than the competition factors is important, that is, sunlight, due to changed solar radiation alone not explaining yield differences in all cases. For example, intercropped maize could compensate low radiation due to its high radiation use efficiency. Wheat benefited from the increased solar radiation, but even more from the increased soil temperature. Keywords:
DSSAT, Field Boundary Cultivation, Intercropping, Interspecific Competition, Maize, Solar Radiation, Wheat
IntroDuCtIon Intercropping, defined as growing two or more crops simultaneously on the same field DOI: 10.4018/jissc.2010100104
(Federer, 1993), is widespread all over the world. Especially in smallholder farming like in Africa (e.g., Malawi: 80 – 90% of soybean cultivation), India (17% of arable land) or China (25% of arable land), intercropping is a common cropping system. In times of climate change,
Copyright © 2010, IGI Global. Copying or distributing in print or electronic forms without written permission of IGI Global is prohibited.
International Journal of Information Systems and Social Change, 1(4), 44-65, October-December 2010 45
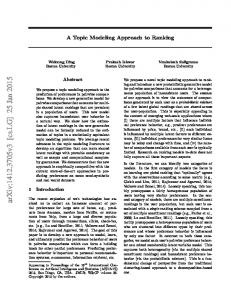
rising food prices, shortage of arable land and food in third world countries and countries with a rapidly increasing population, adjusted traditional cropping systems become more and more important. Farmers tend to utilize every square centimetre of available arable land for production and for diversification of their families’ diet. Besides, there is a so-called unconscious intercropping: Because fields and farm size are very small (0.1 – 2 ha), the sum of field borders can be considered as intercropping in a larger scale (Figure 1). Competition results not only in a survival of the fittest, but also in an optimal use of ecological niches. Agriculture can utilize interspecific competition in order to adjust cropping systems. Some attempts have been made to investigate and improve the various forms of intercropping. An increasing number of these research efforts, especially during the 1990’s, were done by modeling studies in order to simulate interspecific competition. Most models dealing with interspecific competition are common crop grow or crop/weed models extended with a submodel or additional algorithms. In most cases, modeling a cereal-cereal interaction, the crops of choice are a cereal-legume mixture as on one hand, this crop combination is a common and widespread intercropping system due to the advantages of nitrogen supply by the legume and on the
other hand, these species are already included in most crop growth models. Nevertheless, intercropping has always been considered as a secluded cropping system within one field so far. But in African and Asian countries, where intercropping is widespread, the system can be extended to a much larger scale: common on-field intercropping goes along with small field size on average, low mechanization level and hence, small field boundary distances. For example in China, where the average farm size is around 0.1 ha, small fields alternate as stripes with different crops grown on it and turning field boundaries into a kind of unconscious intercropping at a larger scale. To simulate not the secluded intercropping system explicitly, but the field boundaries could turn modeling of a single cropping system into modeling of more regional considered cropping patterns. Competition for light seems to be the most palpable, both, for measurements in the field and for submodeling. However, intercropping cannot be considered solely as a change in available solar radiation within a dominant and understorey canopy, as it influences also soil properties like temperature and moisture, root distribution, microclimate conditions like wind speed and humidity, pests and diseases and nutrient availability for the plants standing next to each other. The possibilities to model
Figure 1. In China, the average field size is very small and fields alternate as stripes with different crops grown on it, turning field boundaries into a kind of unconscious intercropping at a larger scale (A, B). For illustration, field boundaries are marked with white lines (A) and field length and width are between 5 to 20 m.
Copyright © 2010, IGI Global. Copying or distributing in print or electronic forms without written permission of IGI Global is prohibited.
46 International Journal of Information Systems and Social Change, 1(4), 44-65, October-December 2010
intercropping are various: modified weather, climate, soil, and growth factors or plant health indices are imaginable. But as data collection in the field is difficult in intercropping systems, modelers often restrict modeling of intercropping to competition for solar radiation (Ball & Shaffer, 1993; Baumann et al., 2002; Lowenberg-DeBoer et al., 1991; Wiles & Wilkerson, 1991). Even there, weekly plant samples and data collection or samples in more frequent intervals are necessary. However, most models simulate the effect of intercropping using a similar model approach for simulating e.g., competition for solar radiation (see subsection ‘background’). The development of a general competition algorithm to be introduced as a submodel in existing crop models might be a chance to promote the intercropping research turning from evaluating and validating to adjusting cropping systems or to develop appropriate and improved intercropping systems. Nevertheless, research still strives for finding such a general algorithm. In addition, introducing a generalized submodel is not easy to handle all over the various models and needs sometimes a reprogramming of the model. After all, it would be a competition submodel for solar radiation and not for interspecific competition at all. Questions about the hitherto existing status quo of modeling interspecific competition have still remained open: which data input is necessary? Which species are modeled so far? And which equations and algorithms are typical and often used for modeling competition? Besides, how comprehensive should those models be either to take different competition factors into account or to be easy in handling? This article gives an overview of existing interspecific competition models and their model behaviour, and can also be considered as a starting point for further modeling work. So far, the existing intercropping models are only at their very beginning and lead the way to more intensive and practice-related studies. The various approaches seem to be promising and complementing each other, but there is still a gap between the model-
ing of case studies and the application of those models and the adjustment of existing cropping systems, especially to extend them to the aspect of field boundary cultivation. This paper reviews case studies in which various existing intercropping models have been successfully validated. Around 20 different models are considered for modeling interspecific competition in different ways, for example: ALMANAC, APSIM, ERIN, FASSET, GAPS, GROWIT, INTERCOM, KMS, NTRM-MSC, SIRASCA, SODCOM, SOYWEED, STICS, VCROPS and WATERCOMP. Applications range from European organic farming systems to the simulation of maize and legumes growth and development in Africa as well as the prediction of performance of intercropped vegetables (Table 1). Based on the evaluation of existing models, research gaps were identified and a model modification for the simulation of intercropping/field boundary cultivation was developed and introduced in the process-oriented crop growth model DSSAT 4.5 (Decision Support System for Agrotechnology Transfer) (Jones et al., 2003), to extent the view from competition parameters like solar radiation to a whole-species view, e.g., to subdivide not only the canopy layers but also the within species effects and to model one species as the sum of subspecies behaviour under different intercropping related environmental circumstances. Our modified model is more generalized, and offers therefore a more comprehensive and integrative approach.
background There are different strategies introducing interspecific competition or intercropping into existing crop models: -
To supplement, include or link an additional submodel into existing crop growth models, e.g., ◦ STICS (Brisson et al., 2004), ◦ INTERCOM (Baumann et al., 2002; Kropff & van Laar, 1993),
Copyright © 2010, IGI Global. Copying or distributing in print or electronic forms without written permission of IGI Global is prohibited.
International Journal of Information Systems and Social Change, 1(4), 44-65, October-December 2010 47
-
-
-
-
◦ ◦
FASSET (Berntsen et al., 2004), ALMANAC (Kiniry et al., 1992). To incorporate modifications which take account of the competition between intercrops, e.g., ◦ APSIM (Carberry et al., 1996; Nelson et al., 1998), ◦ SODCOM (O’Callaghan et al., 1994). To evaluate new model approaches based on already existing models, e.g., ◦ GAPS (Rossiter & Riha, 1999) based on ALMANAC, ◦ LTCOMP (Wiles & Wilkerson, 1991) based on SOYWEED respectively SOYGRO, ◦ NTRM-MSC (Ball & Shaffer, 1993) based on NTRM, ◦ AUSIM (Adiku et al., 1995) based on APSIM. To evaluate and validate models which allows the assessment of specific management influences like intercropping, e.g., ◦ SUCROS-cotton (Zhang, 2007). To extend simple equation models, e.g., ◦ KMS (Sinoquet et al., 2000) is a simplified Kubelka-Munk equations model which can be extended to multispecies canopies, ◦ VCROPS (Garcia-Barrios et al., 2001) is a further development of Vandermeer’s spatially explicit individualbased mixed crop growth model (Vandermeer, 1989), ◦ WATERCOMP is a modified form of the Penman-Monteith equation (OzierLafontaine et al., 1998).
Furthermore, there are a few unnamed models concerning competition among different species. They mainly deal with a single phenomenon of competition rather than a whole field system, e.g., • • • • •
Kropff and Spitters (1992), Sellami and Sifaoui (1999), Tsubo and Walker (2002), Tsubo et al. (2005), Yokozawa and Hara (1992).
In addition: •
•
GROWIT (Lowenberg-DeBoer et al., 1991) is some kind of exception, because there are no sub-model modules used, but instead a spreadsheet template for making stochastic dominance comparisons. The model EcoSys (Caldwell, 1995; Grant, 1992, 1994) is mainly used for simulating multispecies ecosystems across a landscape and to represent fundamental physical and physiological processes at the scales used especially for plant physiologists and less for agriculture and crop growth purposes.
Models dealing with interspecific competition get more and more important as the postulation for sustainable agricultural production has become a global political issue. Traditional farming systems like intercropping or mixed cropping are known to be the embryonic form of sustainable production concerning biodiversity, resource use efficiency and yield stability. As field trials are time consuming and expensive, models are the alternatives. They help decision makers by reducing time and human resources as well as researchers to provide a framework for scientific cooperation (Jones et al., 2003). Intercropping or competition models can be roughly classified: a) those which are able to model plant growth within a field or even farm scale, taking soil, atmosphere and management information into account in a more dynamic and mechanistic way, and b) those which are more specified or simplified to single intercropping phenomenon like partitioning of solar radiation (Tsubo & Walker, 2002) or self thinning (Yokozawa & Hara, 1992) and are more static and empirical. There are examples for both categories in the literature (Table 1): a) ALMANAC APSIM AUSIM FASSET INTERCOM STICS
Copyright © 2010, IGI Global. Copying or distributing in print or electronic forms without written permission of IGI Global is prohibited.
48 International Journal of Information Systems and Social Change, 1(4), 44-65, October-December 2010
Table 1. Overview of plant and crop growth models simulating interspecific competition and/ or intercropping systems Model
Cropping System
Model type
Source
ALMANAC
Maize and soybean
Dynamic, process-oriented plant growth, water balance and nutrient balances model
Kiniry and Williams, 1995
APSIM
Maize with leguminous shrub hedgerows for tropical farming systems in developing countries Rotation of sorghum/maize or crops/ley pasture or crop with an understorey of volunteer legume in northern Australia
Flexible software system for simulating agricultural production systems, different soil, biological and managerial processes are taken into account arising from interactions between different crops and pasture grown in rotation
Carberry et al., 1996; Nelson et al., 1998
AUSIM
Maize and cowpea
Morphological, physiological and phonological model by linking the respective sole crop models
Adiku et al., 1995
FASSET
Pea and spring barley
Dynamic whole-farm model
GAPS
Dynamic simulation of interspecies competition in agricultural systems
Dynamic model of the soilplant-atmosphere systems where multiple plant species are grown in competition
Rossiter and Riha, 1999
GROWIT
Millet-cowpea
Generic framework using a spreadsheet for making stochastic dominance comparisons, estimates plant growth by integrating over a continuous growth function depending on air temperature
Lowenberg-DeBoer et al., 1991
INTERCOM
Celery and leek
Process-based eco-physiological model, simulates dynamically competition processes based on physiological. morphological and phenological processes
Baumann et al., 2002
SODCOM
Maize and beans in Kenya
Dynamic and mechanistic model taking especially physiological, morphological and phenological as well as soil moisture components into account
O’Callaghan et al., 1994
STICS
Pea and barley in European organic farming Gliricidia sepium, natural pasture C4 grass and maize/canavalia and maize/sorghum
Whole-field soil-plant atmosphere model over one or several crop cycles, simulates a crop situation for which a physical medium and a crop management schedule can be determined
Brisson et al., 2004; Jensen, 2006
VCROPS
Greenhouse diculture with radish and bushbean
A further developed spatially explicit individual-based mixed crop growth model to simulate individual plant growth and to perform statistical analysis of deterministic and stochastic versions of the model
García-Barrios et al., 2001
Berntsen et al., 2004
continued on following page
Copyright © 2010, IGI Global. Copying or distributing in print or electronic forms without written permission of IGI Global is prohibited.
International Journal of Information Systems and Social Change, 1(4), 44-65, October-December 2010 49
Table 1. continued WATERCOMP
Maize and sorghum in CentralAmerica
Physically based framework including a radiative transfer model associated with a transpirationpartitioning model with special regard to spatial aspects of root competition at the scale of static root systems
Ozier-Lafontaine et al., 1998
Canopy photosynthesis model in plant populations
Not specified
Dynamic model for growth and mortality of individual plants in a stand assuming an even-aged plant population which grows in a homogenous environment
Yokozawa and Hara, 1992
Extended IBSNAT models
Beangrow and Ceres-maize models
Hypothetical crop model of simulating a cereal-legume intercrop dealing with only part of the intercropping phenomenon
Thornton et al., 1990
Model for plant and crop growth allowing for competition for light
Cabbage and carrot
Plant growth model applicable to the isolated plant or to even-aged plants, simple mathematical relation to describe the efficiency of light interception
Aikman and Benjamin, 1994
Radiation transmission model and simple model for intercropping
Maize and bean under semi-arid conditions
Instantaneous, radiation transmission model comparison between a geometrical versus a statistical method, simple model to be employed to develop other cereal-legume intercrop models for semi-arid regions
Tsubo and Walker, 2002; Tsubo et al., 2005
b) Canopy photosynthesis model in plant populations Radiation transmission model and simple model for intercropping Competition between (intercropped) species is mainly competition for water, nutrients and light respectively solar radiation. Furthermore, one can distinguish between above- and below-ground interaction and competition, but also beneficial and synergistic effects can occur (Inal et al., 2007; Li et al., 2001ab; Song et al., 2007; Zhang & Li, 2003). But it is striking that almost all models deal solely with competition for light (Baumann et al., 2002; Brisson et al., 2004; Sellami & Sifaoui, 1999; Tsubo & Walker, 2002; Wiles & Wilkerson, 1991), sometimes in combination with competition for water
(Lowenberg-DeBoer et al., 1991; O’Callaghan et al., 1994; Ozier-Lafontaine et al., 1998). Concerning multi-species water and nutrient supply most models use similar or even the same basic and common soil properties, which they use for sole crop situations neglecting aspects and characteristics of competing root systems making some species more efficient for water uptake than others. Beneficial interactions especially for nutrient supply like nitrogen (N), phosphorus (P), potassium (K) and iron (Fe) are rarely taken into account. It is known, however, that the structure and distribution characteristics of roots are more important than their own absorption capacity in the competition for water and solutes (Ozier-Lafontaine et al., 1995). Light partitioning is the most frequently modeled competition resource. Morphological,
Copyright © 2010, IGI Global. Copying or distributing in print or electronic forms without written permission of IGI Global is prohibited.
50 International Journal of Information Systems and Social Change, 1(4), 44-65, October-December 2010
physiological and also phenological differences between species decide whether a species has an advantage or a disadvantage in intercropping. In most cases, the earlier developing or the taller species becomes to be the dominant one, the other the understorey. Parts of those understorey species are shaded from the dominant one. The shading impact depends on the species height, their development stage and aggressivity, the duration of competition and the distance from the understorey to the dominant species (row effect). The amount of captured solar radiation decreases for the understorey species and has to be taken into account during modeling. Determinants of light partitioning are vertical dominance and differences in foliage inclination, leaf area and plant height. As solar radiation is reduced, also temperature (Zhang, 2007) within the microclimate of the shaded understorey species can decline as a secondary effect of competition for light. Light capture ability as well as space occupation influence competition impact and crop performance. Accordingly, radiation models for
multispecies canopies can be classified into four groups (Sinoquet & Caldwell, 1995): 1. 2. 3.
4.
Geometrical models which schematized plants or rows as simple shapes arranged in space according to the planting pattern. Models based on the turbid layer medium analogy where the canopy structure is described by statistical distributions. Hybrid models combine geometrical shapes as subcanopies envelops with statistical description of leaf area distribution within those envelops. 3D plant descriptions.
For process-oriented models, the turbid layer medium analogy has proven to be the most useful. Almost all simulation models devoted to light partitioning between species are based on the classical Beer’s law – but modified for a two-species-purpose - and compute light transmission as a negative exponential function of the downward cumulated leaf area index (LAI) (Table 1).
Table 2. LER1, RYT2, RLO3 and Aab4 for inter- and monocropped wheat and maize in 2007/08 Tinsley, 2004 LER1
Jolliffe, 1997 RYT2
Jolliffe, 1997 RLO3
Li et al., 2001a Amw4
borderline
1.30
1.16
1.16
-0.819
3./4. row rp. 2-4 m
0.94
0.97
0.97
5./6. row rp. 2-4 m
0.94
0.97
0.97
monocropping
1.00
1.00
1.00
Land equivalent ratio(LER) (Tinsley, 2004) = [(Y1m-Y1i)+(Y2m-Y2i)]/100 Ym = yield in monoculture Yi = yield in intercropping 1, 2 = first and second crop 2 Relative yield ratio (RYT) (Jolliffe,1997) = [(Yi)m / (Yi)p] + [(Yj)m / (Yj)m] Y = yield i, j = species 1 and 2 m = species mixture p = pure stand 3 Relative land output (RLO) (Jolliffe, 1997) = (Yi + Yj + …)m / (Yi + Yj + …)p 4 Aggressivity factor (Aab) (Li et al., 2001a) = [Yia / (Ysa * Fa)] – [Yib / (Ysb * Fb)] Y = yield s = sole cropping i = intercropping F = proportion of the area occupied by the crops in intercropping A, B = crop 1 and 2 1
Copyright © 2010, IGI Global. Copying or distributing in print or electronic forms without written permission of IGI Global is prohibited.
International Journal of Information Systems and Social Change, 1(4), 44-65, October-December 2010 51
Table 3. Results of the statistical analysis to detect differences between rows/subplots with different distances from the field border or differences between monocropped and intercropped plots indicated that intercropping was a field border effect. Rows/subplots sharing no letter are significantly different at α = 5%. Intercropping system
Grain yield differences between different rows/subplots1 (t ha-1) Row 1+2a to row 3+4a Row 1+2a to row 5+6a Row 1+2a to row 7+8a Row 3+4a to row 5+6a Row 3+4a to row 7+8a Row 5+6a to row 7+8a
0.1 0.2 0.4 0.0 0.5 0.5
Row 1+2a to row 3+4b, c, d Row 1+2a to row 5+6b, c Row 1+2a to row 7+8d Row 3+4b, c, d to row 5+6b, c Row 3+4b, c, d to row 7+8d Row 5+6b, c to row 7+8d
1.5 2.0 1.2 0.5 0.3 0.8
Maize (intercropped with peanut)
Row 1a to row 2a, b Row 1a to row 3a, b, c Row 1a to row 4b, c Row 1a to row 5c Row 1a to row 6b, c Row 1a to row 7b, c Row 2a, b to row 3a, b, c Row 2a, b to row 4b, c Row 2a, b to row 5c Row 2a, b to row 6b, c Row 2a, b to row 7b, c Row 3a, b, c to row 4b, c Row 3a, b, c to row 5c Row 3a, b, c to row 6b, c Row 3a, b, c to row 7b, c Row 4b, c to row 5c Row 4b, c to row 6b, c Row 4b, c to row 7b, c Row 5c to row 6b, c Row 5c to row 7b, c Row Row 6c to row 7b,c
0.9 1.4 2.6 2.7 2.5 2.2 0.5 1.6 1.7 1.6 1.3 1.1 1.2 1.1 0.8 0.1 0.0 0.3 0.2 0.4 0.3
Wheat (intercropped with maize)
0-2 ma to 2-4 mb 0-2 ma to 4-6 mb 2-4 mb to 4-6 mb
3.4 3.3 0.1
Pea (intercropped with maize)
0-2 ma to 2-4 ma 0-2 ma to 4-6 ma 2-4 ma to 4-6 ma
0.05 0.06 0.01
Maize (intercropped with wheat)
Maize (intercropped with pea)
continued on following page
Copyright © 2010, IGI Global. Copying or distributing in print or electronic forms without written permission of IGI Global is prohibited.
52 International Journal of Information Systems and Social Change, 1(4), 44-65, October-December 2010
Table 3. continued
Peanut (intercropped with maize)
Row 1c, d to row 2b, c, d Row 1c, d to row 3c Row 1c, d to rows 4+5a, d Row 1c, d to rows 6+7a, b Row 1c, d to rows 8+9a Row 2b, c, d to row 3c Row 2b, c, d to rows 4+5a, d Row 2b, c, d to rows 6+7a, b Row 2b, c, d to rows 8+9a Row 3c to rows 4+5a, d Row 3c to rows 6+7a, b Row 3c to rows 8+9a Rows 4+5a, d to rows 6+7a, b Rows 4+5a, d to rows 8+9a Rows 6+7a, b to rows 8+9a
nEW APProACH for MoDElInG IntErCroPPInG WItH SPECIAl rEGArD to fIElD bounDAry CultIVAtIon In the current literature, intercropping was considered either as the performance of a secluded cropping system within one field or area and with a specific species combination like maize/ legumes or as a spatially explicit occurrence of interspecific competition between different species, especially crops/weeds. Driving forces for modeling were the geometrical shape or the influence of vertical distribution of leaves of a species (Baumann et al., 2002; Berntsen et al., 2004; Wiles & Wilkerson, 1991), the assumption of a reduced leaf area index of the understorey species when shading of the dominant species occurs (O’Callaghan et al., 1994; Rossiter & Riha, 1999), the dividing of the canopies into three different canopy layers (Brisson et al., 2004; Jensen, 2006; Sinoquet et al., 1990) and to calculate – or better estimate – the incoming solar radiation for both species according to a modified Beer’s law, taking crop coefficients, leaf area and the height of the neighboring plant into account. The approach in this study refers in a first step (scenario 1) to the traditional approach of using competition for solar radiation as baseline model. In a second step (scenario 2 and 3) not
0.33 0.10 0.67 0.81 1.22 0.42 0.34 0.48 0.90 0.76 0.91 1.32 0.15 0.56 0.41
only competition for solar radiation was taken into account, but also a more general approach to make it possible to transfer the basic assumptions from one intercropping system to an overall intercropping system by evaluating a minimum data set, easily being collected in a field and not restricted to one area. Special regard was taken to the so called unconscious intercropping or field boundary cultivation, because of its importance in African or Asian countries where intercropping plays a major role and field sizes are very small. Three different scenarios were studied to evaluate the model. Scenario 1 takes only competition for solar radiation into account, scenario 2 deals with changes in soil albedo and scenario 3 includes besides competition for solar radiation also changes in soil temperature. Field trials (for detailed description of field trials: see next subsection), conducted in southwest Germany and in the North China Plain with different species combination, showed that if synergistic or competition effects of intercropping occur, they are mainly based on border row effects (Table 3). Significant differences in grain yield, dry matter accumulation, leaf area etc. from monocropped in comparison to intercropped species were mostly restricted to the first four rows wherefore intercropping could be regarded as borderline or field boundary effect.
Copyright © 2010, IGI Global. Copying or distributing in print or electronic forms without written permission of IGI Global is prohibited.
International Journal of Information Systems and Social Change, 1(4), 44-65, October-December 2010 53
Table 4. Genetic parameters of wheat and maize and their values used in the model evaluation winter wheat parameters
description
value
P1V
sensitivity to vernalisation
20
P1D
sensitivity to photoperiod
30
P5
grain filling duration
750
G1
kernel number per unit weight at anthesis
25
G2
kernel weight under optimum conditions
40
G3
standard stem and spike dry weight at maturity
0.5
PHINT
phylochron interval
80
maize parameters
description
value
P1
growing degree days from emergence to end of juvenile phase
110
P2
photoperiod sensitivity
0.05
P5
cumulative growing degree days from silking to maturity
615
G2
potential kernel number
615.0
G3
potential kernel growth rate
8.2
PHINT
phylochron interval
38.9
Material and Methods Field trials were conducted in southwest Germany (48.46°N and 8.56°E) at the University of Hohenheim’s experimental station ‘Ihinger Hof’ during 2007/08. The average rainfall per year is around 690 mm with an average temperature of 7.9°C. The soils are mainly keuper with loess layers. Alternate plots of winter wheat and maize were arranged within a restricted randomized complete block design and four replications. Randomization was restricted due to the strip intercropping character of the experiment. Each plot was 10 x 10 m for wheat and 12 x 10 m for maize respectively and included five subplots (2 x 10 m) for wheat and eight subplots (2 rows x 10 m) for maize. The previous crop for all species was sugar beet and the soil preparation was a reduced tillage system with a chisel plough. Within each subplot data was collected in order to detect differences between the boundaries, different distances from the boundary and the
monocropping. The plots were big enough to reflect monocropping within the central subplots. Wheat was sown in October 2007 with a row spacing of 13 cm, a row orientation from north to south and a plant density of 300 plants per m2. Maize was sown in May 2008 with a row spacing of 75 cm, a row orientation from north to south and a plant density of 10 plants per m2. During the growing season, neither water nor nitrogen stress occurred so that differences in plant growth and yield performance could be attributed onto intra- and interspecific competition. Wheat was fertilized with 160 kg N ha-1, splitted into three dispensations (60/60/40) of Nitro-chalk. Maize was fertilized once with 160 kg N ha-1 (ENTEC). Plant protection was carried out according to ‘Good Agricultural Practice’. During the growing season, three temporal harvests were carried out and dry matter, ratio of stems to leaves and the nitrogen concentration of plants were analysed. Between flowering and maturity, three time harvest were taken to
Copyright © 2010, IGI Global. Copying or distributing in print or electronic forms without written permission of IGI Global is prohibited.
54 International Journal of Information Systems and Social Change, 1(4), 44-65, October-December 2010
determine grain weight growing rates. In addition, Nmin content of soil and number of plants per m² were determined. LAI was measured destructively according to the DSSAT guide with the LI-3100 Area Meter (LI-COR, Lincoln/ Nebraska USA); soil moisture was measured with the Trime-TDR-system (time domain reflectometry) from IMKO GmbH (Ettlingen/ Germany) and soil temperature was determined in 2 and 15 cm soil depth with the testo 925 (Testo AG, Lenzkirch/Germany) on a weekly basis as well as solar radiation, growing stages and plant height. Specific DSSAT cultivar coefficients like the phylochron interval in thermal days, grain filling duration in thermal days, the standard kernel size related to kernel filling rate and the standard dry-weight of a single tiller at maturity for wheat were determined and yield and yield components were measured after the final harvest. Phylochron interval, kernel filling rate, maximum possible number of kernels per plant and thermal time from seedling emergence to the end of the juvenile phase expressed in degree days were determined for maize (DSSAT 4.5). Furthermore, the land equivalent ratio (LER) and an aggressivity factor (Aab) (Table 2) were calculated for both the intercropping/field boundary and the monocropping. When Aab > 0, the competitive ability of crop A exceeds that of crop B. Concerning maize and wheat, the agressivity factor (Amw) was -0.818 indicating that wheat was the more aggressive competitor and was more successful in catching growing factors, e.g., nitrogen, thus being important for further modeling approaches. Statistical analysis (Table 3) to detect significance between rows/subplots within a plot with different distances from the plot border was done separately for each species and intercropping system in the trial. Analysis was done using the mixed procedure of SAS 9.2 (SAS Institute, 2009) according the model: trait = replicate + position, assuming independent errors of rows within plots. The factor position had levels depending on treatment (see Table 3). Differences of least squares means for positions were subjected to t-tests. Signifi-
cant differences found were restricted to the first few rows reflecting the intercropping situation and giving evidence of intercropping being a field border effect (Table 3).
Model Evaluation For the model approach, the DSSAT crop growth model was applied. It is a process-oriented crop model taking soil-plant-atmosphere and -management systems into account. It is designed for helping researchers to adapt and test the cropping system model itself as well as for those operating the DSSAT model to simulate production over time and space for different purposes (Jones et al., 2003). The collected dataset in this case study was used to evaluate a model extension for intercropping including crop management like fertilization, influence of previous crop (sugar beet), soil and genotype characteristics and weather data (© Hohenheimer Klimadaten). Phenology and growth data were used to evaluate the genetic parameters in a first step (Table 4). Whereas the genotype and soil characteristics as well as the management did not differ between monocropped and intercropped systems and were taken as constants during simulation, the microclimate changed. Especially the influence of shading and the soil temperature (Figure 2) within the boundaries were different between monocropped and intercropped situations and thus being the basic for the model approach. The approach was carried out in a stepwise fashion, creating different scenarios. Thus, in a first model run, the identical DSSAT project-oriented programming was used for the intercropping model as well as for the monocropping model except for modified solar radiation. In scenario 2, soil albedo was modified in order to take increased soil temperature into account. In scenario 3, top soil temperature in addition with a higher agressivity factor for wheat was taken furthermore into account including the modification of the initial nitrogen conditions.
Copyright © 2010, IGI Global. Copying or distributing in print or electronic forms without written permission of IGI Global is prohibited.
International Journal of Information Systems and Social Change, 1(4), 44-65, October-December 2010 55
Figure 2. Differences in average soil temperature under monocropped and intercropped wheat in June and July 2008
The increased ability of intercropped wheat (Amw) to acquire more nitrogen (N) in association with the increased soil temperature coming along with an increased mineralization had to be factored in the modeling. At the field boundary, from sowing date until the sowing of maize in May, wheat faced no interspecific competition and less intraspecific competition. Because of the increased top soil temperature within the first rows – 4°C difference on average - and the higher agressivity of wheat in comparison to maize, our hypothesis was that the mineralization of nitrogen might be favoured and intercropped wheat might get more nitrogen than its monocropped equivalent. The previous crop, sugar beet, had an average N surplus of about 55 kg N ha-1 (Reisch & Knecht, 1995) after harvest. As the sugar beet leaves were not removed, they could also be calculated as organic amendment comparable to 140 kg N ha-1 (Stammdatenblätter “Nährstoffvergleich FeldStall” LEL Schwäbisch (Gmünd et al., 2007). The management system was a reduced tillage system. Lower soil temperature and a reduced mineralization at the beginning of the growing season in comparison to tillage systems are typical for reduced tillage systems (Koeller & Linke, 2001). Collected Nmin-samples after the harvest of wheat showed a similar amount of nitrate in the soil for intercropping (20 kg NO3ha-1) as well as monocropping (22 kg NO3 ha-1)
with only 2 kg NO3 ha-1 differences. However, making up the balance between intercropped and monocropped plots concerning nitrogen proportion and taking Nmin at the beginning of the growing season, Nmin after harvest, amount of fertilization and N withdrawal from grain and straw into account, there was a N gap between intercropping and monocropping. Wheat border rows got approximately 130 kg N ha-1 more until anthesis. Hence, the changed microclimate within the field boundary might lead to a better N supply of wheat in the first rows (Figure 2). In comparison to most other modeling approaches, changes in incoming solar radiation were neither calculated according to a modified Beer’s law nor by dividing the canopy into different layers nor assuming that LAI was reduced from the time shading occurs. Instead, a linear shading pattern in percentage based on weekly sunlight measurements was determined with regard to the height of neighbouring plants. Solar radiation of monocropped species were set as 0% shading meaning that the monocropping system was driven by the original weather data. Then, the light differences of the border rows in proportion to the monocrops were calculated. The shading pattern was subjected to the plant height of the neighbouring species resulting in a linear function given as:
Copyright © 2010, IGI Global. Copying or distributing in print or electronic forms without written permission of IGI Global is prohibited.
56 International Journal of Information Systems and Social Change, 1(4), 44-65, October-December 2010
•
Shading pattern within wheat: (1a)
The daily solar radiation (SRAD) expressed in MJ/m²/d was calculated according to (1) and (2) and modified for the weather input as follows:
with s = shading of wheat border rows (%), h = plant height of maize. (3a) •
Shading pattern within maize: (1b)
s = -19.724h + 1594.2 (R² = 0.975), with s = shading of maize border rows (%), h = plant height of wheat. Logistic models were fitted by nonlinear least squares using the NLIN procedure of the SAS System: •
Plant height of wheat: (2a)
h = 85.9882/(1 + exp(4.7888-0.059*DAS)),
with h = plant height,
(3b) Summarized, the modeling approach rested not upon introducing a competition sub-model. Instead, the climate and microclimate parameters were modified. Subsequently, the model and the genetic coefficients were evaluated and calibrated for the monocropping system and further used for the intercropping system. The correlation coefficient (R2) and the root mean square error (RMSE) were used to estimate the variation between simulated and observed values.
results of Wheat Modeling Experiments
DAS = days after sowing. • Plant height of maize:
(2b)
h = 300.5/(1 + exp(13.1402-0.073*DAS)),
with h = plant height, DAS = days after sowing.
Wheat benefited from being intercropped with maize. Grain yield of intercropped wheat was around 3 t ha-1 higher in comparison to monocropped wheat due to a higher number of tillers. The increased tiller number led to an increased dry matter yield of intercropped wheat of about 8 t ha-1 in comparison to monocropped wheat. The thousand kernel weight (TKW) in intercropped wheat was slightly reduced (Table 5).
Table 5. Mean comparisons of grain yield, TKW, tiller number and dry matter of intercropped and monocropped wheat in 2007/08 Treatment
Grain yield (kg [dm] ha-1)
TKW (g)
Tiller number (no./m-2)
Dry matter (kg [dm] ha-1)
border rows within a plot
12400a
31b
864a
24506a
inner rows within a plot
9054
34
630
16854b
ab
b
a
b
letters indicate significant differences between borderline (intercropping) and monocropping subplots at α = 0.05
Copyright © 2010, IGI Global. Copying or distributing in print or electronic forms without written permission of IGI Global is prohibited.
International Journal of Information Systems and Social Change, 1(4), 44-65, October-December 2010 57
Scenario 1: Modifying Light Interception According to most other intercropping models, the DSSAT approach started with modifying the solar radiation as it was expected to be the competition factor with the highest influence on crop performance within intercropping systems. A similar approach to the turbid layer medium analogy was used but instead of using a submodel for solar radiation, the weather file in total was changed according to the determined shading pattern algorithms described before (3a) and evaluated throughout measured data. The monocropping model used the standard weather file and an initial N input of 55 kg N ha-1 according to the calculated N surplus due to sugar beet as previous crop. The intercropping model used the modified solar radiation (3a) weather file without changing or modifying any other input parameters like soil, management and cultivar specifics. The results of model evaluation for the monocropped wheat showed a good fit between simulated and observed grain yield as well as dry matter accumulation even though the model did not simulate the slope of the sigmoid curve for grain yield adequately. The R2 value was 0.96 for grain yield and 0.97 for dry matter yield respectively. Measured grain yield was 9.1 t ha-1, simulated grain yield was 9.0 t ha-1. Measured dry matter yield was 16.9 t ha-1, simulated dry matter yield was 16.7 t ha-1. The RMSE for grain yield at maturity was 49, the RMSE for dry matter accumulation at maturity was 127, indicating a model error of 0.54% and 0.75% respectively. Running the intercropping model with the modified solar radiation alone only 10.3 t ha-1 grain yield was simulated instead of 12.4 t ha-1 according to the collected dataset (Table 5). Although the additional solar radiation obtained by the border rows accounted for 1.3 t ha-1 additional grain yield, a yield gap of approximately 2 t ha-1 remains still unexplained indicating that the increased grain yield could not only be explained by the higher solar radiation wheat border rows obtained until the maize reached a height of 1.4 m and shading occurred
up to beginning of July. Similar observations were made for dry matter accumulation. Instead of the measured 24.5 t ha-1, DSSAT simulated only 19.4 t ha-1. The dry matter yield difference between monocropped and intercropped plots was 7.7 t ha-1, but only 2.5 t ha-1 additional dry matter could be explained by the higher amount of incoming solar radiation during three-quarters of the growing season. The R2 value was 0.99 for grain yield and 0.97 for dry matter yield. The RMSE for grain yield at maturity was 2071, the RMSE for dry matter accumulation at maturity was 5083.
Scenario 2: Modifying Light Interception and Soil Albedo As differences in obtained sunlight could not fully explain the yield gap between monocropped and intercropped subplots, other parameters seemed to have an influence on crop performance. During the growing season there was no water stress so that differences in water availability could be excluded. Between April and August 2008, during co-existence of wheat and maize, there was 450 mm rainfall within 4.5 months. From the end of May until the beginning of July, the average soil moisture (30 cm soil depth) under maize was 48 vol % in both, monocropping and intercropping plots with the minimum value of 36 vol % under monocropped maize in beginning of July and the maximum value of 52 vol % under monocropped maize in beginning of June. In addition, the plots were sown on a relatively homogenous field, so that great differences in spatial and temporal yield variability due to soil inhomogeneity dropped, too. However, because of the increased soil temperature and the increase in bare soil placements within the first rows it was assumed that there might have been differences in soil albedo. In the model the reflectance of the solar radiation from the soil surface accounts for potential evaporation from the soil surface. Whereas in the monocropped model the soil albedo value was set to 0.13, in the intercropped version it was reduced to 0.10.
Copyright © 2010, IGI Global. Copying or distributing in print or electronic forms without written permission of IGI Global is prohibited.
58 International Journal of Information Systems and Social Change, 1(4), 44-65, October-December 2010
Running the model showed that soil albedo had no great influence on crop performance. Grain yield at maturity increased only 7 kg ha-1 and dry matter yield at maturity increased 11 kg ha-1 respectively. Adjusted soil albedo in conjunction with sufficient soil water availability as an indicator for potential evaporation slightly changed performance of plants along field boundaries but could be neglected.
Scenario 3: Modifying Light Interception, Soil Albedo and Initial Conditions At the field boundary, from sowing date until the sowing of maize in May, wheat faced no inter-specific competition and less intra-specific competition wherefore microclimate changed. Most obvious, incoming solar radiation and top soil temperature increased. In addition wheat had a higher agressivity potential in comparison to maize. Hence, the mineralization of nitrogen was favoured and intercropped wheat got more nitrogen than its monocropped equivalent. Modifying the intercropped model once more, an additional initial N input of 190 kg N ha-1 (Nmin + sugar beet leaves + 40 kg N ha-1 surplus) was given, taking the increased mineralization and the competitiveness of wheat into account. The initial condition for intercropped wheat was without limited nitrogen. As a result, the intercropping model fitted well with R2 values of 0.98 for dry matter yield and 0.96 for grain yield (Figure 3). The measured dry matter yield was 24.5 t ha-1, the simulated 23.4 t ha-1. The measured as well as the simulated grain yield was 12.4 t ha-1. Wheat border rows used the increased sunlight, but foremost solar radiation in addition to increased N availability could adequately explain the grain yield increase. In comparison to other model approaches, where only solar radiation was taken into account as competition factor, DSSAT showed that other factors have to be regarded when intercropping should be simulated adequately. Otherwise, one competition factor is overestimated. A similar setting was given not only for the grain yield but also for
dry matter yield. Running the model without additional N supply and solely with the modified solar radiation input, explained 3.4 t ha-1 additional dry matter yield. By contrast, running the model with additional N supply, dry matter yield increased to about 6.5 t ha-1. The RMSE for grain yield at maturity was 2, the RMSE for dry matter accumulation at maturity was 1146, indicating a model error of 0.02% and 4.68% respectively.
results of Maize Modeling Experiments Maize intercropped with wheat suffered at the beginning of the growing season because of the competitiveness of wheat and reacted with less plant height (~ 0.5 m) and less dry matter accumulation (Table 7). But as wheat was harvested around three months earlier than maize, maize showed a recovery-compensation growth, already described by Li et al (2001b), resulting in maize borderline yields (rows at plot borders) at least as high as maize in monocropping (rows in plot centre). The monocropped model was run taking the measured Nmin values as well as the N surplus of sugar beet into account. In contrast, the intercropped model was run with N stress at the beginning of the growing season, so starting with less N content in the soil than the monocropped equivalent in order to take into account the increased competitiveness of wheat for N acquisition in comparison to maize. For example, the nitrogen withdrawal from wheat straw from the border rows (76 kg N ha-1) was two times higher than the nitrogen withdrawal from monocropped wheat subplots (35 kg N ha-1). Due to the recovery-compensation growth, the simulation of both monocropped and intercropped maize should be similar to each other (Figure 4), although the intercropping model was run with the modified solar radiation file. The steep slope of grain filling could not be simulated adequately, nevertheless, the simulation of grain yield at maturity showed a good fit between measured and observed grain yield. The R2 value for monocropped maize was 0.83;
Copyright © 2010, IGI Global. Copying or distributing in print or electronic forms without written permission of IGI Global is prohibited.
International Journal of Information Systems and Social Change, 1(4), 44-65, October-December 2010 59
Table 6. R2, RMSE, mean observed and simulated values for grain and dry matter yield under different scenarios Variable
Mean (obs.)
Mean (sim.)
R2
RMSE
Scenario 1: Grain yield (kg ha-1) Dry matter yield (kg ha-1)
9053 14309
6414 12331
0.99 0.97
3351 3192
Scenario 2: Grain yield (kg ha-1) Dry matter yield (kg ha-1)
9053 14309
6419 12338
0.99 0.97
3347 3184
7704 14667
0.96 0.98
2258 1571
Scenario 3: Grain yield (kg ha-1) Dry matter yield (kg ha-1)
9053 14309
Figure 3. Simulated and observed grain yield (A) and dry matter yield (B) of monocropped (♦) and intercropped (∇) wheat in 2007/08 using scenario 3 for intercropped wheat
Copyright © 2010, IGI Global. Copying or distributing in print or electronic forms without written permission of IGI Global is prohibited.
60 International Journal of Information Systems and Social Change, 1(4), 44-65, October-December 2010
Figure 4. Simulated and observed grain yield of monocropped (♦) and intercropped (∇) maize in 2007/08
Table 7. Mean comparisons of grain yield, TKW, number of ears/plant, dry matter and LAI of intercropped and monocropped maize in 2007/08 Treatment
Grain yield (kg [dm] ha-1)
TKW (g)
Ear number (no./plant-1)
Dry matter (kg [dm] ha-1)
LAI
border rows within a plot
8852a
261a
1.4a
14444b
2.1b
inner rows within a plot
8902a
270a
1.0b
15554a
2.9a
ab
letters indicate significant differences between borderline (intercropping) and monocropping subplots at α = 0.05
the R2 value for intercropped maize was 0.90. Measured grain yield of monocropped maize was 8.9 t ha-1, simulated grain yield was 8.9 t ha-1. The RMSE for grain yield at maturity was 18 for monocropped maize and the RMSE for mean yield was 2017. Measured grain yield of intercropped maize was 8.9 t ha-1, simulated grain yield was overestimated with 9.1 t ha-1. The RMSE for grain yield at maturity was 259 for intercropped maize and the RMSE for mean yield was 1353. The evaluated shading pattern showed a strong shading of intercropped maize until beginning of July and a tanning up to July compared to its monocropped equivalent. Nevertheless, shading at the beginning and tanning at the end of the growing season were re-
stricted to 80 and 20%, respectively, according to measurements. The steep slope of the linear shading pattern might have overestimated those dates. Maize as a C4 plant could make a much better use of the increased solar radiation than wheat as a C3 plant. Not the N supply, which was actually even lower for intercropped than for monocropped maize, was responsible for the recovery-compensation growth, but the effective usage of additional solar radiation after wheat harvest.
ConCluSIon Most intercropping modeling studies were done in the 1990’s and at the beginning of 2000. They mark a point where to start from. The various approaches seem to be promising as the valida-
Copyright © 2010, IGI Global. Copying or distributing in print or electronic forms without written permission of IGI Global is prohibited.
International Journal of Information Systems and Social Change, 1(4), 44-65, October-December 2010 61
tion of the divers models showed. Although a lot of crop growth and weed models have been used to simulate intercropping and interspecific competition, only a few show completely different approaches or ideas how to simulate competition in general. Most often, the turbid layer medium analogy in combination with a modified Beer’s law was successfully used, but not applied in succession. Furthermore, the ability to model intercropping is still not introduced in most common process-oriented crop growth models; instead it is often introduced as stand-alone simulation approach. Modeling intercropping should take a step forward from pure modeling to scenario simulation in order to advise crop growers or to improve cropping systems. Park et al. (2003) concluded in a similar way concerning crop-weed models: it is necessary to increase the knowledge of spatial and temporal variability in model parameters if the models’ usage should be extended to be more predictive and informative. The more static and empirical models – often no-named – are restricted to model a special effect or phenomenon of intercropping for research use in the main. In contrast, dynamic and mechanistic models which take soil-plant-atmosphere interactions into account like APSIM, INTERCOM and STICS build up an applicable base useful not only for researchers but also for advisers and extension services. Nevertheless, in European, North-American and Australian agriculture, intercropping or smallholder farming is less practiced whereas most models have been developed in those countries. In addition, modeling the various intercropping systems – and not only maize and legume systems - requires models which include a great number of crops. With 16 integrated species, DSSAT offers a possibility to fulfill those basic requirements. As it is a generic model, other crop models or species can be introduced into DSSAT much easier. Intercropping is still an up-to-date topic. It is practiced not only in smallholder farming in countries like Africa, India or China, but also in
the US. The Alternative Agriculture News titled “Contour strip intercropping can reduce erosion and energy costs” (AANews, March 1994). The American farmer Paul Mugge, who practices strip intercropping with maize and soybean, stated that being profitable, being efficient in the terms of resources, understanding more about ecology and using that understanding (Kendall, 1996, 1997) are his driving forces for doing intercropping. In a comprehensive analysis of our agricultural systems, we should not only examine yields, but also the cost of the inputs used to obtain them. Intercropping may help eliminate unnecessary use of nonrenewable resources in modern agriculture or it may help using these resources more efficiently (Horwith, 1985, p. 289). Models should be extended to more diversified intercropping systems, to a greater variability within countries and to other aspects of intercropping than yield or plant performance, e.g. quality aspects (Andrighetto et al., 1992; Dawo et al., 2007). In addition, the modeling of case studies should be broadened to the modeling and simulating of intercropping scenarios to either study the sustainability potential (e.g., reduced nitrate leaching, reduced fertilizer input) more closely or to adjust and further improve existing cropping systems. That could be done in an inverse way to our model scenario approach: the DSSAT model showed that within an intercropping system of maize and wheat, wheat benefits from its increased nitrogen availability in this system. Hence, less fertilizer may be applied to wheat, reducing leaching and high input costs without reducing yield. Nitrogen scenario simulation could be a possibility to improve the cropping system. Modeling intercropping with regard to field boundary cultivation broadens the view for unconscious intercropping because of small field size and for patchy agricultural landscapes. There, the amount of field boundaries becomes important and relevant for yield expectance and cultivation practice and hence, for sustainability. In order to model intercropping with special regard to field boundary cultivation, the new
Copyright © 2010, IGI Global. Copying or distributing in print or electronic forms without written permission of IGI Global is prohibited.
62 International Journal of Information Systems and Social Change, 1(4), 44-65, October-December 2010
model approach with the DSSAT crop growth model showed the possibility to simulate general competition and beneficial effects without introducing a submodel. Instead, shading algorithms were evaluated to modify microclimate and microclimate changes such as incoming solar radiation within field boundaries. In addition, increased soil temperature implicating an increased mineralization and hence a higher N availability for wheat border rows could be taken into account. It is important to consider more than one competition factor like only solar radiation, because species use sunlight more or less efficiently. Different solar radiation amounts could not explain yield differences in all cases. For intercropped maize, solar radiation was an important competition factor. Hence, the recovery-compensation growth could be modeled adequately, because maize could use the increased solar radiation after wheat harvest efficiently even if there was strong shading at the beginning of the maize growing period. In contrast, wheat benefited from the increased solar radiation until flowering but benefited even more from the increased N availability.
Aikman, D. P., & Benjamin, L. R. (1994). A model for plant and crop growth, allowing for competition for light by the use of potential and restricted projected crown zone areas. Annals of Botany, 73, 185–194. doi:10.1006/anbo.1994.1022
ACknoWlEDGMEnt
Brisson, N., Bussiére, F., Ozier-Lafontaine, H., Tournebize, R., & Sinoquet, H. (2004). Adaptation of the crop model STICS to intercropping. Theoretical basis and parameterisation. Agronomie, 24, 409–421. doi:10.1051/agro:2004031
The authors’ research topic is embedded in the International Research Training Group of the University of Hohenheim and China Agricultural University, entitled “Modeling Material Flows and Production Systems for Sustainable Resource Use in the North China Plain”. We thank the German Research Foundation (DFG) and the Ministry of Education (MOE) of the People’s Republic of China for financial support.
rEfErEnCES Adiku, S. G. K., Carberry, P. S., Rose, C. W., McCown, R. L., & Braddock, R. (1995). A maize (Zea mays)-cowpea (Vigna unguiculata) intercrop model. In Sinoquet H. & Cruz P. (Es.), Ecophysiology of Tropical Intercropping (pp. 397–406). Paris: INRA editions.
Alternative Agriculture News. (1994). Contour strip intercropping can reduce erosion. AANews. Andrighetto, I., Mosca, G., Cozzi, G., & Berzaghi, P. (1992). Maize-soybean intercropping: effect of different variety and sowing density of the legume on forage yield and silage quality. Journal of Agronomy and Crop Science, 168(5), 354-360. Ball, D. A., & Shaffer, M. J. (1993). Simulating resource competition in multispecies agricultural plant communities. Weed Research, 33, 299–310. doi:10.1111/j.1365-3180.1993.tb01945.x Baumann, D. T., Bastiaans, L., Goudriaan, J., Van Laar, H. H., & Kropff, M. J. (2002). Analysing crop yield and plant quality in an intercropping system using an eco-physiological model for interplant competition. Agricultural Systems, 73, 173–203. doi:10.1016/S0308-521X(01)00084-1 Berntsen, J., Hauggaard-Nielsen, H., Olesen, H., Petersen, B. M., Jensen, E. S., & Thomsen, A. (2004). Modelling dry matter production and resource use in intercrops of pea and barley. Field Crops Research, 88(1), 59–73. doi:10.1016/j.fcr.2003.11.012
Caldwell, R. M. (1995). Simulation models for intercropping systems. In H. Sinoquet & P. Cruz (Es.), Ecophysiology of Tropical Intercropping (pp. 353–368). Paris: INRA editions. Carberry, P. S., McCown, R. L., Muchow, R. C., Dimes, J. P., Probert, M. E., Poulton, P. L., & Dalgliesh, N. P. (1996). Simulation of a legume ley farming system in northern Australia using the agricultural production systems simulator. Australian Journal of Experimental Agriculture, 36, 1037–1048. doi:10.1071/EA9961037 Dawo, M. I., Wilkinson, J. M., Sanders, F. E. T., & Pilbeam, D. J. (2007). The yield of fresh and ensiled plant material from intercropped maize (Zea mays) and beans (Phaseolus vulgaris). Journal of the Science of Food and Agriculture, 87, 1391–1399. doi:10.1002/jsfa.2879
Copyright © 2010, IGI Global. Copying or distributing in print or electronic forms without written permission of IGI Global is prohibited.
International Journal of Information Systems and Social Change, 1(4), 44-65, October-December 2010 63
Federer, W. T. (1993). Statistical design and analysis for intercropping experiments: Vol. 1. Two crops. New York: Springer.
Koeller, K. H., & Linke, C. (2001). Erfolgreicher Ackerbau ohne Pflug: Wissenschaftliche Ergebnisse – Praktische Erfahrungen. Frankfurt, Germany: DLG.
García-Barrios, L., Mayer-Foulkes, D., Franco, M., Urquijo-Vásquez, G., & Franco-Pérez, J. (2001). Development and validation of a spatially explicit individual-based mixed crop growth model. Bulletin of Mathematical Biology, 63, 507–526. doi:10.1006/ bulm.2000.0226
Kropff, M. J., & Spitters, C. J. T. (1992). An ecophysiological model for interspecific competition, applied to the influence of Chenopodium album L. on sugar beet. I. Model description and parameterization. Weed Research, 32, 437–450. doi:10.1111/j.1365-3180.1992.tb01905.x
Grant, R. F. (1992). Simulation of competition among plant populations under different managements and climates. Agron. Abstr, 6.
Kropff, M. J., & van Laar, H. H. (1993). Modelling crop-weed interactions. CAB International, in association with the International Rice Research Institute.
Grant, R. F. (1994). Simulation of competition between barley (Hordeum vulgare L.) and wild oat (Avena fatua L.) under different managements and climates. Ecological Modelling, 71, 269–287. doi:10.1016/0304-3800(94)90138-4
LEL Schwäbisch Gmünd, LTZ Augustenberg, LVVG Aulendorf, LSZ Boxberg, LVG Heidelberg & HuL Marbach. (2007). Stammdatenblätter Landwirtschaft „Nährstoffvergleich Feld-Stall. Tabelle 5a.
Horwith, B. (1985). A role for intercropping in modern agriculture. Bioscience, 35(5), 286–290. doi:10.2307/1309927 Inal, A., Gunes, A., Zhang, F., & Cakmak, I. (2007). Peanut/maize intercropping induced changes in rhizosphere and nutrient concentrations in shoots. Plant Physiology and Biochemistry, 45, 350–356. doi:10.1016/j.plaphy.2007.03.016 Jensen, E. S. (2006). Intercrop; Intercropping of cereals and grain legumes for increased production, weed control, improved product quality and prevention of N-losses in European organic farming systems (Rep. No. QLK5-CT-2002-02352. Risø. Jolliffe, P. A. (1997). Are mixed populations of plant species more productive than pure stands? Acta Oecologica Scandinavica, 80(3), 595–602. Jones, J. W., Hoogenboom, G., Porter, C. H., Boote, K. J., Batchelor, W. D., & Hunt, L. A. (2003). The DSSAT cropping system model. European Journal of Agronomy, 18, 235–265. doi:10.1016/S11610301(02)00107-7 Kendall, J. (1996/1997). PFI profile: Paul and Karen Mugge. The practical farmer, 11(4). Kiniry, J. R., & Williams, J. R. (1995). Simulating intercropping with the ALMANAC model. In Sinoquet, H., & Cruz, P. (Eds.), Ecophysiology of Tropical Intercropping (pp. 387–396). Paris: INRA editions. Kiniry, J. R., Williams, J. R., Gassman, P. W., & Debaeke, P. (1992). A general process-oriented model for two competing plant species. Transactions of the ASAE. American Society of Agricultural Engineers, 35(3), 801–810.
Li, L., Sun, J., Zhang, F., Li, X., Rengel, Z., & Yang, S. (2001). Wheat/maize or wheat/soybean strip intercropping II. Recovery or compensation of maize and soybean after wheat harvesting. Field Crops Research, 71, 173–181. doi:10.1016/S03784290(01)00157-5 Li, L., Sun, J., Zhang, F., Li, X., Yang, S., & Rengel, Z. (2001). Wheat/maize or wheat/soybean strip intercropping I. Yield advantage and interspecific interactions on nutrients. Field Crops Research, 71, 123–137. doi:10.1016/S0378-4290(01)00156-3 Lowenberg-De Boer, J., Krause, M., Deuson, R., & Reddy, K. C. (1991). Simulation of yield distributions in millet-cowpea intercropping. Agricultural Systems, 36, 471–487. doi:10.1016/0308-521X(91)90072-I Nelson, R. A., Dimes, J. P., Paningbatan, E. P., & Silburn, D. M. (1998). Erosion/productivity modelling of maize farming in the Philippine uplands part I: Parameterising the agricultural production systems simulator. Agricultural Systems, 58(2), 129–146. doi:10.1016/S0308-521X(98)00043-2 O’Callaghan, J. R., Maende, C., & Wyseure, G. L. C. (1994). Modelling the intercropping of maize and beans in Kenya. Computers and Electronics in Agriculture, 11, 351–365. doi:10.1016/01681699(94)90026-4 Ozier-Lafontaine, H., Bruckler, L., Lafolie, F., & Cabidoche, Y. M. (1995). Modelling root competition for water in mixed crops: a basic approach . In Sinoquet, H., & Cruz, P. (Eds.), Ecophysiology of Tropical Intercropping (pp. 189–187). Paris: INRA editions.
Copyright © 2010, IGI Global. Copying or distributing in print or electronic forms without written permission of IGI Global is prohibited.
64 International Journal of Information Systems and Social Change, 1(4), 44-65, October-December 2010
Ozier-Lafontaine, H., Lafolie, F., Bruckler, L., Tournebeze, R., & Mollier, A. (1998). Modelling competition for water in intercrops: theory and comparison with field experiments. Plant and Soil, 204, 183–201. doi:10.1023/A:1004399508452
Thornton, P. K., Dent, J. B., & Caldwell, R. M. (1990). Applications and issues in the modelling of intercropping systems in the tropics. Agriculture Ecosystems & Environment, 31(2), 133–146. doi:10.1016/0167-8809(90)90215-Y
Park, S. E., Benjamin, L., & Watkinson, A. R. (2003). The theory and application of plant competition models: an agronomic perspective. Annals of Botany, 92, 741–748. doi:10.1093/aob/mcg204
Tinsley, R. L. (2004). Developing smallholder agriculture – a global perspective. Brussels, Belgium: AgBé Publishing.
Reisch, E., & Knecht, G. (1995). Betriebslehre. Stuttgart, Germany: Ulmer. Rossiter, D. G., & Riha, S. J. (1999). Modeling plant competition with the GAPS object-oriented dynamic simulation model. Agronomy Journal, 91(5), 773–783. doi:10.2134/agronj1999.915773x SAS Institute. (2009). The SAS System for Windows (Release 9.2). Cary, NC: SAS Institute. Sellami, M. H., & Sifaoui, M. S. (1999). Modelling solar radiative transfer inside the oasis, experimental validation. Journal of Quantitative Spectroscopy & Radiative Transfer, 63, 85–96. doi:10.1016/S00224073(98)00137-X Sinoquet, H., & Caldwell, R. M. (1995). Estimation of light capture and partitioning in intercropping systems. In Sinoquet, H., & Cruz, P. (Eds.), Ecophysiology of Tropical Intercropping (pp. 79–97). Paris: INRA editions.
Tsubo, M., & Walker, S. (2002). A model of radiation interception and use by maize-bean intercrop canopy. Agricultural and Forest Meteorology, 110, 203–215. doi:10.1016/S0168-1923(01)00287-8 Tsubo, M., Walker, S., & Ogindo, H. O. (2005). A simulation of cereal-legume intercropping systems for semi-arid regions. I. Model development. Field Crops Research, 93, 10–22. doi:10.1016/j. fcr.2004.09.002 Vandermeer, J. (1989). The ecology of intercropping. New York: Cambridge University. Wiles, L. J., & Wilkerson, G. G. (1991). Modeling competition for light between soybean and broadleaf weeds. Agricultural Systems, 35, 37–51. doi:10.1016/0308-521X(91)90145-Z Yokozawa, M., & Hara, T. (1992). A canopy photosynthesis model for the dynamics of size structure and self-thinning in plant populations. Annals of Botany, 70, 305–316.
Sinoquet, H., Rakocevic, M., & Varlet-Grancher, C. (2000). Comparison of models for daily light partitioning in multispecies canopies. Agricultural and Forest Meteorology, 101, 251–263. doi:10.1016/ S0168-1923(99)00172-0
Zhang, F., & Li, L. (2003). Using competitive and facilitative interactions in intercropping systems enhances crop productivity and nutrientuse efficiency. Plant and Soil, 248, 305–312. doi:10.1023/A:1022352229863
Song, Y. N., Marschner, P., Li, L., Bao, X. G., Sun, J. H., & Zhang, F. S. (2007). Community composition of ammonia-oxidizing bacteria in the rhizosphere of intercropped wheat (Triticum aestivum L.), maize (Zea mays L.) and faba bean (Vicia faba L.). Biology and Fertility of Soils, 44(2), 307–314. doi:10.1007/ s00374-007-0205-y
Zhang, L. (2007). Productivity and resource use in cotton and wheat relay intercropping. Chapter 6: Development and validation of SUCROS-Cotton: A mechanistic crop growth simulation model for cotton, applied to Chinese cropping conditions. Unpublished doctoral dissertation, Wageningen University, The Netherlands.
Copyright © 2010, IGI Global. Copying or distributing in print or electronic forms without written permission of IGI Global is prohibited.
International Journal of Information Systems and Social Change, 1(4), 44-65, October-December 2010 65
Heike Knörzer has a degree in Letters and History at the Technische Universität Darmstadt, Germany, with special regard to agricultural history, and worked as a journalist. After her Master degree at the Universität Hohenheim, Germany, in Crop Production with the topics plant breeding and minimum tillage systems, she got a scholarship from the German Research Foundation (DFG) and the Chinese Ministry of Education. Within the International Research Training Group “Sustainable Resource Use in the North China Plain” she is doing her Ph.D. on design, modeling and evaluation of improved cropping strategies and multi-level interactions in mixed cropping systems. Simone Graeff-Hönninger was awarded for her Ph.D. thesis in plant nutrition from the Deutsche Maiskomitee (DMK) and had a fellowship of the Hessische Wissenschaftliche Nachwuchsförderung. After being a scientific coordinator of field trials and field research at Agrostat GmbH and a visiting scientist at the Department of Agricultural and Biological Engineering, Mississippi State University, USA, she completed her Habilitation at Universität Hohenheim, Germany, within her research topic precision agriculture and crop simulation modeling. As apl. Professor at the Institute of Crop Production and Grassland Research at the Universität Hohenheim, her research employs a systems approach to develop, test and improve genetic, physiological, nutrient and pest representation in crop growth simulation models for different spatial scales, and develop decision support systems. She has a research collaboration with the Mississippi State University, USA, on crop model development and improvement and is a member of an international effort to maintain, improve and conduct international validation of the CERES/CROPGRO models. Bettina U. Müller is a Ph.D. student at the Institute of Crop Production and Grassland, Bioinformatics Unit, at the Universität Hohenheim, Germany. She obtained her Master degree in Agriculture at the University of Göttingen, Germany, and her Diploma degree in Bioinformatics at the University of Applied Sciences Weihenstephan, Germany. Hans-Peter Piepho is Professor of Bioinformatics at the Universität Hohenheim, Stuttgart Germany. He has a Ph.D. in Plant Breeding from Universität Kiel. His current research revolves around the use of mixed modeling for biological data from the plant sciences, including field trials and genomic data. His articles appeared in applied statistics journals as well as journals related to the plant sciences, mostly plant breeding and agronomy. Wilhelm Claupein is Professor for Plant Production at the Universität Hohenheim, Germany. He did his Ph.D at the Institute for Plant Production and Plant Breeding at the University of Giessen, Germany, and his Habilitation at the University of Göttingen, Germany, was assistant lecturer and lecturer at the Institute for Plant Production and Plant Breeding of the University of Göttingen and Professor for Plant Production at the Institute for Plant Production and Plant Breeding of the Agricultural University Wien, Austria. Between 2002 and 2005, he was executive director of the German Crop Science Society and is since 2005 a member of the board. His major research topics include crop production and cropping systems, soil cultivation systems, concepts for cultivation and traceability of genetically modified organisms, precision agriculture, organic farming, bioenergy, agro-forestry, and sustainable agriculture in the North China Plain.
Copyright © 2010, IGI Global. Copying or distributing in print or electronic forms without written permission of IGI Global is prohibited.