A Monitoring Framework for Large Scale Networks Ramiro Voicu*, Iosif C. Legrand*, Ciprian Dobre** California Institute of Technology, Pasadena, CA 91125, USA ** University POLITEHNICA of Bucharest, Romania E-mails: {Ramiro.Voicu, Iosif.Legrand}@cern.ch,
[email protected] *
Abstract Network monitoring is vital to ensure proper network operation over time, and is tightly integrated with data intensive processing tasks used by modern large scale distributed systems. We present a set of dedicated services developed within the MonALISA framework to provide network management. Such services provide in near real-time the globally aggregated status of an entire network. The time evolution of global network topology is presented in a dedicated GUI. Changes in the global topology at this level occur quite frequently and even small modifications in the connectivity map may significantly affect the network performance. The global topology graphs are correlated with active end-to-end network performance measurements, done using the Fast Data Transfer application, between all sites. Access to both real-time and historical data, as provided by MonALISA, is also important for developing services able to predict the usage pattern, to aid in efficiently allocating resources globally. Keywords: topology.
monitoring,
large
scale
networks,
1. Introduction An important component for the management of any global-scale distributed system is the monitoring system that provides monitoring and real-time tracking capabilities for many site facilities, networks, and tasks in progress. The monitoring information gathered at this level proves essential for developing higher level services, for components that provide decision support and some degree of automated decisions and for maintaining and optimizing workflows in large scale distributed systems. Especially the network-related aspects, such as current topology, is an important monitoring information in modern complex large scale
distributed systems where large amounts of data are expected to be transferred over the network. We present a set of services developed within the MonALISA framework for monitoring and controlling large scale networks, such as the ones supporting the LHC experiments [2]. The framework and services are currently used in production in several of the largest distributed systems worldwide. A key point is its scalability coming for the distributed multi-threaded engines that host a variety of loosely coupled, selfdescribing dynamic services, capable of dynamic registration and discovery. It is implemented mainly in Java and is using JINI and WSDL technologies. The rest of the paper is structured as follows. Section 2 presents the MonALISA monitoring framework. In Section 3 we present a set of monitoring services for large scale networks, together with solutions for the representation of network topologies at different layers. Finally, in Section 4 we give conclusions and present future work.
2. MonALISA Monitoring framework MonALISA (Monitoring Agents in A Large Integrated Services Architecture) [1] is a globally scalable framework of services that collaborate and cooperate in performing a wide range of distributed informationgathering and processing tasks. MonALISA is currently used in several large scale HEP communities and Grid systems, including CMS, ALICE, ATLAS, the Open Science Grid (OSG), and the Russian LCG sites ([2]). It actively monitors USLHCNet production network as well as the UltraLight R&D network ([3]). It is also used to monitor and control all the EVO reflectors ([4]). As of this writing, more than 300 MonALISA services are running throughout the world. These services monitor more than 60,000 computing servers, and thousands of concurrent jobs. More than 3.5 million parameters are currently monitored in nearreal time with an aggregate update rate of approximately 50,000 parameters per second.
Fig. 1. Layer 1 topology: Monitoring and autonomous controlling for optical switches. As network monitoring is vital to ensure proper network operations over time, MonALISA was successfully used to provide its monitoring services to control a vast majority of the data intensive processing tasks used by the LHC experiments ([1]). In order to build a coherent set of network management services it is very important to collect in near real-time information about the network traffic volume and its quality, and analyze the major flows and the topology of connectivity (Figure 1 presents the GUI aggregating such information). In this context MonALISA contains a large set of monitoring developed to collect specific network information or to interface it with existing monitoring tools, including: SNMP modules for passive traffic measurements and link status; Active network measurements using simple ping-like measurements; Tracepath-like measurements to generate the global topology of a wide area network; Interfaces with the well-known monitoring tools MRTG, RRD [5]; Available Bandwidth measurements using tools like pathload; Active bandwidth measurements using Fast Data Transfer (FDT) [6]; Dedicated modules for TL1 [7] interfaces with CIENA’s CD/CIs, optical switches (Glimmerglass and Calient) [8] and GMPLS controllers (Calient) [9].
3. Monitoring modules for dynamic light path provisioning Given the monitoring part, we present solutions adopted for dynamic and automatic provision of light
path based on the monitoring information. For that MonALISA has two monitoring modules that provide information about the optical power on ports and the state of the cross-connect links inside the switch in near real-time. The modules use Transaction Language 1 (TL1) [7] commands to retrieve monitoring information from the optical switch. Based on the monitoring information the agent is able to detect and to take informed decisions in case of eventual problems with the cross connections inside the switch or loss of light on the connections. 3.1. The Optical Switch Agent For control the Optical Switch Agent is a software agent that is dynamically deployed and runs embedded in a MonALISA service. Its role is to monitor and control an optical switch, to publish and to continuously update its configuration. The configuration consists of the port map, which specifies the devices attached to the switch, state of the ports, optical cross-connects inside the switch and the necessary routing information. The agents use the MonALISA framework to discover each other, publish their configuration, and collaborate to create ondemand and end-to-end optical paths. The algorithm for dynamic path provisioning is able to establish an end-to-end connection in the shortest possible time. In order to achieve this, every agent in the system has the exact view of the network and adapts very quickly to changes, using the previously described solution. The network topology,
implemented as a network graph, has agents as vertices and optical links between switches as edges, every edge having a cost associated with it. The system is modeled using a directed graph. Such an approach makes it possible to have both full-duplex and simplex links between optical switches. Each agent in the graph computes a shortest path tree using a variant of Dijkstra’s algorithm. The agents system uses a twophase commit strategy for creating the optical crossconnects and a lease mechanism to guarantee the reliability in case of partial failures. An agent that receives a lightpath request determines, based on the local tree that is already built, if the request can be fulfilled or not. If it is possible it also initiates transactions with both the local and remote ports involved in the path. Once the transaction is started, the agent assigns a unique ID for the path, sends the remote cross-connect commands and after that it tries to establish the cross-connects on the local switch. An independent thread is waiting for acknowledgements from the remote agents. Any remote agent which receives such a cross-connect request starts a local transaction only with the ports involved in the cross-connect. If it succeeds in creating the cross-connect, it commits the local transaction and it sends back an “acknowledged” message, otherwise the transaction is rolled-back and a “not acknowledged” message is sent. Based on the received messages the local agent takes the decision whether or not the transaction can be committed or it has to be rolled back. The algorithm described above is reliable and guarantees that the system remains in a consistent state even if a network problem occurs. The newly created lightpath has a lease assigned which must be renewed by all the involved agents and in this way it can provide a viable mechanism for the system to recover from partial failures. To improve the performance and the response time all the functions executed by an agent are performed in asynchronous sessions using a pool of threads. A task can be a request for a lightpath from a client, or a cross connect request coming from another agent, or a rerouting task triggered by a topology change. The only sequential part of the algorithm described above is in the “pre-commit” phase, and this involves only the ports that are supposed to be in the lightpath. Any request submitted during this phase, which do not involve these ports can be fulfilled in parallel. Using this information, an agent is able to detect the loss-of-light on fiber, and take specific decisions if the port is part of a lightpath. The agent who detects the problem notifies the initiator, which is responsible to try to reroute the traffic through another path, if this is possible. When the initiator detects a change in
topology that affects the lightpath, it forces the shortest path tree to be recalculated. Based on the new tree, the agent is able to take the decision if the light can be rerouted using other path, or it can tear down the entire path. This is very useful, because in case of successful rerouting, the problem will not disturb already established sockets, upper network layers, like TCP, not being able to detect the problem. The routing algorithm used to establish an end to end lightpath is similar with link-state routing protocols. The work presented here uses an algorithm similar to link-state routing algorithms because they converge faster than distance-vector algorithms. In order to guarantee consistency and reliability of the entire system, a two-phase commit strategy and a lease mechanism were also developed.
Fig. 2. The network topology used for creating dynamically, on demand an end to end optical path. We developed dedicated modules for several types of optical switches. The system is currently used to create dynamically on demand optical connections between computers located at CERN (Geneva) and California Institute of Technology (CALTECH) located in Pasadena, CA, using the networking infrastructure of USLHCNet and Internet2 [3, 4]. 3.2. Dedicated GUI panel In the MonALISA framework the overall status of the dispersed systems being monitored is provided by either a GUI client or through specialized web portals. For the dedicated modules and agents used to monitor and control Optical Switches the GUI client of MonALISA provides a dedicated panel. This panel facilitates the interaction between users and the monitored Optical Switches. It offers to the end user a number of features such as complete perspective over the topology of the monitored optical networks or the
possibility to monitor the state of the Optical Switches or the possibility to dynamically create new optical paths. The main panel is presented in Figure 3. The main aspect of this panel is that it displays in an intuitive way the current topology of the monitored Optical Switches and the links between. For the Optical Switches we use different colors to represent the state of their internal ports and the state of the links between the represented entities. In the panel, besides the Optical Switches a number of other devices (the blue ovals) can also be represented. These devices, equipped with optical network cards, are connected by optical links to the Optical Switches being monitored. This panel locates the MonALISA monitoring services on a 3D view of the world geographical map. It also shows the monitoring WAN links, real-time traffic on them, the capacity of the links, the connectivity between sites, the optical switches controlled and other parameters like sites Load, CPU usage, IO parameters, etc. In this way the user is presented with an easy to use complete visualization tool which represents the global state of the entire monitored systems.
Fig. 3. Same topology and status on the 3D Map panel. 3.3. Experimental results USLHCNet provides two transatlantic 10 Gb/s optical links between CERN and Starlight (Chicago) and MANLAN (New York). On the Internet2 network, the pure optical connections are simulated using several VLANs to provide direct connections from Chicago and New York to CALTECH. The topology of the network infrastructure used is shown in Figure 2. The system is able to create dynamically an end-toend lightpath in less than one second independent of
the number of switches involved and their location. It monitors and supervises all the created connections and is able to automatically generate an alternative path in case of connectivity errors. The alternative path is set up rapidly enough to avoid a TCP timeout, and thus to allow the transfer to continue uninterrupted.
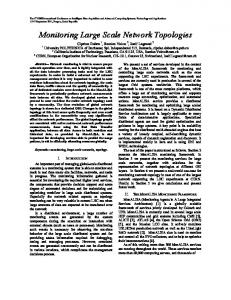
Fig. 4. The total disk to disk throughput between a server at CERN and one at CALTECH. Four “fiber cuts” were simulated during the transfer. The throughput drops when a rerouting is done, but it recovers quickly. We simulated the optical fibers from Figure 2 using two VLANs connecting two optical switches. One VLAN is routed through New York and the other one through Chicago. The monitoring module is able to simulate a fiber cut. We were interested in the capability of the optical agent to detect the problem as a real loss-of-light and try to reroute the path. In the example above a disk to disk transfer is presented, using two 4-disk servers, one at Caltech and the other one at CERN in Geneva. During the transfer four fiber cuts were simulated, corresponding to the four drops in the Figure 4. The fibers cuts simulations were done on the Geneva – Starlight and Geneva – Manlan links and the transfer was rerouted four times between these two links. The “fiber cut” and the reroute are done quick enough that the TCP does not sense the loss in connectivity and the transfer continues. The recovery time differs for various TCP stacks and the round trip time between end points.
6. Conclusions Network monitoring is vital to ensure proper network operations over time. To build a coherent set of network management services it is very important to collect in near real-time information about the network traffic volume and its quality,
and analyze the major flows and the topology of connectivity. MonALISA provides the capabilities to monitor and represent large scale networks at different OSI layers. We presented two useful use cases where informed automatic decisions based on monitoring information can improve reliability and increase overall performance of the network system. It can support the dynamic provision and provide an integrated Optical Control Plane system that controls and creates end-to-end optical paths on demand. In this way MonALISA provides a distributed system without a single point of failure. The system automatically detects network errors and is capable to create an alternative path rapidly enough to avoid a TCP timeout, so that data transport continues uninterrupted.
Acknowledgments This work was supported by the Department of Energy and National Science Foundation within the DoE grant No DE-FG02-08ER41559, by the National Science Foundation within the UltraLight grant, contract No PHY-0427110. The work has been co-funded by national project ``TRANSYS – Models and Techniques for Traffic Optimizing in Urban Environments'', Contract No. 4/28.07.2010, Project CNCSIS-PN-II-RU-PD ID: 238, and by the Sectoral Operational Programme Human Resources Development 2007-2013 of the Romanian Ministry of Labour, Family and Social Protection through the Financial Agreement POSDRU/89/1.5/S/62557.
7. References [1] Legrand, I.C., H.B. Newman, R. Voicu, C. Cirstoiu, C. Grigoras, C. Dobre, A. Muraru, A. Costan, M. Dediu, C. Stratan, “MonALISA: An agent based, dynamic service system to monitor, control and optimize distributed systems”, Computer Physics Communications, Vol. 180, Issue 12, December 2009, pp. 2472-2498. [2] Legrand, I.C., R. Voicu, C. Cirstoiu, C. Grigoras, L. Betev, A. Costan, “Monitoring and Control of Large Systems With MonALISA”, Communications of the ACM, Vol. 52 No. 9, Pages 49-55, 2009. [3] Costan, A., C. Dobre, V. Cristea, R. Voicu, “A Monitoring Architecture for High-Speed Networks in Large Scale Distributed Collaborations”, in Proc. of the 2008 International Symposium on Parallel and Distributed Computing, pp.409-416, 2008. [4] Legrand, I.C., H.B. Newman, R. Voicu, C. Cirstoiu, C. Grigoras, M. Toarta, C. Dobre, “MonALISA: An Agent based, Dynamic Service System to Monitor, Control and Optimize Grid based Applications”, CHEP 2004, Interlaken, Switzerland, September 2004. [5] RRD official website (2011), Last retrieved February 26, 2011, from: http://www.mrtg.org/rrdtool [6] FDT official website (2011), Last retrieved February 26, 2011, from: http://fdt.cern.ch. [7] TL1 – Transaction Language 1 Generic Requirements Document GR-831-CORE. [8] Calient Technologies official website (2011), Last retrieved February 26, 2011, from: http://www.calient.net [9] GMPLS – General Multi-Protocol Label Switching Architecture RFC3945.