2006 IEEE Nuclear Science Symposium Conference Record
M14-357
A Monte Carlo study of deconvolution algorithms for partial volume correction in quantitative PET Jussi Tohka and Anthonin Reilhac
Abstract— In this study, we evaluated several deconvolution methods for partial volume (PV) correction within dynamic positron emission tomography (PET) brain imaging and compared their performance with a PV correction method based on structural imaging. The motivation for this study stemmed from the errors in structural imaging based PV correction that are caused by magnetic resonance (MR) image segmentation and MRPET registration inaccuracies. The studied deconvolution methods included variants of the iterative Richardson-Lucy deconvolution, variants of the reblurred Van Cittert deconvolution and the linear Wiener deconvolution. Our material consisted of a database of 16 Monte Carlo simulated dynamic 11 C-Raclopride images with the same underlying physiology but differing underlying anatomy. We compared the binding potential (BP) values in putamen and caudate resulting from differing PV correction methods to the values computed based on the ground truth time activity curves (TACs). In addition, root mean square errors between TACs extracted from deconvolved images and the ground truth TACs were computed. The iterative deconvolution approaches featured better performance than the linear one. As expected, MR based PV correction under ideal conditions (perfect MR-PET registration and MR image segmentation) yielded more accurate quantification than the deconvolution based methods. However, the iterative deconvolution methods clearly improved the quantitative accuracy of computed physiological parameters (BP) as compared to the case of no PV correction. As variants of the reblurred Van Cittert deconvolution resulted in a lower anatomy-induced variance to the BP values, we consider them to be more interesting than Richardson-Lucy type deconvolution methods.
I. I NTRODUCTION In this work, we evaluate several deconvolution algorithms and compare their performance to partial volume (PV) correction based on structural imaging in brain PET using a database of Monte Carlo simulated images. The partial volume effect (PVE) refers to two factors contributing to blur in images: In the terminology of [1], the tissue fraction effect is caused by several distinct types of tissue existing in a single voxel. Spillover caused by a non-zero positron range and image reconstruction among other factors - means that the reconstructed image is a convolution of the true image by a point spread function (PSF). As PVE is an important source of error in quantitative PET imaging, correction techniques based on MR images have gained popularity. Reference [1] includes a good integrating J. Tohka is with Institute of Signal Processing, Tampere University of Technology, Tampere, Finland, email:
[email protected]. A. Reilhac is with CERMEP, Bron, France The work of J.T. was supported by the Academy of Finland under the grants 108517, 104834, and 213462 (Finnish Centre of Excellence program (20062011))
1-4244-0561-0/06/$20.00 ©2006 IEEE.
review of these techniques. Magnetic resonance (MR) based techniques for the PVE correction assume that there is a accurately segmented MR image of the subject that has been accurately registered to the PET image of the subject. This is not always the case and registration and segmentation errors affect the quality of the PVE correction [2], [3]. The spillover could be corrected for by utilizing only the PET image itself and the measured PSF. The process is termed deconvolution. For general tutorials about the subject, see e.g. [4], [5]. In this study, we evaluate a few well-known deconvolution algorithms and their modifications for their suitability quantitative parametric PET imaging using 11 C Raclopride. We study only such methods which have fast implementations by the fast Fourier transform (FFT), meaning that each iteration of the iterative algorithms can be implemented via FFT. These methods have not received too much attention with brain PET although similar methods are used in image reconstruction. With SPECT (single photon emitting computed tomography), there has been some interest towards deconvolution-based PVE correction [6], [7]. However, the quantification aspects were not considered in the above references. The restoration of sinograms before the reconstruction was considered in [8]. Obviously, spillover caused by reconstruction cannot be addressed this way. Several sources of the spillover can be addressed in the iterative maximum likelihood reconstruction algorithms (see [9]). Although this would be a favorable avenue to proceed, this is not always possible due to practical difficulties: e.g. it is not always possible to choose the reconstruction algorithm or reconstruct the images retrospectively with a better algorithm than the one applied originally. Also, these reconstruction methods call for advanced modeling of the data acquisition and in practice these models are necessarily approximative, see [9]. II. M ETHODS A. Image models The task is to restore an image t which has been deteriorated by a known PSF h. We assume that the PSF is symmetric and integrates to one. The observed image i is modeled as i = N2 (N1 (t) ∗ h), where ∗ denotes 3-D convolution and N1 , N2 are noise processes. In practice, we assume a simpler image model, but the general model allows us to discuss the effects of various simplifications. The task is then to estimate the true image t based on the observed image i, the PSF h and the properties of the noise processes N1 , N2 . This problem is, in
3339
general, ill-posed and it shares a lot of similarity with the image reconstruction problem. B. Linear deconvolution methods The simplest approach to deconvolution is the inverse filtering in which the discrete Fourier transform (DFT) of the true image is estimated by the ratio DF T (i)/DF T (h), where DF T (·) denotes 3-D DFT. This leads to excessive noise amplification. Another linear approach is based on the linear Wiener filtering. This approach is sometimes referred as the TikhonovMiller method because it can be derived from Tikhonovian regularization principles. The noise process N2 is assumed to be Gaussian (it can be non-white), the noise process N1 is ignored and the true image t is assumed to be a zero-mean Gaussian random variable with a known covariance matrix. It is further assumed that N2 has a zero mean and that its covariance matrix is known. (Note that the contribution of N1 can be added to N2 due to the Gaussianity of noise processes. ) We seek for the linear filter w that minimizes the mean square error between the restored image tˆ = w ∗ i and the true image t. The solution can be found in closed form (e.g. [5]): DF T (h)(ω) · DF T (i)(ω) DF T (tˆ)(ω) = , (1) (ω) |DF T (h)(ω)|2 + SSnn tt (ω) where Stt (Snn ) is the power spectrum of the true image (noise process). The drawbacks of this scheme are easy to appreciate: The image t is not a zero mean random variate (not even when we subtract its mean from it). It is interesting to consider what would happen if instead of ignoring N1 we would ignore N2 . However, assuming that the true image and N1 have diagonal covariance matrices, this would lead (essentially) to the inverse filtering solution. In our implementation, we assumed that both the noise process N2 and the true image have diagonal covariance matrices. We computed the required signal to noise ratio for each 3-D image based on a small ROI placed within the cerebellum. C. Iterative ML-based deconvolution methods A class of deconvolution approaches is based on the (possibly penalized) maximum likelihood (ML) principle and the expectation maximization (EM) algorithm. In the RichardsonLucy (RL) algorithm [10], [11]1 , we assume that each i(x) (x is the 3-D coordinate of an image voxel) is drawn independently from the Poisson distribution with the parameter (t∗h)(x). This gives the log-likelihood X l(t) ∝ [i(x) log(t ∗ h)(x) − (t ∗ h)(x)]. (2) x
Maximizing the log-likelihood with the EM algorithm leads to the update rule tk+1 (x)
=
s(x)
=
(s ∗ h)(x)tk (x); t0 (x) = i(x) i(x) (tk ∗ h)(x)
(3)
1 Both Richardson and Lucy originally derived this algorithm without any explicit noise model considerations.
The algorithm preserves of positivity (i.e tk (x)P≥ 0 if P tk−1 (x) ≥ 0 ) and the flux (i.e. t (x) = k+1 x x tk (x)) [4]. Both of these properties appear important for quantitative PET. The algorithm, when iterated until convergence, gives the inverse filtering solution [4]. Also, in terms of our general image model, the approach ignores noise process N1 . Because a part of the noise in PET arises from the statistical nature of the positron emission, we are trying to restore some noise in addition to the true image. This leads us to study several approaches to reduce the noise amplification: 1) an early termination of the algorithm after just 10 iterations (later on RL10 method), 2) damped RL-algorithm [12] (DRL), 3) penalization with the maximum entropy prior [13], (RL-ME) and 4) a scaled twometric projection (STMP) method in which 0 ≤ tk (x) ≤ M . We have tested also a few other methods but these four seem most interesting as they are easy to implement and reduce the noise amplification problem. There exist a number of different regularization approaches that can be associated with the RL algorithm. In the damped RL-algorithm, the update equation is as above except s(x) = 1+uk (x)λD −1 [λD −(λD −1)uk (x)]
i(x) − (tk ∗ h)(x) , (tk ∗ h)(x) (4)
where uk (x) = min(
2 (tk ∗ h)(x) [(tk ∗ h)(x) − i(x) − i(x) log ], 1) 2 T i(x)
and T and λ are parameters. In this work, we set T = 1 and λD = 5. The implementation of RL penalized by the maximum entropy, which preserves positivity and the radiant flux, leads to the update rule [13]: tk+1 (x) = ((s ∗ h)(x) − λM log tk (x) − 1 + C)Ktk (x), (5) where s is as in Eq. (3) and K, C and λM are constants. C is selected so that tk+1 (x) > 0 and K is selected to ensure the flux conservation. In this work, λM is 0.003. We experienced some difficulties relating to the convergence of this method. These difficulties were highlighted when λM > 0.003. The RL-STMP (Scaled Two Metric Projection) method is based on the interpretation of the RL (or EM) algorithm as a scaled gradient descent scheme [14] and the two metric projection technique for constrained optimization [15, Chapter 2.4]. The update rule is modified to tk+1 (x) = tk (x) + ((s ∗ h)(x) − 1) min(|tk (x)|, |M − tk (x)|), (6) where s is as in Eq. (3) and M is the upper bound for t(x). In this work, M is 1.5 times the image maximum. D. Iterative LS-based deconvolution methods In the iterative least squares formulations, the noise process N2 is Gaussian and N1 is typically ignored. The image t is
3340
then estimated by minimizing the least squares (LS) criterion X ||t(x) − (i ∗ h)(x)||2 .
a relatively large body of work concerning numerical aspects of the total variation regularization and our implementation is rather simplistic.
x
The LS formulation has the inverse filter as the trivial solution. However, requiring t(x) to be positive leads to a class of iterative algorithms. The steepest descent applied to the minimization task leads to the following iteration: tk+1 (x) = tk (x) + α(h ∗ (i − h ∗ tk ))(x); t0 (x) = i(x), where α ∈ (0, 2) is the step length. The positivity of tk (x) is guaranteed by the projection method, i.e. tk+1 (x) = max(tk (x) + α(h ∗ (i − h ∗ tk ))(x), 0); t0 (x) = i(x). (7) In this work, we set α = 1.5. We call this iterative scheme (constrained) reblurred Van Cittert iteration according to [4] (later on VC), but it has also other names. We consider the reblurred Van Cittert method instead of the standard Van Cittert method (see e.g. [5]) because the latter is a simple error correcting procedure that is not based on the optimization of any well-known statistical criterion. Assuming that N1 cannot be ignored and it is (as N2 ) modeled by the Gaussian distribution. The observed image is then i(x) = (h ∗ (t + n))(x) + m(x), where n(x) and m(x) are white Gaussian noises. This leads to the following heuristic scheme: tk+1 (x) nk+1 (x) dk (x)
E. Implementation notes and summary of methods For all the iterative methods except RL10, the equal termination condition was applied: pP 2 x (tk+1 (x) − tk (x)) pP < 0.01. 2 x i(x) This condition, with most methods, led to convergence rather rapidly, usually after 10 - 30 iterations. Hence, the convergence in most cases was premature. If the convergence did not occur during 100 iterations, the iteration was terminated. We did not study the effects of modifying the termination condition or threshold in this study although the results would certainly be different for different termination conditions. The summary of the methods and their abbreviations is shown in Table 1. Wiener RL RL10 DRL RL-ME RL-STMP VC VCF VC-TV
TABLE I S UMMARY OF THE STUDIED DECONVOLUTION METHODS .
= max(tk (x) + α(l ∗ dk )(x), 0); t0 (x) = i(x) = nk (x) + αλ(dk − l ∗ dk )(x); n0 (x) = 0 = (h ∗ (i − h ∗ (tk + nk )))(x), (8)
where l is a low-pass filter (in this work simply the mean filter) and λ, α are parameters. Note that when λ = 1, tk + nk is updated as in the reblurred Van Cittert method. Here λ = 1, α = 1.5. We abbreviate this scheme as VCF. The total variation based regularization [16] leads to an interesting modification of the VC method. Now, we are aiming to minimize the functional X X ||t(x) − (i ∗ h)(x)||2 + λT V |∇t(x)|, x
x
where λT V is a regularization parameter. To make p above functional differentiable, |∇t(x)| is replaced by |∇t(x)|2 + β 2 , where β is a small positive constant [17]. Under the steepest descent scheme, the update equation can be written as tk+1 (x)
max(tk (x) + α(h ∗ (i − h ∗ tk ))(x) ∇tk (x) + λT V div p , 0). |∇tk (x)|2 + β 2 =
(9)
We implement the computation of the divergence as in [16]. We select λT V = 0.25, which was the largest regularization parameter value observed experimentally to lead to the convergence under our implementation. The parameter β was set to one percent of the image maximum. We note that there is
Linear Wiener filter, Eq. (1) Richardson-Lucy Eq. (3) RL Stopped after 10 iterations Damped RL Eq. (4) RL with maximum entropy regularization, Eq. (5) RL-Scaled Two Metric Projection, Eq. (6) Constrained reblurred Van Cittert, Eq. (7) Filtered VC, Eq. (8) VC with the total variation regularization, Eq. (9)
III. M ATERIAL A. Monte Carlo database Our material consisted of the publicly available database of 16 Monte Carlo simulated dynamic 11 C-Raclopride brain PET images [18]. (There are 17 images in the database, however, we reserved one of them for tuning the parameters of the methods.) All the images had the same underlying physiology but different underlying anatomy. Realistic anatomical models were derived from human brain MR images. This allowed us to study the variation caused by the anatomical variability to the quantification results. The database was simulated by the SORTEO Monte Carlo simulation software [19] modeling the Exact ECAT HR+ scanner operating in 3-D mode. The simulation model accounts for most of the phenomena encountered during PET acquisitions including the Poisson nature of the emission, positron range in tissues, annihilation photons non-collinearity, scatter, randoms and system dead-time. The raw data were normalized and corrected for randoms, scatter, attenuation, dead-time and decay. The data was reconstructed with the filtered backprojection with the Hann(ing) filter and the frequency cutoff of 0.3mm−1 . The resulting dynamic images consisted of 26 frames of volumes of the size 128 × 128 × 63. The voxel size was 2.11 × 2.11 × 2.43 mm3 .
3341
B. Finding the PSF The PSF was approximated by a 3-D Gaussian kernel. The full-width at half maximum (FWHM) parameters of the kernel were computed based on a reconstructed image of a point source that was located at 5cm from the center of the field of view of the simulated scanner. The FWHM parameters for the kernel for 11 C Raclopride were 9.3 mm in the axial directions and 9.1 mm in the z-direction. C. Experimental procedure For 16 images and for each algorithm to be compared, we deconvolved each 3-D frame of the dynamic image. Thereafter, we computed the time activity curves (TACs) for each region of interest based on the deconvolved image frame and the ground truth anatomy by averaging radioactivity concentration within each structure. TACs for putamen, caudate and cerebellum were extracted. Based on these TACs, we computed the values of the binding potential (BP) of the D2 dopamine receptors for caudate and putamen with the simplified reference region method using the cerebellum as the reference region [20]. We similarly computed the true BP values by using the groundtruth TACs (these were the same for all 16 images). We considered the following error criteria: 1) The root mean square error (RMSE) between the ground truth TACs and extracted TACs. These were computed for each structure of interest separately and averaged over the 16 images, i.e. RM SE(T ACext |T ACtrue ) = v u 26 16 X uX ∆ 1 subj t P f r (T ACext (f r) − T ACtrue (f r))2 , 16 ∆ f r fr subj=1
f r=1
subj where T ACext is the TAC extracted from subjth dynamic image, T ACtrue is the ground truth TAC and ∆f r is the duration of the frame f r. 2) The bias of the BP values, i.e. the difference of the regionwise BP values and the ground truth BP averaged over 16 images. 3) The variance of BP values resulting from 16 images. 4) The noise amplification factor (NAF). For each structure and subject, and the image frame deconvolved by method A, denote the standard deviation of the voxel-wise activity concentrations by σfsubj r (A) and the average value of the voxelwise activity by T ACfsubj r (A). Define a frame-wise noise amplification factor by
N AFfsubj r (A) =
subj σfsubj r (A)/σf r (unprocessed) subj T ACfsubj r (A)/T ACf r (unprocessed)
.
Then NAF for the method A is obtained as a mean, weighted by the relative frame duration, of N AFfsubj r (A) over all frames and all the 16 subjects. In symbols, N AF (A) =
16 26 1 X X ∆f r N AFfsubj P26 r (A), 16 ∆ f r f r=1 subj=1 f r=1
where ∆f r is the duration of the frame f r. This measures the increase of noise-to-signal ratio as compared to the unprocessed dynamic image set. Obviously, N AF (unprocessed) = 1. The deconvolution methods were compared to an MR based PV correction method [21] (later on the MRB method). With this method, it was assumed that the subject’s anatomy (in the PET space) was perfectly known. Therefore, its performance can be considered as an upper bound of the performance of this method in practice. The noise amplification factor for this method cannot be computed, because the method is sinogram based and it does not result in an actual PV corrected image. For reference, we performed MR-based PV correction while discarding the correction for tissue fraction effect (MRBnoTFC). Also with this method it was assumed that the subject’s anatomy was perfectly known. IV. R ESULTS The quantitative results are listed in Table II. As expected, the MR-based PV correction method performed best. With MR-based correction method, there were no large differences depending on whether TACs were corrected for the tissue fraction effect or not. In fact, BP values were more accurate without tissue fraction correction. Iterative deconvolution methods clearly reduced the bias in the BP values and also RMSE of the extracted TACs compared to the case when there was no PV correction. This was clearest in putamen. Putamen has a simpler shape than caudate, and therefore it is less prone to the tissue fraction effect which cannot be compensated for by deconvolution. After the iterative deconvolution biases for the putamen and caudate were on similar level as opposed to with no PV correction. The bias was much higher in putamen (as a result of its higher radioactivity concentration) when no PV correction were performed. This could be an advantage of the deconvolution based PV correction compared to no PV correction if a statistical comparison of receptor availability in different brain structures is of interest. The best quantitative accuracy of the deconvolution methods in the terms of the bias of the BP values was achieved by the RL-ME method. However, this probably resulted because the method sometimes failed to converge during 100 first iterations, which was our limit for the number of iterations. Therefore, the average number of iterations with this method was clearly larger than with other methods, which typically converged in 10 - 30 iterations. This was visible in increased variance of the BP-values and in high NAF values with RL-me method. The second best bias reduction was achieved by the RL method. The ML/Poisson based methods typically had slightly lower biases than the LS/Gaussian based methods. However, this could be explained by more accurate reference region (Cerebellum) TACs by the LS/Gaussian based methods. The linear Wiener filtering did not yield bias (or RMSE) reduction compared to the case of no PV correction. The iterative deconvolution methods were clearly divided into two classes when the anatomy-induced variance of the BP values was compared. The methods based on the least squares
3342
Method Orig. MRB MRB-noTFC RL RL10 RL-ME DRL RL-SMTP VC VCF VC-TV Wiener Q UANTITATIVE RESULTS WITH BASED
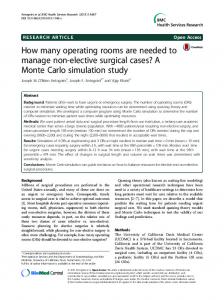
Fig. 2. shown.
PV CORRECTION
BP Bias Put Cau -0.92 -0.69 0.19 0.17 0.08 0.10 -0.37 -0.43 -0.42 -0.48 -0.34 -0.38 -0.42 -0.46 -0.42 -0.45 -0.47 -0.49 -0.56 -0.56 -0.49 -0.51 -0.82 -0.71
DIFFERENT
AND
BP Variance Put Cau 0.0021 0.0013 0.0019 0.0018 0.0017 0.0019 0.0055 0.0040 0.0051 0.0033 0.0078 0.0049 0.0054 0.0039 0.0053 0.0039 0.0012 0.0024 0.0018 0.0018 0.0014 0.0023 0.0024 0.0015
Put 1 N/A N/A 1.83 1.61 2.23 1.74 1.53 1.62 1.40 1.55 1.08
NAF Cau 1 N/A N/A 1.80 1.58 2.31 1.73 1.73 1.56 1.35 1.49 1.12
Cere 1 N/A N/A 2.51 2.09 3.7 2.39 2.44 2.07 1.61 1.90 1.06
RMSE in nCi/cc Put Cau Cere 87 64.22 5.13 11.39 14.02 2.31 12.60 14.79 1.70 42.54 44.28 4.33 46.41 47.89 4.33 43.35 42.35 6.47 46.21 46.47 4.31 46.34 44.91 4.35 42.89 43.03 1.92 52.21 50.12 2.51 44.96 44.99 1.96 98.1 78.21 12.26
TABLE II PV CORRECTION RESULTS . O RIG . REFERS TO THE CASE WITHOUT PV CORRECTION , MRB
MRB- NOTFC
REFERS TO
MR
PV CORRECTION WHILE IGNORING TISSUE FRACTION ABBREVIATIONS CF. TABLE I. BASED
MRB
RL
VC
VC-TV
REFERS TO
EFFECTS .
MR
F OR OTHER
The anatomy induced variation within the cerebellum TACs. Cerebellum TACs corrected for partial volume for all 16 distinct neuroanatomies are
3343
sidering automated extraction of the reference region ROI. All RMSE values clearly decreased because of the deconvolution indicating more accurate TACs. Examples of the PV corrected TACs are shown in Fig. 1 along with the ground truth TACs and TACs without PV correction. As can be seen in Fig. 1, the TACS for caudate and putamen were clearly improved due to MR based PV correction or deconvolution. This improvement was less visible for cerebellum TACs. The TACs resulting from reblurred Van Cittert deconvolution and Richardson-Lucy deconvolution were almost identical. However, with cerebellum, the reblurred Van Cittert method captured the peak of the TAC slightly better than the Richardson-Lucy method. Anatomy induced variance to the cerebellum TACs with the selected deconvolution methods and MR-based PV correction is visualized in Fig. 2. In Fig. 2, it is clearly visible that the variation was the greatest with RL. The MR based PV correction and VC-type deconvolution produced clearly less anatomy induced variation to the TAC. Particularly, the extracted TACs with VC type methods appear to have very modest variation. This was probably partial reason for the good BP value variances with VC type deconvolution. The noise amplification was a problem with all the deconvolution methods. This can be seen in the quantitative results in Table II and also in Fig. 3, where examples of cross-sections of deconvolved image frames are shown. Different techniques were studied to reduce noise amplification. As expected, these resulted in less noise amplification, but slightly poorer quantitative accuracy. There was no large difference in results between the different techniques to reduce the noise amplification. However, different techniques seem to have distinct strengths.
Fig. 1. Examples of PV corrected TACs. From top: putamen TACs, caudate TACs and cerebellum TACs.
criterion and the Gaussian noise model yielded significantly lower variance than the ML and Poisson noise model based methods. The BP variance with the LS based methods was on the similar level to the variance compared to the variance without PV correction and MR based PV correction. This is clearly a favorable property of the LS based deconvolution methods and it shows that it is possible to decrease the bias in BP values without increasing their anatomy induced variance. The best RMSE values were obtained with the MR based PV correction, again as expected. The RMSE values with iterative deconvolution methods for the caudate and putamen were approximately four times higher than RMSEs with MRB. However, for cerebellum, the RMSE for least squares based deconvolution methods were on the similar level than with MR based PV correction. This might prove to be important if con-
Orig.
RL
RL10
RLME
DRL
STMP
VC
VCF
VC-TV
Fig. 3. Examples of central transaxial cross-sections of deconvolved image frame (frame 14).
3344
V. D ISCUSSION We have studied iterative deconvolution techniques for the PV correction in the quantitative PET brain imaging. We have shown that these methods can improve quantitative accuracy of binding potential computation with 11 C-Raclopride as well as provide more accurate regional TACs. The experiments were performed with realistic Monte Carlo simulated image data [19], [18]. The studied methods included several modifications of the Richardson-Lucy algorithm as well as modifications of the least squares based methods. Most interesting of the methods tested were the least squares criterion based methods (Van Cittert type methods). As compared to no PV correction, these methods did not cause any anatomy induced variance increase to the BP values but improved the quantitative accuracy of the BP values and the extracted TACs. Especially, when coupled with some regularization technique, these LSbased deconvolution methods provide an interesting way for MR independent PV correction in PET. Deconvolution techniques were compared to MR based PV correction. The conditions for the MR based PV correction were ideal and it outperformed deconvolution based PV correction as expected. However, segmentation and registration errors affect the quality of the MR based PV corrections and it remains to be studied how large these errors can be until deconvolution techniques provide more accurate regional TACs than MR based PV correction methods. Although we concentrated on the increase of the quantitative accuracy of ROI analysis in the present study, the applications of deconvolution techniques in brain PET expand beyond this. For example, deconvolution based PV correction can be readily applied in a statistical parametric mapping (SPM) type analysis without a need for the ROI extraction. Also, deconvolution based PV correction could increase the accuracy of MR-PET registration as well as they could provide useful preprocessing for automated PET image segmentation algorithms such as [22].
[9] R. Leahy and J. Qi, “Statistical approaches in quantitative positron emission tomography,” Statistics and Computing, vol. 10, pp. 147 – 265, 2000. [10] W. Richardson, “Bayesian-based iterative method for image restoration,” J Opt Soc Am, vol. 62, pp. 55 – 59, 1972. [11] L. Lucy, “An iterative technique for retrification of observed distributions,” Astron J, vol. 79, pp. 745 – 765, 1974. [12] R. White, “Image restoration using the damped richardson-lucy method,” in Second Workshop on the Restoration of Images and Spectra from the Hubble Space Telescope, 1993, pp. 103 – 110. [13] J. Nunez and J. Llacer, “A fast bayesian reconstruction algorithm for emission tomography with entropy prior convereging to feasible images,” IEEE Trans. Med. Imag., vol. 9, pp. 159 – 171, 1990. [14] L. Kaufman, “Maximum likelihood, least squares, and penalized least squares for PET,” IEEE Trans. Med. Imag., vol. 12, no. 2, pp. 200 – 214, 1993. [15] D. Bertsekas, Nonlinear Programming, 2nd ed. Athena Scientific, 1999. [16] L. Rudin, S. Osher, and E. Fatemi, “Nonlinear total variation based noise removal algorithms,” Physica D, vol. 60, pp. 259 – 268, 1992. [17] D. Dobson and C. Vogel, “Convergence of an iterative method for total variation denoising,” SIAM J. Numer. Anal., vol. 34, pp. 1779 – 1791, 1997. [18] A. Reilhac, G. Batan, C. Michel, C. Grova, J. Tohka, D. Collins, N. Costes, and A. Evans, “PET-SORTEO: validation and development of database of simulated PET volumes,” IEEE Trans Nucl Sci, vol. 52, no. 5, pp. 1321 – 1328, 2005. [19] A. Reilhac, C. Lartizien, N. Costes, S. Sans, C. Comtat, R. Gunn, and A. Evans, “PET-SORTEO: A Monte Carlo-based simulator with high count rate capabilities,” IEEE Transactions on Nuclear Science, vol. 51, no. 1, pp. 46 – 52, 2004. [20] R. N. Gunn, A. A. Lammertsma, S. Hume, and V. Cunningham, “Parametric imaging of ligand-receptor binding in PET using a simplified reference region model,” Neuroimage, vol. 6, no. 4, pp. 279 – 287, 1997. [21] A. Reilhac, O. Rousset, C. Comtat, V. Frouin, M.-C. Gregoire, and A. Evans, “A correction algorithm for partial volume effects in 3D PET imaging: Principle and validation,” in IEEE-NSS/MIC 2000 Conference Record Vol. 3, 2000, pp. 18/62 – 18/66. [22] J. Tohka, E. Wallius, J. Hirvonen, J. Hietala, and U. Ruotsalainen, “Automatic extraction of caudate and putamen in [11 C]-raclopride PET using deformable surface models and normalized cuts.” IEEE Trans Nucl Sci, vol. 53, pp. 220 – 228, 2006.
R EFERENCES [1] J. Aston, V. Cunningham, M.-C. Asselin, A. Hammers, A. Evans, and R. Gunn, “Partial volume correction: Estimation and algorithms,” J Cereb Blood Flow Metab, vol. 22, no. 8, pp. 1019 – 1034, 2002. [2] V. Frouin, C. Comtat, A. Reilhac, and M.-C. Gregoire, “Correction of partial-volume effect for PET striatal imaging: Fast implementation and study of robustness,” J Nucl Med, vol. 43, pp. 1715 – 1726, 2002. [3] H. Zaidi, T. Ruest, F. Schoenahl, and M.-L. Montandon, “Comparative assessment of statistical brain MR image segmentation and their impact on partial volume correction in PET,” NeuroImage, vol. 32, pp. 1591 – 1607, 2006. [4] A. Carasso, “Linear and nonlinear image deblurring: A documented study,” SIAM J. Numer Anal., vol. 36, pp. 1659 – 1689, 1999. [5] J. Biemond, R. Lagendijk, and R. Mereserau, “Iterative methods for image deblurring,” Proc. IEEE, vol. 78, pp. 856 – 883, 1990. [6] M. Mignotte, J. Meunier, J.-P. Soucy, and C. Janicki, “Comparison of deconvolution techniques using a distribution mixture parameter estimation: Application in single photon emission computed tomography imagery,” J. Electronic Imaging, vol. 11, no. 1, pp. 1 – 14, 2002. [7] C. Charalambous, F. Ghaddar, and K. Kouris, “Two iterative image restoration algorithms with applications to nuclear medicine,” IEEE Trans Med Imag, vol. 11, pp. 2 – 8, 1992. [8] C.-M. Kao, J. Yap, J. Mukherjee, and M. Wernick, “Image reconstruction for dynamic PET based on low-order approximation and restoration of the sinogram,” IEEE Trans. Med. Imag., vol. 16, pp. 738 – 749, 1997.
3345