A Multi-Agent Architecture for 3D Rendering Optimisation Carlos Gonzalez-Morcillo1,2
Gerhard Weiss2
David Vallejo1
[email protected]
[email protected]
[email protected]
Luis Jimenez-Linares1
Jose Jesus Castro-Schez1
[email protected]
[email protected]
1
Escuela Superior de Informatica Paseo de la Universidad, 4 - 13071 Ciudad Real (Spain) 2
Software Competence Center GmbH Softwarepark, 21 - 4232 Hagenberg (Austria)
Abstract Rendering is the process of generating a 2D image from the abstract description of a 3D scene. In spite of the development of new techniques and algorithms, the computational requirements of photorealistic rendering are huge so that it is not possible to render them in real-time. In addition, the adequate configuration of rendering quality parameters is very difficult to be done by inexpert users, and they are usually set higher than in fact are needed. This paper presents an architecture called MAgArRO to optimise the rendering process in a distributed, non-centralised way through a multi-agent solution, by making use of expert knowledge or previous jobs in order to reduce the final rendering. Experimental results prove that this novel approach offers a promising research line to optimise the rendering of photorealistic images.
1
Introduction
The process of generating a 2D image comprises several phases such as modelling, setting materials and textures, placing virtual light sources, and finally rendering (Kerlow (2004)). Rendering algorithms take a description of geometry, materials, textures, light sources, and the virtual camera as input in order to produce an image or a sequence of images (in the case of animations) as output. There are different rendering algorithms ranging from simple and fast to complex and accurate that simulate the light behaviour in a precise way (Pharr and Humphreys (2004)). These methods are normally classified into two main categories (Goral et al. (1984)): local and global illumination algorithms. High-quality photorealistic rendering of complex scenes is one of the key goals of Computer Graphics. Unfortunately this process is computationally intensive and requires a lot of time when the rendering technique simulates global illumination issues. Global illumination algorithms are known for their unpredictable data accesses and their computational complexity (Jensen (2004)). As pointed out by Kajiya (1986), all rendering algorithms aim at modelling the light behaviour over various types of surfaces and try to solve the rendering equation, which forms the mathematical basis for all rendering algorithms. Depending on the rendering method and the scene characteristics, the generation of a single high-quality image may take several hours (or even days!). Because of the huge amount of time required, the rendering phase is often considered as a bottleneck in photorealistic projects in which one image may need hours of rendering in a modern workstation. For instance, Pixar’s famous animation movie Cars was estimated to spent 2300 CPU years by one of the technology manager of the studio. In other words, a single computer 1
would have to run over 2300 years to perform the rendering of all the frames that compose the movie. In fact, the first rendering tests took 10 hours for a single frame. If the running time of the film is 116 minutes and the frame rate is 24 frames per second, that is, each second of the film requires 24 generated images, then rendering becomes an important problem. In addition, the adequate configuration of input parameters and variables values of the scene (number of samples per light, number of photons, depth limit in ray tracing, etc...) is very complex. Commonly, the user of the 3D rendering engine chooses very high values that do not affect to the perceptual quality of the resulting image. Unfortunately, this fact increases even more the rendering time of the scene without actually improving the final result. To face these challenges, this paper introduces an optimisation approach based on principles, techniques, and concepts known from the area of Multi-Agent Systems. The key advantages of this approach are robustness, flexibility, good scalability, decentralised control (autonomy), and the capacity of performing local optimisations thanks to the use of expert knowledge. Through this novel and pioneering approach we aim at reaching three main goals: i) to reduce the time spent in the rendering of photorealistic images by means of a distributed approach, ii) to optimise critical rendering parameters through the acquisition of expert knowledge or learning based on previous experience by rendering agents, and iii) to provide a multi-agent framework to advance the state of the art on distributed rendering. The approach devised in this paper has been extensively evaluated with good results in complex scenes. The rest of the paper is structured as follows. We first discuss the alternatives and research lines in rendering optimisation in Section 2. We focus our effort on one of the most promising issues related with parallel and distributed rendering. In this section, we also analyse previous work that applies Artificial Intelligence methods for rendering optimisation and, more specifically, the related work made in Multi-Agent Systems. The architecture of MAgArRO (Multi-Agent Architecture for Rendering Optimisation) is described in depth in Section 4. The functional prototype of MAgArRO implements the core of a Multi-Agent system based on the design principles of the FIPA standard (FIPA (weba)). The empirical results obtained with this prototype, using a different number of agents and input variables, are exposed in Section 5. Finally, this paper resumes the main contributions of our work and concludes with some ideas about future research lines in Section 6.
2
Related Work
There are various rendering methods with different characteristics and properties that make each algorithm more appropriated for diverse application domains. One of the most famous algorithm is the Ray Tracing algorithm (Whitted and Holmdel (1980)). An extension of this method proposed by Cook et al. (1984) and called Distributed Ray Tracing uses Monte Carlo techniques for integration as the classical version of the algorithm. There are some tricks like Ambient Occlusion, such as in Zhukov et al. (1998) and Hurley (2005), that simulate the effect of Global Illumination. Radiosity techniques, originally introduced by Goral et al. (1984), are based on the principle of light exchange between surfaces. According to the Monte Carlo integration method, Path Tracing was the first method that supported all kinds of light transport paths and produced correct images (from the point of view of the light transport). This technique was proposed by Kajiya (1986) in the same article in which the Rendering Equation was introduced. One technique widely used to avoid noise in path tracing is the use of Irradiance Cache, proposed by Ward et al. (1988). The Bidirectional Path Tracing was proposed by Lafortune et al. (1993) and consists in generating ray paths from the light sources and from the virtual camera. The Metropolis Light Transport algorithm was proposed by Veach and Guibas (1997) and works well in hard lighting situations (like small holes in a surface where the light enters, or in caustics simulations). This algorithm, like the bidirectional path tracing, also makes use of the Monte Carlo approach to solve global illumination problems in two phases. There are many techniques based on the previous algorithms, but it is not the purpose of 2
this work to make an analysis of rendering methods in depth. The different levels of realism of rendering methods are related to complexity and computation time spent. Even more, with the new acquisition techniques, high-resolution screens (monitors, TV, cinema...), and the look for hyper-realism in many application areas, the rendering time (and the requisites of resolution, quality, and complexity of scenes) will keep on growing up. As previously discussed, one of the key problems in photorealistic computer graphics is the time spent in rendering due to the unpredictable data accesses and the high computational complexity of related algorithms. There are several alternatives to minimise the computation time (Chalmers et al. (2002)). In the next subsections some options to optimise this task will be described.
2.1
Optimisations via Hardware
Modern graphics processing units (GPUs), currently integrated in most personal computers, can be used as massively parallel and powerful streaming processors that run concrete portions of the code of a ray-tracer. The use of programmable GPUs outperforms the standard workstations CPUs by a factor of seven approximately (Buck et al. (2004)). This characteristic, together with the low cost and the high processing speed of modern GPUs (which are doubling their performance every six months), currently represents a tendency that consists in using this unit as a parallel specific processor in some rendering issues. The use of the CPU in conjunction with the GPU requires new paradigms and alternatives to traditional architectures. For example, the architectural configurations proposed by Rajagopalan et al. (2005) demonstrate the use of a GPU to work on real-time rendering of complex data sets which demand complex computations, or the load balanced algorithm to render unstructured grids with hardware and software (Weiler and Ertl (2001)). There are some rendering engines designed to be used with GPU acceleration, such as the Parthenon Renderer (Hachisuka (2005)), or the Gelato Heath (2008). Special purpose hardware architectures can also be built to achieve the maximum performance in specific tasks. PURE uses the the fully programmable ray tracing hardware architecture RPU (Woop et al. (2005)), which hosts dedicated hardware for spacial division structures. McEwan et al. proposed modifications to the basic ray tracing algorithm by targeting reconfigurable hardware devices and giving an estimation for the hardware needed (McEwan et al. (2007)). Ray tracing can be exploited in the future as an alternative to the z-buffer algorithm for interactive use by directly implementing it in GPUs (Shirley et al. (2008)). The impact in image synthesis community will be very important. These alternatives are very effective in time optimisation. However, the lack of generality of most of them is a significant problem. In fact, these algorithms have to be specifically designed for each hardware architecture and some optimisations are even made with the help of specialised chips.
2.2
Optimisations using parallel computing
Another option to optimise the rendering involves the use of parallel or distributed systems. If the main problem is divided into a number of smaller problems (each of which is solved by an individual processor), the time spent to solve the whole problem is reduced. Although generally this is true, all processing elements must be fully utilised and a task scheduling strategy must be adopted. Within this context, the task forms the elemental unit of computation of the parallel implementation (Chalmers et al. (2002)), and its output is the application of the algorithm to a specified data item. For example, in ray tracing one task may involve computing the value of some set of pixels at the image plane. One common alternative for solving a problem on a parallel system consists in using a domain decomposition approach, which runs an algorithm on different data items (tasks) in parallel. The domain decomposition can be done by using a data driven or a demand driven approach. In 3
PU 1
PU 2
PU 3
a) Data driven model. Key problem: Load Balance.
PU 2
PU 1
PU 1
PU 3
1
1
1
2
1
1
1
1
2
3
2
1
1
7
9
5
3
1
1
3
2
2
2
1
b) Data driven model. Complexity estimation.
PU 3
Pool of Available Tasks
PU 2
N1
N2
N3
N2
N1
N3
N2
N1
N3
N3
N2
N1
N1
N2
N1
N2
N3
N2
N3
N1
N2
N3
N2
N1
c) Demand driven model. Tasks are dynamically allocated to the PU's as they become idle.
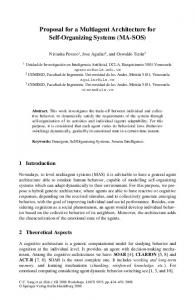
Figure 1: Data and demand driven models for the allocation of the tasks (PU = Processing Unit). the data driven model (see Figures 1.a and 1.b) the tasks are assigned to the processing units before starting to compute. In the other alternative, the demand driven model (see Figure 1.c), the tasks are dynamically allocated to the processing units as they become idle. This is done by implementing a pool of available tasks, and the processing units request the tasks to be done. The parallel architecture may be designed to keep all the processing units fully utilised. This is not trivial because the proper nature of rendering implies that different zones of the image plane may have a different complexity due to some characteristics like the geometry of the object, material, texture, lights and shadows, etc... The differences in the computational effort associated with the tasks will increase the probability for the processing elements to become idle. To avoid this effect, the tasks must be allocated by taking into account the complexity of each one and by assigning them to the processors in a balanced way. In Figure 1.b, the tasks have been assigned to the Processors in sets of 18 complexity units, that is, the sum of the complexities of the work units that compose a task is equal to 18. In this example, the Processor 2 performs a lower number of tasks than the Processor 1, but the more complicated ones. In the demand driven computational model, the tasks are dynamically allocated to the processing units as they become idle. When a processing unit obtains the result of a task, it demands for the next task of the pool (see Figure 1.c). The dynamic allocation of tasks ensures that, while there are available tasks, the processing units will be working on them. This approach facilitates the load balancing scheme so that there are only load imbalances with the latest tasks. For instance, if the last task for P U1 is very simple and the last one for P U2 is very complex, P U1 will become idle before P U2 finishes its task. This problem can be avoided by sorting the tasks depending on their complexity. In this way, the more complex tasks should be allocated before the less complex ones. This approach minimises the idle time with the latest tasks. The more relevant group of distributed and parallel rendering systems (in the image synthesis area; there are a lot of works in the interactive graphics field that are out of the scope of our work) is formed by dedicated clusters and rendering farms. Some 3D animation companies use their rendering farms in its own productions and some of them offer rendering services via Internet. An user of these rendering services can make use of the dedicated cluster that the company owns. Depending on how to do the division of tasks, we distinguish between finegrained systems, in which each image is divided into small parts that are sent to a processor to be independently rendered, or coarse-grained (in case of animations), in which each frame of an animation is entirely rendered by a computer. For example, Jevans (1989) used a dynamic load balancing (demand driven) scheme with spacial partitioning based on voxels. Other approaches like Ris and Arques (1994) uses a static 4
load balancing scheme on a network with sequential workstations and parallel computers. Other approaches oriented to render animations, like Stober et al. (1988); Martino and K¨ohling (1992), incorporate coarse-level dynamic load balancing (demand driven) schemes and distribute individual frames of an animation to computers connected to the system. There are many approaches based on the completely redesign of rendering algorithms in order to achieve high efficiency in distributed environments. While global illumination algorithms are becoming more and more complex, the effort needed to analyse and adapt the code to a parallel system is also very high, and the result usually affects to the design of the original algorithm so that it is very hard to maintain. Examples of these approaches can be found in Snell and Gustafson (1997); Kato and Saito (2002); G¨ unther et al. (2004). Other alternatives, like the proposed by Kipfer and Slusallek (1999), transparently introduce distributed logic in the code of existing object-oriented solutions (by using the CORBA Henning and Vinoski (1999) middleware). New approaches of distributed rendering use the grid approach (Foster et al. (2002)) to allocate tasks among a large number of heterogeneous computers connected to the Internet (Patoli et al. (2008); Gooding et al. (2006)). Volunteer Computing is a research line that uses the idle time of processors (Fernandez-Sorribes et al. (2006)). This kind of systems use computers connected to the Internet, volunteered by their owners, as a source of computing power for rendering 3D scenes by using different rendering engines (Anderson et al. (2005); Anderson and Fedak (2006)). The main advantage of these alternatives is the high-efficiency obtained when using existing computers. There is no need of specialised hardware and, in many organisations, a cluster of available workstations is enough. One of the key problems is related with the effective load balancing and the difficult management when the number of the nodes connected to the server grows up. 2.2.1
Distributed Multi-Agent Optimisations
The distributed approach is a good option to optimise the rendering process. In spite of the fact that the optimisation made in this way can improve the global rendering time in a huge factor, there are some key quality parameters selected by the user that play a critical role in this time. These input parameters are, for example, the number of samples per pixel, the recursion level in ray tracing, the number of photons in the photon mapping technique, etc... Usually, inexpert users choose values higher than needed, without improving the perceptible quality of the final image, but with an important increase of the rendering time. To avoid this situation, expert knowledge could be modelled to automatically select a good configuration of the input parameters. Therefore, we have a good starting point based on distributed systems, but some expert knowledge could be added to obtain better results. The inherent distribution of MultiAgent Systems and the interactions between intelligent agents configure a promising alternative for rendering optimisation. There are few previous attempts on the use of this approach for optimising the rendering process. The work presented by Rangel-Kuoppa et al. (2003) used a multi-agent platform (a JADE-based implementation) to distribute interactive rendering tasks (pure rasterization) across a network. The distribution of the task is based on a centralised client-server approach, in which the agents send the results of the rasterization of objects to a centralised server. Although using a multi-agent architecture, there is no specific use of the multi-agent technology. The use of the JADE framework (Bellifemine et al. (2007)) is only for communication issues between nodes, but there is no knowledge, learning, auctions, etc... The authors mentioned in the paper that they have used a multi-agent platform in order to reduce the development time by using a tested tool. Finally, they conclude that adopting a multi-agent architecture for interactive rendering is not a good option, due to the excessive time consumed in communication and the low performance as a result of using a Java Implementation.
5
The work in stroke-based rendering (a special method of Non Realistic Rendering) proposed by Schlechtweg et al. (2005) makes use of a multi-agent system for rendering artistic styles such as stippling and hatching. The environment of the agents consists in a source image and a collection of buffers. Each agent represents one stroke and executes its painting function in the environment. These simple agents (called Render Bots) execute three actions: simulation, to control the physical behaviour of the agent, movement, to translate the agent to other position in the environment, and painting, to generate one stroke in the final image. Our approach is based on a multi-agent architecture Weiss (1999) which allows us to distribute the rendering tasks between the agents registered with the multi-agent system. We devise different agents depending on the role that play within the MAS: agents responsible for managing the submission of rendering works and the correct composition of partial results (Master Agent); agents responsible for performing an analysis of input scenes in order to divide the whole work into different tasks by balancing their complexity (Analyst Agent); and agents responsible for rendering these tasks by making use of knowledge base acquired through a knowledge acquisition subsystem (Rendering Agent). These rendering agents are also capable of participating in auctions when they are notified about a new existing work. The auction mechanism takes into account the number of credits and the historical behaviour of each rendering agent to distribute the tasks with the aim of reducing the global rendering time. The prototype of this specific distributed rendering has been deployed over a previously developed general-purpose FIPA-compliant multi-agent framework to empirically demonstrate how this novel approach based on expert knowledge optimises the rendering process.
3
The MAgArRO Approach
This section gives a general description of the approach adopted in this work. Firstly, a multiagent system designed according to the FIPA committee (FIPA (weba)) has been developed in order to provide the basis for agent-based solutions in different application domains. The aim of this approach lies in providing a common set of management services shared by any specific multi-agent system devised to solve a particular problem. In our case, this problem is distributed rendering. Thanks to this approximation, we are able to reuse this set of basic services for any problem that requires an agent-based solution, obtaining an architectural base that can be adopted to develop specific agents for a particular domain. Next, we briefly describe the basic services of a multi-agent system designed according to FIPA specifications. The Agent Management System (AMS) is a general service that manages the events that occur in the platform and controls the state of each agent. This service also offers the white pages service that allows agents to discover one another. The basic functionality of the AMS is to register agents, modify subscriptions, unregister agents, and search for agents with specific characteristics. The Directory Facilitator (DF) implements the yellow pages service for agents. The operations are basically the same that in the AMS, but the internal data structure and the behaviour are different. The implementation of this service follows the indications of the FIPA standard, by modelling the parameters related to the services provided by an agent, interaction protocols, ontologies, known content languages, maximum live time of registration, and visibility of the agent description in the DF. This service is persistent and is automatically activated on demand. The agents are also notified about new events thanks to the subscription mechanism provided by this service. The Agent Communication Channel (ACC) receives and sends messages between agents. According to the FIPA standard, the data structure of each message is composed of two parts: the content of the message and the envelope (with information about the receiver and the sender of the message). From this general-purpose MAS, a set of agents and services specifically designed for the problem of distributed rendering is deployed. From an abstract point of view, the MAgArRO 6
Input Service Service
IceGrid
Basic Start Service Services
Analyst
Agent Manag. Agent Management System System
Blackboard
Directory Facilitator
Model Repo.
Agent Comm. Channel
Master Bidding
Content RDF
Zone
Agent
ACL Message
Render Agent Render Agent
MAgArRO specialization
Benchmark
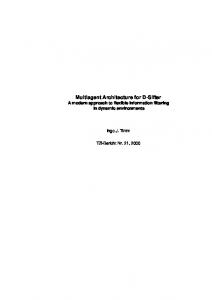
Figure 2: MAgArRO general class diagram (the framed area represents the agents and services that compose MAgArRo). system can be viewed as a black box that takes a 3D scene as input and produces the resulting 2D rendered image. Inside this black box there is an undefined number of agents which cooperate to perform the distributed rendering and a set of well-defined services that give support to specific tasks. Figure 2 graphically shows this set of rendering agents and services. Next, we briefly describe the functionality of each one them: • Master: this agent is responsible for managing a group of rendering agents. The main abilities of the master consist in supervising the rendering of a previously submitted work and composing the partial results provided by the rendering agents which take part in such work. • Analyst: this agent analyses the 3D scene to be rendered in order to study its complexity. When this is done, the 3D scene is divided into a number of tasks (work units) with a similar complexity. In this way, a master will be able to orchestrate the distributed rendering of these tasks between a set of rendering agents. • Rendering Agent: this agent is capable of performing the rendering of tasks by applying a knowledge base acquired through the knowledge acquisition subsystem or tool CastroSchez et al. (2004) or learnt from previous experiences using machine learning algorithms Castro et al. (1999) to optimise this process by adjusting relevant rendering parameters. As is shown in Figure 2, a Rendering Agent is a specialization of the FIPA standard agent so that all the functionality and requirements specified by FIPA are inherited by the rendering agent. • Model Repository: this service gives support for storing the 3D models that will be 7
1
Analyst
3 9
User
3D Scene Description: Geometry + Materials + Textures + Lights + Rendering Param. + ...
2
6 8
Master1
RAgent4
4
Rendering Group
10
3 RAgent3
RAgent1 RAgent2
7
5
Model Repository
Blackboard IdWork
2D Image Result
1 1 …
IdTask 1 2 …
Size
Complexity
50000 18000 …
178 310 …
Test 207 326 …
Trend
Agent
206 380 …
Ag1 Ag7 ...
RAgent5
Master2
RAgent7
MAgArRO Black Box
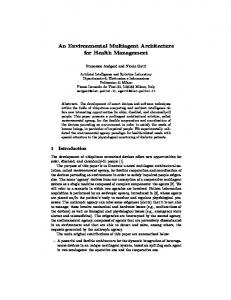
Figure 3: General workflow and main architectural roles of MAgArRO. rendered. Basically, this repository allows the rendering agents to download the whole 3D scene submitted by the user. • Blackboard: this service maintains the data structures used to write/read the progress of rendering a 3D scene by a set of rendering agents. The blackboard provides the rendering agents with the communication mechanism needed to perform the distributed rendering in a parallel way. The basic workflow of MAgArRO is shown in Figure 3, where the circled numbers represent the following steps: 1. The system receives a new work (the user submits such work to the Analyst by means of a public interface). In the current development version, a web interface is provided for the user to easily submit a work. Previously, the rendering agents were subscribed to one of the Masters of the system (see Section 4.2). This subscription can be done in any moment so that the available agents are dynamically managed. 2. The Analyst makes a fast analysis of the scene by dividing the work into a number of tasks which share a similar complexity (see Section 4.1). 3. The Analyst uploads the model to the Model Repository and notifies the existing work to a Master. 4. The Master notifies the new work to some of the Rendering Agents (possibly running on different computers) that are available. 5. Each Rendering Agent downloads the 3D model from the repository and the auction process managed by the Master begins. 6. The Master assigns the work units to each Rendering Agent. 7. The Rendering Agents start to render such tasks. 8. When a Rendering Agent has rendered a task, the result of such work units is sent to the Master and the Rendering Agent bids for another work unit. 8
9. The final result is composed by the Master from the partial results previously submitted by the Rendering Agents. 10. The Master sends the final rendered image to the user. Next, we introduce the formalisation of MAgArRO (M 0 ): M 0 =< S, A, R, M, B, I > where 1. S is the input scene to be rendered. 2. A is the Analyst agent, which can be define as follows: A =< CS, ES, O > being CS an estimation of the complexity of S and ES a strategy used to divide S into O, which represents a set of scene partitions with similar complexity. We will refer each one of these partitions as a working unit. That is, O = {wu1 , . . . , wun } with each wui being a work unit. 3. R is the Model Repository service which stores the set of partitions O generated by the analyst A. 4. M is defined as follows: M = {(mi , RAi )|i = 1 . . . n} where in each pair (mi , RAi ), mi represents a Master agent and RAi is a finite set of Rendering Agents working for him, i.e. RAi = {rai1 , rai2 , . . . raim }. • A Master service mi assigns working units wuj ∈ O to each rendering agent raij in RAi and analyses the partial results provided by each raij to compose the final image I. A master mj is defined as follow: mj =< IDmj , KBSj > where – IDmj is the master’s identifier, which is unique in the system execution domain. – KBSj is the master’s knowledge base, which consists of a blending method and a set of rules to determine its parameters. • RAi is a finite set of Rendering Agents, RAi = {rai1 , rai2 , . . . raim }. Each Rendering Agent raij ∈ RAi is defined as follows: raij =< IDRj , KBSj , Crj , Hj , CPj , STj > where – IDraj is the rendering agent’s identifier, which is unique in the system execution domain. – KBSj is the agent’s knowledge base, which consists of rendering methods and sets of rules to optimise the rendering parameters depending on the assigned task. – Crj represents the agent’s number of credits. This element represents the agent’s historical behaviour (Cr ∈ N) used to check if the rendering agent performs the rendering tasks in a time shorter or similar than the previously estimated by the analyst. 9
b)
a)
c)
d)
e)
Figure 4: Importance maps. a) Resulting 2D image obtained after rendering the dragon 3D scene. b) Importance Map. c) Blind partitioning (First Level). d) Joined zones with similar complexity (Second Level). e) Balancing complexity/size ratio (Third Level). – Hj is the agent’s recent history. It is a set of boolean values that represent success or failure in the last working units assigned (it was carried out in the right time or not). – CPj is the agent’s computational capacity. This parameter depends on the computer where the rendering agent runs (CPj ∈ R+ ). – STj is the internal agent’s state, which can take values from the set {Estimating, Bidding, Rendering, Resting, Finishing}. 5. B is the Blackboard service. This component maintains useful information about the input scene S and the rendering process, such as the work units assigned to each raij in a concrete moment. 6. I is the resulting 2D image rendered. In the next section, we will describe in detail each one of the elements of the formalisation and how we have addressed the problem of distributed rendering.
4 4.1
The MAgArRO Multi-Agent Architecture Analysing the input 3D scene
As we discussed in Section 2, it is very convenient to have an estimation of the complexity of the different work units that compose the input scene to be rendered previously submitted by the user. In our architecture, this service is provided by the Analyst Agent (A =< CS, ES, O >). The main goal of this agent is to achieve a good load balancing of the work units that compose the input scene, that is, the main objective in this partitioning process is to obtain work units with a similar complexity to avoid the delay in the final time caused by too complex tasks. This analysis is carried out in a fast way independently of the rendering algorithm used. For each 10
Algorithm 1 Blind recursive division BlindDivision (see Figure 4.c). Require: wun // nth work unit // Calculate the mean m and the typical deviation d s ← 0, n ← 0, L(wun ) ← ø for i = wun (x1 ) to wun (x2 ) do for j = wun (y1 ) to wun (y2 ) do s ← wun .pixel(i, j) n←n+1 end for end for m ← s/n s←0 for i = wun (x1 ) to wun (x2 ) do for j = wun (y1 ) to wun (y2 ) do s ← (wun .pixel(i, j) − m2 ) end for end p for d ← s/n // Recursive partitioning of the work unit wun if d >MAXDEV and wun .size >MINSIZE then x1 ← wun (x1 ), x2 ← wun (x2 ), y1 ← wun (y1 ), y2 ← wun (y2 ) BlindDivision(WU(x1 , y1 , x1 + (x2 − x1 )/2, y1 + (y2 − y1 )/2)) BlindDivision(WU(x1 + (x2 − x1 )/2, y1 , x2 , y1 + (y2 − y1 )/2)) BlindDivision(WU(x1 , y1 + (y2 − y1 )/2, x1 + (x2 − x1 )/2, y2 )) BlindDivision(WU(x1 + (x2 − x1 )/2, y1 + (y2 − y1 )/2, x2 , y2 )) else L(wun ) ← L(wun ) + wun // Add wun to list of work units (stop recursion) end if submitted 3D scene (see Figure 4.a), the Analyst generates an importance map as shown in Figure 4.b in order to determine what parts of the scene are complex and what parts are not (see Gillibrand et al. (2005) and Gillibrand et al. (2006) for similar approaches). In the beginning, the Analyst performs a fast rendering of the scene by means of an importance function to obtain a grey scale image (CS) to estimate the complexity of the model (see the corresponding sequence diagram in Figure 5). In this image (called Importance Map), the dark zones represent the less complex areas and the white zones the more complex ones. Currently, a function which only takes into account the recursion levels in mirror and transparent surfaces is used. As shown in Figure 4.b, the glass is more complex that the dragon because it has mirror and transparency properties with a higher number of ray interactions than other objects. The table is less complex because it does not have any of these properties. Once the importance map is generated, the next step consists in applying the strategy (ES) developed in order to divide the input scene S into O, that is, the set of partitions or tasks with a similar complexity that will be later performed by the rendering agents. Afterwards, the analyst is able to upload to the model repository the whole scene that contains the 3D model and to notify this set of tasks to a master mi (see top left of Figure 5). The strategy ES allows to made the task division in different levels so that each partitioning level is made by using the information of the previous level. In the first level, the partition is made by taking into account the minimum size and the maximum complexity of each zone. With these two parameters, the Analyst makes a recursive division of the work units (see Figure 4.c). Algorithm 1 describes the first level of partitioning. In this algorithm, the pair [x1, y1] represents the upper left corner of the work unit wun , the
11
Algorithm 2 Joining of wun of similar complexity Joining (see Figure 4.d). Require: List of wun (L(wun ) from algorithm 1 (BlindDivision) c ← true //c indicates if there is change while c do c ← false for wui in L(wun ) do for wuj in L(wun ) do if |wui .m − wuj .m| , being Rmi a rendering method and KBi the knowledge used to configure the method parameters in an efficient way depending on the scene characteristics. In other words, each rendering method Rmi makes use of a set of parameters (Yi ) as input which determines the behaviour of Rmi . The adequate values of these parameters can be established depending on certain characteristics of the scene (Vi ) so that it is 16
Algorithm 4 Biding and Assignment of Credits. for raij in LRAi (f inishing) do Lb ← raij .bid end for for bi in Lb | i = 1..n do if bi .wu 6= bj .wu | ∀j = 1..i − 1, i + 1..n then bi .ra ← bi .wu else P S bi .val ← H m=1 b.ra.H + b.ra.Cr for bk in Lb | k = 1..n do if bi .wu = BP k .wu then S bk .val ← H m=1 b.ra.H + b.ra.Cr if bk .val > bi .val then bk .ra ← bi .wu else bi .ra ← bi .wu end if end if end for end if end for possible to establish the relationships (Ri ) between them with a certain precision or uncertainty. In order to facilitate and make intuitive the model and description of the relevant rendering parameters Yi and the scene characteristics Vi , we have employed Fuzzy Logic (Zadeh (1999)). An expert could provide us with a set of rules Ri that associates Vi to Yi or it could be learned using machine learning techniques. In other words, the expert could define a set of rules Ri to learn the function Vi → Yi . To deal with the existing uncertainty, each variable (from Vi and Yi ) is given as a linguistic variable defined over its own definition domain DDV , which represents the set of values that can take. Next, we will focus on the particular case of the path tracing rendering method. In this example, the rendering parameters Yi to be determined are as follows: • Recursion Level [Rl], this parameter defines the global recursion level in ray tracing (number of light bounces). • Light Samples [Ls], this parameter defines the number of samples per light in the scene. Larger values of this parameter involves a higher quality in the resulting image and more rendering time TR spent. • Interpolation Band Size [Ibs], this parameter defines the size of the interpolation band in pixels, and it is used in the final composition of the image (as we will see in the next section). On the other hand, the scene variables Vi that are useful to determine Yi are as follows: • Complexity [C], this parameter represents the complexity/size ratio of the work unit. • Neighbour Difference [Nd], this parameter represents the difference of complexity of the current work unit in relation with its neighbour work units. • Size [S], this parameter represents the size of the work unit measured in pixels (calculated as width × height).
17
N
B
VB
VS
1
S
N
B
VB
0 5 10 15 20 25 30 Interpolation Band Size (Ibs)
1
VS S
N
B VB
Grade of Membership
S
Grade of Membership
VS
Grade of Membership
1
1
3 5 7 9 11 13 Light Samples (Ls)
1 2 3 4 5 6 7 8 9 Recursion Level (Rl)
Figure 6: Definition of the output variables. • Optimisation Level [Op], this parameter is selected by the user, and it determines the optimisation level (more or less aggressive depending on the initial parameters customised by the user). The knowledge base KBi for the path tracing case is as follows: KBi =< Vi , Yi , DDV, Ri > where • Vi = {C, N d, S, Op}. • Yi = {Ibs, Ls, Rl}. • DDV = {DDVC , DDVN d , DDVS , DDVOp , DDVIbs , DDVLs , DDVRl } where each DDVi is defined as follow: – DDVC = {V erySmall(V S), Small(S), N ormal(N ), Big(B), V eryBig(V B)}. – DDVN d = {V erySmall(V S), Small(S), N ormal(N ), Big(B), V eryBig(V B)}. – DDVS = {Small(S), N ormal(N ), Big(B)}. – DDVOp {V erySmall(V S), Small(S), N ormal(N ), Big(B), V eryBig(V B)}. – DDVIbs = {V erySmall(V S), Small(S), N ormal(N ), Big(B), V eryBig(V B)} (see Figure 6). – DDVLs = {V erySmall(V S), Small(S), N ormal(N ), Big(B), V eryBig(V B)} (see Figure 6). – DDVRl = {V erySmall(V S), Small(S), N ormal(N ), Big(B), V eryBig(V B)} (see Figure 6). – Ri (see Table 2). The definition of the fuzzy sets of input variables is dynamically made; the intervals of this sets are calculated in runtime. For example, in a high complex scene, the definition of VS (Very Small ) should be higher than the corresponding definition of VB (Very Big) in a simple scene. The partition of these variables is made by linear distribution. The same occurs with other parameters like Size and Neighbour Difference. In the case of the path tracing method, the set of rules is defined as shown in Table 2. These rules model the expert knowledge of an expert who has used a Path-Tracer rendering engine for 3 years.
18
R R1 : R2 : R3 : R4 : R5 : R6 : R7 : R8 : R9 : R10 : R11 : R12 : R13 : R14 : R15 : R16 : R17 : R18 : R19 : R20 : R21 : R22 : R23 : R24 : R25 : R26 : R28 : R30 :
Antecedent If C is {B,VB} ∧ S is {B,N} ∧ Op is {VB} If C is {N} ∧ S is {B,N} ∧ Op is {VB} If C is {S,VS} ∧ S is {B,N} ∧ Op is {VB} If S is {S} ∧ Op is VB If C is {B,VB} ∧ S is {B,N} ∧ Op is {B} If C is {N} ∧ S is {B,N} ∧ Op is {B} If C is {S,VS} ∧ S is {B,N} ∧ Op is {B} If S is {S} ∧ Op is B If C is {B,VB} ∧ S is {B,N} ∧ Op is {N} If C is {N} ∧ S is {B,N} ∧ Op is {N} If C is {S,VS} ∧ S is {B,N} ∧ Op is {N} If S is {S} ∧ Op is {N} If C is {B,VB} ∧ S is {B,N} ∧ Op is {S} If C is {N} ∧ S is {B,N} ∧ Op is {S} If C is {S,VS} ∧ S is {B,N} ∧ Op is {S} If S is {S} ∧ Op is {S} If C is {B,VB} ∧ S is {B,N} ∧ Op is {VS} If C is {N} ∧ S is {B,N} ∧ Op is {VS} If C is {S,VS} ∧ S is {B,N} ∧ Op is {VS} If S is {S} ∧ Op is {VS} If C is {VB,B} ∧ Nd is {VB} If Nd is {VB} If C is {VB,B} ∧ Nd is {B} If Nd is {B} If C is {VB,B} ∧ Nd is {N} If Nd is {N} If Nd is {S} If Nd is {VS}
Consequent ⇒ ⇒ ⇒ ⇒ ⇒ ⇒ ⇒ ⇒ ⇒ ⇒ ⇒ ⇒ ⇒ ⇒ ⇒ ⇒ ⇒ ⇒ ⇒ ⇒ ⇒ ⇒ ⇒ ⇒ ⇒ ⇒ ⇒ ⇒
Ls is {VS} ∧ Rl is {VS} Ls is {VS} ∧ Rl is {VS} Ls is {S} ∧ Rl is {S} Ls is {S} ∧ Rl is {N} Ls is {S} ∧ Rl is {VS} Ls is {S} ∧ Rl is {VS} Ls is {N} ∧ Rl is {S} Ls is {N} ∧ Rl is {N} Ls is {N} ∧ Rl is {S} Ls is {N} ∧ Rl is {S} Ls is {N} ∧ Rl is {N} Ls is {B} ∧ Rl is {B} Ls is {B} ∧ Rl is {N} Ls is {B} ∧ Rl is {N} Ls is {B} ∧ Rl is {B} Ls is {VB} ∧ Rl is {B} Ls is {B} ∧ Rl is {N} Ls is {VB} ∧ Rl is {B} Ls is {VB} ∧ Rl is {VB} Ls is {VB} ∧ Rl is {VB} Ls is {VB} Ibs is {VB} Ls is {VB} Ibs is {B} Ls is {B} Ibs is {N} Ibs is {S} Ibs is {VS}
Table 2: Rules for the optimisation of a PathTracer.
4.4
Composing the partial results
From the partial results generated by the different agents after having rendering the work units, the master mi is responsible for composing the final image. This process should not be directly made because slight differences between fragments can be distinguished when they are obtained from different rendering agents due to the random component of Monte Carlo based methods (like path tracing). In Figure 7, the quality difference between adjacent work units with and without a blending method can be appreciated. The image rendered with no interpolation shows important lack of continuity. For that reason, it is necessary to smooth the joint between the work units which are neighbours by using a lineal interpolation mask. In this way, adjacent work units share a common area called Interpolation Band. A graphical example of the interpolation bands shared by three work units is also shown in Figure 7. As previously described, the size of the Interpolation Band is an output parameter which is determined by the knowledge KBSj of a rendering agent raij depending on several input variables Vi of the work unit (Complexity and Neighbour Difference). Table 2 exposes the rules used by raij to set the value of the interpolation band (see rules 22, 24, 26, 28, and 30). The value of this parameter should be larger if the quality difference between neighbour zones is important. To obtain better time results, the value of this parameter should not be large since the interpolation band implies that the rendering of a same area is performed by two or more agents. This is specially important if the zone is very complex because the cost of rendering 19
Width Interp. Task A Band
Task A
Width Task B
Task B
Task C Without Interpolation
With Linear Interpolation
Height Tasks A,B Interp. Band Height Task TasksCC
Figure 7: Left: The artefact appears with no interpolation between tasks. This problem is solved with linear interpolation. Right: Diagram of work unit division and interpolation band position. this interpolation band is also very high. The amount of time wasted in the interpolation band is currently estimated between 2% and 5% of the global rendering time.
5
Experimental Validation
5.1
Platform
The results reported in this section have been obtained with the implementation of MAgArRO which we have made available for download from the official web page of the project 1 , under GPL Free Software License. In order to evaluate the system, 16 computers with the same hardware characteristics have been used. However, the architecture supports any number of agents and the replication of the related services. The tests were run with different number of agents, partitioning characteristics, and optimisation levels. It is important to remark that each one of the rendering agents raij runs on a different computer since rendering essentially involves processing power. The computers are Pentium Intel Centrino 2 Ghz, 1GB RAM and, Debian GNU/Linux. The rendering method used in all cases was path tracing (Yafray 0.1.0 render engine), 8 oversampling levels, 8 recursion levels in global configuration of ray tracing, 1024 Light samples by default and with Irradiance Cache activated. The dragon scene to be rendered contains more than 100.000 faces, 5 levels of recursion in mirror surfaces (see Figure 11), and 6 levels in transparent surfaces (the glasses). Rendering the dragon scene with this configuration in a single computer took 121 minutes and 17 seconds.
5.2
Implementation Details
Since MAgArRO aims at optimising the distributed rendering by means of a multi-agent solution in which the rendering agents run on different computers (possibly over various operating systems and under different hardware platforms), we have used the middleware ZeroC ICE (Henning (2004)) to develop the distributed system. Against other alternatives such as CORBA, we have chosen this modern communication framework due to its simplicity, efficiency, heterogeneity, and the set of advanced services provided. As previously described in Section 3, MAgArRO has been deployed on top of a generalpurpose FIPA-compliant multi-agent system. In this context, the basic management services (AMS, DF, and ACC) of the platform have been implemented in C++ in order to achieve a high efficiency when processing management functions, such as agent registration or communication 1
http://www.esi.uclm.es/www/cglez/magarro
20
Figure 8: Screenshot of the MAgArRO web interface. Left: current state of the rendering process. Right: current state of the Blackboard. issues. On the other hand, the agents are deployed within the system through agent factories, which have been implemented in three different programming languages: C++, Java, and Python. The goal of this approach is to provide the developer of the multi-agent application with a wide variety of programming options when carrying out the development of domainspecific agents. In addition, the middleware ZeroC ICE allows agents implemented in different programming languages to communicate with one another. The rendering agents have been implemented in Python and make use of the API of the Blender 3D suite to perform the rendering of the work units in which the input scene was divided. In addition, to specify the knowledge base of rendering agents we have used the XML metalanguage, which allows us to easily and intuitively describe this knowledge. We have also developed in Python the Mamdani’s fuzzy inference method to apply the set of rules that constitutes the knowledge base of rendering agents. Finally, and in order for the users to interact with MAgArRO, we have developed a web system that allows to submit works from a web browser anywhere on the Internet. In this way, the user can observe in real-time the progress of rendering and the currently estimated remaining time. Figure 8 shows the visual aspect of this graphical user interface when MAgArRO is rendering a work previously submitted by the user.
5.3
Experimental Results
First of all, we will study the importance of a good task division scheme. In Table 3, the time spent when using different partitioning levels in the dragon scene (see Figure 11) is shown. These times have been obtained by using a normal optimisation level. The top part of Figure 9 graphically represents these times. When using a simple partitioning of first level, we obtain a good rendering time with a few agents in comparison with the third level of partitioning. The time in the third level is longer because we are making more partitions in the areas with more complexity (in the glasses). This higher number of partitions involves interpolation more bands 21
01:50:00 01:40:00 01:30:00 01:20:00 01:10:00 01:00:00 00:50:00 00:40:00 00:30:00 00:20:00 00:10:00 00:00:00
Blind Join_Zones Balancing
1 Agent Agente
Agents 16 Agentes
1000 1000
2000 2000
3000
4000
3000
4000
Agents 88Agentes
5000 5000
0:12:49 0:11:23 0:10:28 0:08:37 0:07:03
0:23:43 0:20:54 0:16:52 0:16:18 0:15:58
0:31:10 0:27:11 0:26:32 0:22:50 0:22:40
1:02:36 0:55:54 0:52:41 0:42:55 0:42:40
1:25:50 1:25:06
0 Tiempo Time (Sec) (Seg)
Agents 43 Agentes
Agents 22Agentes
16Agentes Agents 16
6000 6000
6000
Stages Etapas optimiFigure 9: Top: Time (hh:mm:ss) required using different partitioning levels (Normal Render with Render 11). Bottom: Time (hh:mm:ss) required Net+Lag Red+Lag of partitioning) for the dragon scene (see Figure Auction Puja Estimation Estimacion Analysis Analisis Upload
5000
Render Render Agentfor the dragon scene (see Figure Net+Lag sation 1level) Red+Lag Auction different Puja 2 Agents optimisation levels (all with third level Estimation Estimacion 4 Agents 11). Analisis Analysis 8 Agents Upload Upload
4000
16 Agents and, therefore, to repeat the rendering of some part of these areas in various work units. This situation implies that some of the more complex work is made more than one time and, for example, the rendering time with one agent in the third level is 105 minutes and in the first level near 93 minutes. However, when the number of agents grows up, the performance of the system comes better because there are no too relevant differences of complexity among work units. In the partitioning of first and second level, there are complex tasks that slow down the finish of the whole rendering, and the increase in the number of agents does not produce relevant improvements (time required with four or eight agents are essentially the same). For this reason, the third partitioning level works better with a higher number of agents. Table 4 represents the time spent in rendering the dragon scene when using different levels of optimisations, always using a third level of partitioning (see also Figure 9 bottom). If we simply use a small level of optimisation, we obtain better results than if rendering is done with no optimisation. The time required with very small optimisation is greater than rendering the original scene because there is some time spent in the communication and composition of results, which, in this case, is greater than the time needed to render the scene only divided into one work unit with the original values. 1 Agent 2 Agents 4 Agents 8 Agents 16 Agents
0
1000
2000
3000
Render Red+Lag Puja Estimacion Analisis Upload
16 Agents
Stages Etapas
Agents 8 Agentes
VS S N B VB
1 Agente Agent
66Agentes Agents 100
Agents 44Agentes
2:05:02 1:50:50 1:45:02
02:10:00 02:00:00 01:50:00 01:40:00 01:30:00 01:20:00 01:10:00 01:00:00 00:50:00 00:40:00 00:30:00 00:20:00 00:10:00 00:00:00
Blind _Zones ancing
Agents 22 Agentes
22
02:10:00 VS 02:00:00 S 01:50:00 N 01:40:00 01:30:00 B Agents 1st Level 2nd Level 3rd Level 01:20:00 VB 1 92:46 82:36 105:02 01:10:00 2 47:21 41:13 52:41 01:00:00 4 26:23 23:33 26:32 00:50:00 01:50:00 00:40:00 8 26:25 23:31 16:52 Blind 01:40:00 00:30:00 16 26:16 23:32 10:03 Join_Zones 01:30:00 00:20:00 Balancing Table 3: Times (mm:ss) with different partitioning levels with the Normal optimisation level in 00:10:00 01:20:00 the00:00:00 dragon 01:10:00scene (see Figure 11). 1 Agente Agent Agents Agents Agents 16Agentes Agents gentes 22Agentes 43 Agentes 88Agentes 16 Agents 01:00:00 00:50:00 0 0 1000 2000 3000 4000 5000 6000 Stages Etapas Tiempo Time (Sec) (Seg) 1000 2000 3000 4000 5000 6000 00:40:00 Stages Etapas Render Render 00:30:00 Render Render 1 Agent Net+Lag Red+Lag Net+Lag Red+Lag Auction 2 00:20:00 Agents Puja Auction Puja Estimation Estimacion 4 00:10:00 Agents Estimation Estimacion Analisis Analysis 8 00:00:00 Agents Analysis Analisis Upload Upload 16 Agents 22Agentes 43Agentes 88Agentes 16 1 Agente Agent Agents Agents Agents 16Agentes Agents Upload 0:12:49 0:11:23 0:10:28 0:08:37 0:07:03
0:23:43 0:20:54 0:16:52 0:16:18 0:15:58 5000
6000
0:31:10 0:27:11 0:26:32 0:22:50 0:22:40
1:02:36 0:55:54 0:52:41 0:42:55 0:42:40
1:25:50 1:25:06
2:05:02 1:50:50 1:45:02
lind ones cing
20 20
40 40
60 60
80 80 4000
0 Time Porcentaje Perc (%) Tpo (%)
100
5000 2000
Render Red+Lag Puja Estimacion Analisis Upload
6000 3000
1 Agent 2 Agents 4 Agents 8 Agents 16 Agents
100
Stages Etapas Render Render Net+Lag Red+Lag Auction Puja Estimation Estimacion Analisis Analysis Upload Upload
4000 1000
Analysis (1.6%) Auction (0.1%) Render (84.8%) Upload (0.3%) Estimation (11.1%) Net (2.1%)
3000 0
Render Red+Lag Puja Estimacion Analisis Upload
Big 85:50 42:55 22:50 16:18 08:37
1 Agent 2 Agents 4 Agents 8 Agents 16 Agents
Normal 105:02 52:41 26:32 16:52 10:28
1000
Small 110:50 55:54 27:11 20:54 11:23
0
Very Small 125:02 62:36 31:10 23:43 12:49
VeryBig 85:06 42:40 22:40 15:58 07:03
1 Agent 2 Agents 4 Agents 8 Agents 16 Agents
2000
Figure 10: Resume of the dragon scene times. Top: Time spent in each stage with different number of agents. Bottom: Percentage of time spent in each stage. Agents 1 2 4 8 16
Table 4: Times (mm:ss) with the third level of partitioning (balanced) in the dragon scene (see Figure 11) with different number of agents and optimisation levels. Agents 1
(No Opt.)
1 2 4 8
Room Scene 26:59 25:32 13:27 6:58 4:19
Robot Scene 32:40 27:11 13:52 7:04 3:58
Toilet Scene 29:49 25:47 13:19 7:53 4:02
Table 5: Times spent with the third level of partitioning and with a different number of agents (all configurations, except the first one with no optimisation, use the Normal optimisation level).
23
02:10:00 02:00:00 01:50:00 01:40:00 01:30:00 01:20:00 01:10:00 01:00:00 00:50:00 00:40:00 00:30:00 00:20:00 00:10:00 00:00:00
0 Tiempo Time (Sec) (Seg)
1 Agent 2 Agents 4 Agents 8 Agents 16 Agents
N
VS
2.13% Diff. VS 0
VB
2.65% Diff. N 1
4
3.95% Diff. VB 1
5
1 5
2
3
6
7
6 0
8
9
12
13
10
11
14
15
16 0
3
11
12
13
17
14
15
11
20
21
22
23
26
27
28
29
32
33
34
35
5
13
15
Figure 11: First row: results of the dragon scene rendering when using different optimisation levels. Second row: quality differences between the results with and without optimisation (the darker the bigger difference). Third row: three available partitioning levels when dividing the scene into work units. The times are really good when only using 4 agents. As we can see for example in the normal optimisation level, the time required to render the scene with 4 agents is only near 26 minutes in comparison with the 120 minutes of original rendering time. The rendering results with these configurations are shown in Figure 11. To optimise the scene, different quality levels were taken. With some aggressive optimisation levels (big or very big), there might be some lack of quality or loss of details. For example, in Figure 11 (first row, VB), the reflections on the glass are not so detailed like in Figure 9 (first row, VS). These errors might appear in different parts of the image (depending on the scene), so very high optimisation levels may present this kind of problems. These artefacts might be more or less important and could be avoided by using more complex functions to develop the Importance Map, and by choosing less aggressive optimisation methods. In other projects, these errors may be acceptable and the benefit may be worth the trouble. For instance, in the normal optimisation level, the time needed to render the dragon scene is 26 minutes (120 minutes are necessary to render the original scene) and there is only a relative difference of the 2.65% of the pixels. When studying the percentage of time spent in each step of the process (see Figure 10), as it was predictable, the rendering stage uses most of the time (around 85%) and the estimation around the 10% (the time spent in other stages is negligible in comparison to these ones). The upload time is also very small because of the use of a LAN network. In other cases, it may be significant, but usually small in comparison to the rendering stage. As shown in Figure 10 24
No Opt.
No Opt.
No Opt. N
N
N Diff. N 2.01%
1.73% Diff. N
5.45% Diff. N
Figure 12: Other scene results. First row: no optimisation. Second row: normal optimisation. Third row: quality differences between the results with and without optimisation. Fourth row: partition for third level.
25
(bottom), the time percentage needed by the stages when using a different number of agents is very similar. In this way, it is possible to use more advanced negotiation and cooperation mechanisms between agents because this might not significantly load the system in comparison to other times. Other tests have been done by using the same hardware architecture and the same rendering method. Figure 12 shows the result of these tests while Table 5 resumes the time results. In all these scenes, the global configuration was 1024 Light samples with Irradiance Cache, 8 oversampling levels and 8 recursion level of path tracing. The room scene of Figure 12 contains more than 130.000 polygons, and it makes use of Photon Mapping (600.000 photons were shot from each light source), with 4 area lights in the scene. The robot scene of Figure 12 is an outdoor configuration similar to the dragon scene (see Figure 11). It has more than 24.000 faces, and the light configuration (a general sky) is similar to the previous one, but in the dragon scene a High Dynamic Range Image (HDRI map) has been used to achieve realistic lighting. Finally, the toilet scene of Figure 12 is another indoor scene, with only one light source (the light enters through the window), using 700.000 photons, and with 12.000 faces. The complexity of this scene is due to the hard light configuration. The result of the tests present in most cases achieves very good rendering times when only using 4 agents. Increasing the number of agents in some cases achieves a quasi-linear optimisation in rendering times (like in the room or toilet scenes). This may be improved by choosing a smaller minimum size of work units by adopting a better importance map. Nevertheless, the results in any case are more than acceptable. With this optimisation level, there is almost no perceptible difference between the original rendered scene (first row in Figure 12) and the result obtained with the Normal optimisation level (second row of images in Figure 12).
6
Conclusions and Future Work
The media industry is demanding for high-fidelity images for their 3D scenes. The production of 3D realistic images in computer games, film production, and TV advertisement was over 30.000 millions of dollars in 2005 (Roberts (2005)) and it continues growing, becoming the most economically relevant activity in the leisure area. However, the computational requirements of full global illumination are such that it is practically impossible to achieve this kind of rendering in a reasonable time on a single computer. To face this problem, the most widespread approach consists in using a rendering farm composed of hundreds or event thousands of computers to distribute the computational load of rendering. Other approaches involve the use of dedicated graphic processing units to accelerate the rendering. The main limitations of these approaches lie in achieving an effective load balancing and the need of redesigning the algorithm for each hardware architecture, respectively. On the other hand, the user tends to over-optimise the value of rendering engine parameters so that the final rendering time is considerably increased with no relevant improvement in the perceptual quality of the final image. The approach presented in this paper has been devised in response to these challenges. MAgArRO consists in a multi-agent system that allows to distribute the work units in which an input scene is divided into rendering agents which run on different computers and use the knowledge bases needed to optimise rendering methods. MAgArRO delivers significantly better throughput (number of rendered work units per time unit) than classical (based on cluster or render farm) approaches because each independent work unit is rendered and optimised in parallel by different agents. Besides, there exist agents within the MAS responsible for performing an adequate division of the input scene (Analyst Agent) and for coordinating the rendering of a 3D model by a set of rendering agents (Master Agent). This logical division into responsibilities allows the agents to deal with the processes of dividing the tasks, coordinating the distributed rendering, and performing the rendering using knowledge bases in an autonomous way. To share information, the architecture provides a Blackboard service where these agents 26
can read and write data. The Analyst performs a critical function in the whole process when dividing the input scene into work units by using Importance Maps and different division levels to balance the complexity of the work units. The use of the importance map assures an initial [good] time estimation that minimises the latency of the latest task. In particular, as a result of the optimisation obtained, MAgArRO achieves overall rendering times lower than the time required by one CPU divided by the number of agents. Within this context, the third partition level (see the third column of the third row of Figure 11) presents the best results when dividing the scene into work units (see top of Figure 9). The Master is responsible for coordinating the rendering agents through an auction mechanism, which allows them to bid for the most complex work units in first place to reduce the global rendering time. Besides, this mechanism awards to the agents that finish the task in a time TR shorter or similar to the previously estimated TE . This approach improves the task retrieval by rendering agents by taking into account their historical behaviour, that is, the sequence of successes or failures previously done. One of the main contributions of MAgArRO is the use of knowledge bases to optimise the rendering process by adjusting the relevant parameters involved in this stage of Photorealistic Image Synthesis. Experimental results show that MAgArRO achieves excellent optimisation performance by modelling expert knowledge or previous successful experiences through fuzzy systems. The use of fuzzy systems provides several advantages: • It allows us to easily model expert knowledge. The definition of the sets of rules is based on XML files, which are easily adjustable with no changes in the source code. • It provides us with a highly scalable system. Thus, different types of agents can cooperate by employing knowledge of different domains. The use of sets of fuzzy rules allows us to define various roles for the running agents in the system. • It provides us with an understandable human representation. The management of uncertain and incomplete information is easily done with the use of fuzzy logic. This characteristic, typical of human reasoning, is difficult to achieve with other representation mechanisms. MAgArRO is pioneering in the application of multi-agent principles to 3D realistic rendering optimisation. This fact opens several interesting research avenues. Specifically, we think it is very promising to extend MAgArRO toward more sophisticated adaptation and machine learning techniques. The open technology used in the development of MAgArRO allows the agents to reside and run on different machines around the world. There are several opened research lines related to MAgArRO: • Choosing a good configuration of the input parameters for a given rendering engine is not an easy task. The quality of the synthesised image, as well as the CPU time spent in the process, depends to a great extent on the values of the input parameters of the rendering engine to be used. One open research line should be oriented to the construction of a data mining based rendering wizard, which automatically chooses a good initial configuration. To accomplish its objectives, the system would have a data repository which contains several matching models. In this way, when the user inputs a model, the system will try to match the given model with one of the matching models in the data repository according to several similar criteria. Once one model has been matched, a data mining analysis will be performed against its corresponding data set. • More advanced importance functions could be used in this grey scale image generation, using perception-based rendering algorithms (based on visual attention processes) to construct the importance map (Cater et al. (2003); Sundstedt et al. (2005)). The importance 27
map can also be improved by using more information about the scene, such as geometric information about photon impacts, direct and indirect illumination maps, etc. • We are also exploring other issues, such as the possibility of incorporating agent-agent real-time coordination schemes into MAgArRO, which are more flexible than auctioning, adding learning capabilities to the agents, etc.
7
Acknowledgement
This work has been funded by the Junta de Comunidades de Castilla-La Mancha under Research Projects PII2I09-0052-3440 and PII1C09-0137-6488. Special thanks to Javier Galan for his indoor scene used in this work for testing the system.
References Anderson, D. P. and G. Fedak (2006). The computational and storage potential of volunteer computing. In CCGRID ’06: Proceedings of the Sixth IEEE International Symposium on Cluster Computing and the Grid, Washington, DC, USA, pp. 73–80. IEEE Computer Society. Anderson, D. P., E. Korpela, and R. Walton (2005). High-performance task distribution for volunteer computing. In E-SCIENCE ’05: Proceedings of the First International Conference on e-Science and Grid Computing, Washington, DC, USA, pp. 196–203. IEEE Computer Society. Bellifemine, F., G. Caire, D. Greenwood, and E. Corporation (2007). Developing multi-agent systems with JADE. Springer. Buck, I., T. Foley, D. Horn, J. Sugerman, K. Fatahalian, M. Houston, and P. Hanrahan (2004). Brook for GPUs: Stream computing on graphics hardware. In Proceedings of SIGGRAPH 2004, Los Angeles, CA, USA, pp. 777–786. Castro, J., J. Castro-Schez, and J. Zurita (1999). Learning maximal structure rules in fuzzy logic for knowledge acquisition in expert systems. Fuzzy Sets and Systems 101 (3), 331–342. Castro-Schez, J., J. Castro, and J. Zurita (2004). Fuzzy repertory table: a method for acquiring knowledge about input variables to machine learning algorithm. IEEE Transactions on fuzzy systems 12 (1), 123–139. Cater, K., A. Chalmers, and G. Ward (2003). Detail to attention: exploiting visual tasks for selective rendering. In Proceedings of the 14th Eurographics workshop on Rendering, pp. 270– 280. Eurographics Association Aire-la-Ville, Switzerland. Chalmers, A., T. Davis, and E. Reinhard (2002). Practical Parallel Rendering. AK Peters, Ltd. Cook, R., T. Porter, and L. Carpenter (1984). Distributed ray tracing. ACM SIGGRAPH Computer Graphics 18 (3), 137–145. Fernandez-Sorribes, J., C. Gonzalez-Morcillo, and L. Jimenez-Linares (2006). Grid architecture for distributed rendering. In Proceedings of Ibero-American Symposium in Computer Graphics 2006 (SIACG’06), pp. 141–148. FIPA (weba). Foundation for Intelligent Physical Agents FIPA. http://www.fipa.org. FIPA (webb). Foundation for Intelligent http://www.fipa.org/specs/fipa00029/SC00029H.html.
28
Physical
Agents
FIPA.
Foster, I., C. Kesselman, J. Nick, and S. Tuecke (2002). The physiology of the grid: An open grid services architecture for distributed systems integration. Gillibrand, R., K. Debattista, and A. Chalmers (2005). Cost prediction maps for global illumination. In Proceedings of Theory and Practice of Computer Graphics’05, pp. 97–104. Eurographics Association. Gillibrand, R., P. Longhurst, K. Debattista, and A. Chalmers (2006). Cost prediction for global illumination using a fast rasterised scene preview. In S. Spencer (Ed.), Proceedings of the 4th International Conference on Virtual Reality, Computer Graphics, Visualisation and Interaction in Africa, Afrigraph 2006, Cape Town, South Africa, January 25-27, 2006, pp. 41–48. ACM. Gooding, S., L. Arns, P. Smith, and J. Tillotson (2006). Implementation of a distributed rendering environment for the TeraGrid. IEEE Challenges of Large Applications in Distributed Environments, 13–21. Goral, C., K. Torrance, D. Greenberg, and B. Battaile (1984). Modeling the interaction of light between diffuse surfaces. ACM SIGGRAPH Computer Graphics 18 (3), 213–222. G¨ unther, J., I. Wald, and P. Slusallek (2004). Realtime caustics using distributed photon mapping. In Proceedings of the Eurographics Symposium on Rendering. Eurographics Association. Hachisuka, T. (2005). High-quality global illumination rendering using rasterization. GPU Gems 2, 615–633. Heath, T. (2008). The plush life. In SIGGRAPH ’08: ACM SIGGRAPH 2008 computer animation festival, New York, NY, USA, pp. 86–87. ACM. Henning, M. (2004). A new approach to object-oriented middleware. IEEE Internet Computing 8 (1), 66–75. Henning, M. and S. Vinoski (1999). Advanced CORBA programming with C++. Addison-Wesley. Hurley, J. (2005). Ray Tracing Goes Mainstream. Intel Technology Journal: Compute Intensive, High Parallel Applications and Uses 9 (2), 99–107. Jensen, H. (2004). A practical guide to global illumination using ray tracing and photon mapping. In International Conference on Computer Graphics and Interactive Techniques. ACM New York, NY, USA. Jevans, D. (1989). Optimistic multi-processor ray tracing. In CG International ’89: New Advances in Computer Graphics, pp. 507–522. Kajiya, J. T. (1986). The rendering equation. In SIGGRAPH ’86: Proceedings of the 13th annual conference on Computer graphics and interactive techniques, New York, NY, USA, pp. 143–150. ACM. Kato, T. and J. Saito (2002). Kilauea: parallel global illumination renderer. In EGPGV ’02: Proceedings of the Fourth Eurographics Workshop on Parallel Graphics and Visualization, Aire-la-Ville, Switzerland, Switzerland, pp. 7–16. Eurographics Association. Kerlow, I. (2004). The art of 3D computer animation and effects. Wiley. Kipfer, P. and P. Slusallek (1999). Transparent distributed processing for rendering. In PVGS ’99: Proceedings of the 1999 IEEE symposium on Parallel visualization and graphics, Washington, DC, USA, pp. 39–46. IEEE Computer Society.
29
Lafortune, E., Y. Willems, and H. Santo (1993). Bi-directional PathTracing. In Proceedings of Third International Conference on Computational Graphics and Visualization Techniques (Compugraphics’ 93), pp. 145–153. Martino, J. and R. K¨ ohling (1992). Production rendering on a local area network. Computers & graphics 16 (3), 317–324. McEwan, A., S. Schneider, W. Ifill, and P. Welch (2007). Domain Specific Transformations for Hardware Ray Tracing. In Communicating Process Architectures 2007: WoTUG-30: Proceedings of the 30th WoTUG Technical Meeting, pp. 479. Ios Pr Inc. Patoli, Z., M. Gkion, A. Al-Barakati, W. Zhang, P. Newbury, and M. White (2008). How to Build an Open Source Render Farm Based on Desktop Grid Computing. In Wireless Networks Information Processing and Systems: First International Multi Topic Conference, Imtic 2008 Jamshoro, Pakistan, April 11-12, 2008 Revised Papers, pp. 268. Springer. Pharr, M. and G. Humphreys (2004). Physically Based Rendering: From Theory to Implementation. Morgan Kaufmann. Rajagopalan, R., D. Goswami, and S. Mudur (2005). Functionality Distribution for Parallel Rendering. In Proceedings of the 19th IEEE International Parallel and Distributed Processing Symposium (IPDPS’05), Volume 1, pp. 18–27. IEEE Computer Society Washington, DC, USA. Rangel-Kuoppa, R., C. Aviles-Cruz, and D. Mould (2003). Distributed 3D rendering system in a multi-agent platform. In Proceedings of the Fourth Mexican International Conference on Computer Science (ENC ’03), pp. 168–175. Ris, P. and D. Arques (1994). Parallel ray tracing based upon a multilevel topological knowledge acquisition of the scene. In Computer Graphics Forum, Volume 3, pp. 221–232. Blackwell Synergy. Roberts, K. (2005). SISOMO: The Future on Screen. powerHouse Books. Schlechtweg, S., T. Germer, and T. Strothotte (2005). RenderBots-Multi-Agent Systems for Direct Image Generation. In Computer Graphics Forum, Volume 24, pp. 137–148. Blackwell Synergy. Shirley, P., K. Sung, E. Brunvand, A. Davis, S. Parker, and S. Boulos (2008). Fast ray tracing and the potential effects on graphics and gaming courses. Computers & Graphics 32 (2), 260–267. Snell, Q. and J. Gustafson (1997). Parallel hierarchical global illumination. In High Performance Distributed Computing, 1997. Proceedings. The Sixth IEEE International Symposium on, pp. 12–19. Stober, A., A. Schmitt, B. Neidecker, W. Muller, T. Maus, and W. Leister (1988). Tools for efficient photo-realistic computer animation. In Proceeding of Eurographics ’88, Volume 88, pp. 31–41. Sundstedt, V., K. Debattista, P. Longhurst, A. Chalmers, and T. Troscianko (2005). Visual attention for efficient high-fidelity graphics. In Spring Conference on Computer Graphics: Proceedings of the 21 st spring conference on Computer graphics, Volume 12, pp. 169–175. Veach, E. and L. Guibas (1997). Metropolis light transport. In Proceedings of the 24th annual conference on Computer graphics and interactive techniques, pp. 65–76. ACM Press/AddisonWesley Publishing Co. New York, NY, USA. 30
Ward, G., F. Rubinstein, and R. Clear (1988). A ray tracing solution for diffuse interreflection. In Proceedings of the 15th annual conference on Computer graphics and interactive techniques, pp. 85–92. ACM New York, NY, USA. Weiler, M. and T. Ertl (2001). Hardware-software-balanced resampling for the interactive visualization of unstructured grids. In Proceedings of the conference on Visualization’01, pp. 199–206. IEEE Computer Society Washington, DC, USA. Weiss, G. (1999). Multiagent systems: a modern approach to distributed artificial intelligence. MIT press. Whitted, T. and N. Holmdel (1980). An Improved Illumination Model for Shaded Display. Communications 23 (6), 343–349. Woop, S., J. Schmittler, and P. Slusallek (2005). RPU: a programmable ray processing unit for realtime ray tracing. In International Conference on Computer Graphics and Interactive Techniques, pp. 434–444. ACM Press New York, NY, USA. Zadeh, L. (1999). Fuzzy logic= computing with words. Computing with Words in Information/Intelligent Systems 1, 3–23. Zhukov, S., A. Iones, and G. Kronin (1998). An Ambient Light Illumination Model. In Proceedings of Eurographics Rendering Workshop98, pp. 45–55. Springer-Wien, NewYork.
31