OF RESPIRATORY SYSTEM MECHANICS. A multi-method system developed for complex investigations of lung mechanics is described. The system includes ...
ADAM G. POLAK, DARIUSZ WYSOCZAŃSKI, JANUSZ MROCZKA Wroclaw University of Technology Chair of Electronic and Photonic Metrology
A MULTI-METHOD APPROACH TO MEASUREMENT OF RESPIRATORY SYSTEM MECHANICS A multi-method system developed for complex investigations of lung mechanics is described. The system includes complementary measurement techniques such as forced oscillations, interrupter technique, methods for measurement of pulmonary mechanics during artificial ventilation and spirometry. These techniques are completed by computational models enabling an analysis of the relation between the lung structure, function, pathology and measurement results. This set-up is a first step towards a new-quality approach to research into the respiratory system via multi-method fusion. Keywords: pulmonary mechanics, forced oscillations, mechanical ventilation, interrupter technique, spirometry, computational model, multi-method fusion
1. INTRODUCTION The lung is a highly complex mechanical system. Its primary role consists in transport of a gas mixture through the bronchial tree, and finally in alveolar ventilation and gas exchange with the capillary blood. The airways form a bifurcating structure of elastic tubes becoming smaller in the distal direction but with an almost exponentially increasing number of the tubes in consecutive generations. Thus, gas transport occurs by bulk flow in the central airways and by diffusion in the lung periphery. The airways are terminated by about 300 million alveoli constituting the gas exchanger, with a surface of 130 m2 [1]. There are about 24 airway generations [2], and the bronchial tree structure is not fully symmetrical [3]. The respiratory system is capable of keeping normal blood gas levels despite substantial injury or pathological changes. These alternations influence, however, the lung function and thereby physiological signals which are measured. The question under investigation is the contribution of the airways and lung tissues to the overall observed dysfunctions. Another problem concerns the manifestation of peripheral airway disorders. Traditionally, they are called “the silent zone” due to negligible axial airflow and a small combined flow resistance. Probably, they may develop significant pathological changes before a noticeable decrement in lung function is experienced. Additionally, the mechanical properties are strongly dependent on breathing frequency and amplitude, as well as on the level and topology of heterogeneous processes [4]. Concluding, a measurement approach providing specific, reliable and complex insight into the lung mechanical properties is needed. In this paper we present a multi-method system built in the Chair of Electronic and Photonic Metrology, Wroclaw University of Technology, developed for complex investigations of lung mechanics. The system includes several complementary measurement techniques as well as computational models enabling an analysis of the relation between the lung structure, function, pathology and measurement results. The measurement system is a first step towards a new-quality approach to research into the respiratory system via multi-method fusion. 2. MEASUREMENT METHODS
Four measurement methods have been combined into a computer-based system (Fig. 1). They include forced oscillations, mechanical ventilation, airflow interruption and spirometry. All of them use flow and pressure signals measured by calibrated medical transducers (Jaeger, Germany) at the mouth outlet, the three first methods apply, however, different actuators. The computer is equipped with a DAQ KPCI-3108 card (National Instruments, USA) and the system is controlled by dedicated user-friendly software written under LabVIEW (National Instruments, USA).
FOT Ventilator Servo-motor Servo-controller Shutter DAQ KPCI-3108 LabVIEW Control Software
Q/U
P/U
Computational models
Fig.1. Schematic representation of the multi-method system for investigations of pulmonary mechanics.
2.1. Forced Oscillations Technique The non-invasive technique of forced oscillations (FOT), requiring no patient co-operation, was first introduced by Dubois et al. in 1956 [5]. Pressure oscillations produced by a loudspeaker are applied to a patient to measure the mechanical impedance of the lung or respiratory system in the frequency domain. There are two common methods for applying forced oscillations. With input impedance forced oscillations are imposed at the airway opening and pressure and flow are measured at this location. With transfer impedance forced oscillations are typically imposed around the chest wall. Then the pressure around the chest wall and flow at the airway opening are measured [6]. Since the work by Michaelson et al. [7], fast Fourier transform (FFT) has been used to calculate the impedance at several mixed frequencies, usually in the range of 2-32 or 2-64 Hz. To analyse the respiratory impedance usually a six- or nine-parameter model is used [5, 6]. This approach enables, among others, the separation of airway and tissue properties [8, 9], and tracking the variability of the parameters during a respiratory cycle [10, 11]. Another potentially useful approach for extracting information from measurements of oscillating flow and pressure is to extend high frequencies up to the range of kHz. The data display then acoustic anti-resonant peaks in the real part, providing information about dynamic mechanical properties of both the cartilage and soft tissues of the airway walls [12]. A typical approach to measure input impedance (Zin) has been implemented in our system (Fig.1) [13, 14]. Forced oscillations can be generated both in the range of 2-128 Hz and 2-2000 Hz, depending on a low-pass filter placed in the path between the D/A converter of the DAQ computer card and the power acoustic amplifier. Exciting signals in a sampled form, including the non-sum non-difference (NSND) rule one [15], are stored in pre-defined files, or they can be defined by the user. The collected pressure (P) and flow (Q) data are divided into N (used-defined) subsets and power spectral densities are calculated for each of them (GPP=FFT(P)·FFT∗(P) and GQQ=FFT(Q)·FFT∗(Q), respectively; the asterisk denotes the complex conjugate), as well as crosspower density (GQP=FFT(Q)·FFT∗(P)). Then the power densities are averaged, yielding mean signals GPP , GQQ , and GQP . The input impedance is estimated from
GPP , GQP
Z in ( f ) =
(1)
and additionally, the squared coherence function (γ2), a measure of extraneous noise and nonlinearities, is obtained as follows:
γ
2
GQP
(f )=
2
GPP ⋅ GQQ
, 0 ≤ γ 2 ≤ 1.
(2)
Then the standard error of the impedance estimates (Sz) is calculated at each frequency S z2 ( f ) = Z in ( f )
2
γ −2 ( f ) − 1 N −2
.
(3)
The resulting data is useful to identify e.g. the six- or nine-element models, minimizing the following criterion function J (the weighted least-squares method): n
J =∑ i =1
[Z in ( fi ) − Z m ( f i )]2 , S z2 ( f i )
(4)
where Zm is the model impedance and n is the number of frequencies included in the exciting signal. 2.2. Measurements during mechanical ventilation
Mechanical ventilation of human lungs is applied in case of total or partial failure of the respiratory function. The efficiency of ventilation depends on ventilator settings and their matching to the actual mechanical properties of the respiratory system, which can vary with time. The pressure and flow signals measured at the airway opening are used to estimate these properties. Recently, a new method to measure respiratory mechanics in the range of breathing frequencies was proposed [24, 25]. It assumes the use of a ventilator to excite the respiratory system of a conscious patient instead of supporting the lung function, and thus complements the previous diagnostic methods. For the diagnostic purposes, we have built a ventilator using a servo-motor (Allen-Bradley, USA) driven by a servo-controller (Allen-Bradley, USA) (Fig.1) [16]. The motor moves a piston placed in a cylinder via a linear guide (Hoerbiger-Origa, Germany). The produced flow follows user-defined waveforms stored in computer files. 2.2.1. Time Domain Methods Many algorithms tracking the time-variability of respiratory parameters have been elaborated. Most of them are based on recursive linear least-squares, e.g. [17, 18] or linear regression analysis of successive ventilatory cycles, e.g. [19, 20]. These methods use a simple functional model including total respiratory resistance (Rrs) and elastance (Ers) in series, described as follows t
P(t ) = Rrs Q(t ) + ∫ E rs Q(τ )dτ + P0 = Rrs Q(t ) + E rsV (t ) + P0 , 0
(1)
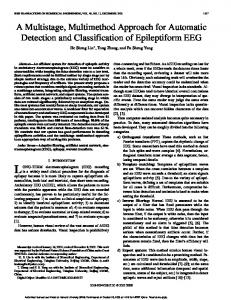
where P0 is end-expiratory pressure and V is air volume delivered by the ventilator to the lung. The algorithms assume a quasi-constant character of the respiratory properties or their functional dependence on flow and lung volume. In our measurement system the recursive least-squares algorithm with an exponential memory was implemented to analyse flow and pressure data measured at the airway opening during mechanical ventilation with a step flow on inspiration and passive expiration. The forgetting factor was chosen according to the results of simulation studies, minimizing the relative mean-squared error [21]. This standard method was supplemented by a procedure realising the Kalman filter applied as a parameter estimator. Also parameters of the Kalman filter were optimized during the simulation studies [21]. As the third method of pulmonary properties tracking during mechanical ventilation, a new approach taking advantage of prior knowledge of processes occurring in the respiratory system was elaborated and implemented [22]. 2.2.2. Optimal Ventilation Methods The operating frequency range of the respiratory system is about 0.1-2 Hz and there is a need to measure the primary mechanical properties and mechanisms that affect breathing at these frequencies. The most efficient approach consists in coupling mechanical ventilation with forced oscillations [23, 24]. The standard rectangular ventilatory waveform should not be used due to poor signal-to-noise ratio (SNR) at harmonic frequencies as well as harmonic distortion following respiratory nonlinearities. Thus, a forcing signal containing selected frequencies from the natural breathing range - the optimal ventilatory waveform (OVW), producing a tidal volume of about 0.5 dm3, has been elaborated [24]. The frequencies are of the NSND design, i.e. none of them is an integer multiple of another and none can be created by the sums or differences of combinations of the others. The phases are optimized to produce a waveform that maximizes the volume delivered while minimizing the peak-to-peak pressure. The OVW presents, however, two problems. First, the active expiratory component makes it impossible to use the OVW in patients with severe obstruction, compressing dynamically their airways (a strongly non-linear process). Second, it is generated by a closed system in which no fresh gas is delivered to the patient. These drawbacks have forced the elaboration of the enhanced ventilatory waveform (EVW) [25] which allows passive expiration when filling the ventilator with fresh air. The expiratory data are not analysed, so the EVW maintains ventilatory support and simultaneously provides an accurate assessment of pulmonary mechanics, despite severe airway obstruction resulting in expiratory flow limitation. Simulated signals of the OVW and EVW are presented in Fig. 2 for comparison. A Flow [dm s ]
3 -1
-0.2
-0.8
0
2
4
6
8
10
-0.2
-0.8
12
0
2
4
0
2
4
6
8
10
12
6
8
10
12
0.6
Volume [dm ]
0.6 3
3
Volume [dm ]
B
0.4
3 -1
Flow [dm s ]
0.4
0.4 0.2 0
0
2
4
6
Time [s]
8
10
12
0.4 0.2 0
Time [s]
Fig. 2. Ventilatory waveforms and air volume delivered to the lung: A) OVW, and B) EVW.
Both ventilation techniques have been implemented in our measurement system [16]. The computer-generated exciting signals sampled at 40 Hz are stored in the files. They are used to
activate the piston-cylinder system. The resulting pressure and flow measured at the airway opening (sampled also at 40 Hz) are used to estimate the input impedance at seven frequencies covered by the waveforms. In case of the EVW traditional spectral methods cannot be used to compute the impedance because the EVW sinusoids do not have an integer number of cycles during the inspiratory period and there are transient components in both signals measured. To avoid these problems, knowledge of the frequencies is used to model the flow (Qm) and pressure (Pm) with the trigonometric series:
( )
(
7
)
(
7
)
Qm t nm = a0 + ∑ a k cos 2πf k t nm + ∑ bk sin 2πf k t nm , k =1
( )= c + ∑c
Pm t
m n
m 0
k =1
7
k =1
k
(
cos 2πf t
m k n
)+ ∑ d 7
k =1
k
(
)
(6)
sin 2πf t , m k n
where tnm is the time of the n-th sample during m-th inspiration, fk are specified frequencies, and ak, bk, ck, and dk are real coefficients. An algorithm for estimation of the above parameters form the measured flow and pressure signals has been elaborated and verified [25, 26]. It applies the leastsquares method to calculate the vector of the parameter estimates ( θˆ S ): θˆ S = ( X TS X S ) −1 X TS S ,
(7)
where S stands for flow or pressure, respectively, and X is the matrix of model sensitivity to its parameters XQ = ∂Qm ∂θQ , X P = ∂Pm ∂θ P . The inspiratory input impedance can be computed at each discrete frequency fk as: cˆ − jdˆk . Zˆ in ( f k ) = k aˆ k − jbˆk
(8)
Finally, the frequency-dependent respiratory resistance (Rrs) and elastance (Ers) are estimated:
[
]
Rˆ rs ( f k ) = Re Zˆ in ( f k ) , Eˆ rs ( f k ) = −2 π f k Im Zˆ in ( f k ) .
[
]
(9)
2.3. Interrupter Technique
The interrupter technique has become a rapid, non-invasive and convenient means of measuring respiratory resistance since its introduction by von Neergaard and Wirz [27]. It requires only that the flow and pressure signals are registered at the airway opening while the flow is suddenly interrupted. Immediately on occlusion there is a rapid jump in pressure equal to the resistive pressure drop across the airways just before the interruption, with a contribution from the chest wall, giving assessment of the interrupter airway resistance (Rint). This is followed by a slower increase of the pressure reflecting stress recovery of lung and chest wall tissues, disrupted by highly damped oscillations. The power spectrum of these oscillations exhibits two peaks. The larger peak reflects the quarter-wave resonance of the airway gas, and the second one reflects a tissue resonance [28]. Despite some doubts about physiological interpretation of these pressure changes, the technique has been of great interest during the last decades. Among others it has been shown that the frequency and the damping coefficient of pressure oscillations are correlated with lung mechanical properties [29, 30], and that using a high-speed valve it is possible to measure also the
high-frequency input impedance (up to 800 Hz) with better SNR than in the case of forced oscillations. Interruption of airflow during passive expiration for about 100 ms is accomplished by an electro-driven shutter combined with the pressure transducer (Jaeger, Germany) in our system (Fig. 1). The acquired transients of pressure and flow are used for parametric identification of a lung model - a novel measurement method probing pulmonary mechanics, elaborated in the Chair of Electronic and Photonic Metrology, Wroclaw University of Technology [32, 33]. 2.4. Spirometry
Spirometry is a physiological test that measures inspiration and expiration of air as a function of time. The primary signal measured in spirometry may be volume or flow. Traditionally, the volume changes are presented versus time, however the most popular test of lung function is forced expiration, when a maximal volume of air is exhaled with maximally forced effort from maximal inspiration. Then the measured maximal flow is plotted against the exhaled air volume. The maximum expiration flow-volume (MEFV) curve is effort-independent due to airflow limitation and simultaneously its shape is sensitive to respiratory disorders [34]. The spirometric curves do not lead clinicians directly to a diagnosis, rather some indications are used to this end. The most important aspects of spirometry are: the forced vital capacity (FVC), which is the volume delivered during an expiration made as forcefully and completely as possible starting from full inspiration, the forced expiratory volume in one second (FEV1), which is the volume delivered in the first second of a FVC manoeuvre, as well as the mean forced expiratory flow between 25% and 75% of the FVC (FEF25-75%) and the peak expiratory flow (PEF). The interpretation of spirometric indices is based on their comparison with reference values. Usually, the reference values are calculated with equations derived from measurements of a representative sample of healthy subjects in a general population and taking into account the gender, height and weight of the patient. Spirometric measurements are simple comparing with other implemented methods, since they require only a pneumotachometer (Jaeger, Germany) converting flow into a voltage signal (Fig. 1), completed by software procedures of data acquisition and processing. Measurement protocols follow common recommendations of the European Respiratory Society (ERS) and the American Thoracic Society (ATS) [35, 36, 37]. Reference equations for European populations have been applied in the system according to the formulas proposed in [35] and [38]. 3. COMPUTATIONAL MODELS Mathematical models play a fundamental role in the cognitive process in metrology [39]. They are of two kinds. The forward models follow the structure of a system and incorporate main physical (physiological) phenomena, thus usually are very complex, dynamic and nonlinear. They allow simulating the system behaviour under investigated circumstances and analyzing courses of internal variables. The inverse models, much more simple and of functional nature, are used to estimate system parameters from measured data. The real utility of forward modelling becomes apparent when it is used to interpret the results of measurements [40]. A few inverse models applied in the techniques for measurement of pulmonary parameters have been described above. In the next paragraphs forward models included in the measurement system will be presented. 3.1. Models for Forced Oscillations
3.1.1. A Complex Linear Model
-3
Elastance [kPa·dm ] Resistance [kPa·dm s]
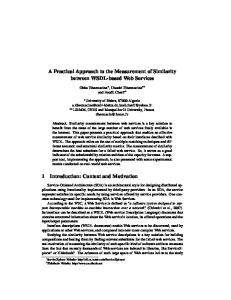
The model elaborated at the Department of Biomedical Engineering, Boston University, uses an asymmetric branching airways system derived from anatomic casting studies, incorporating inhomogeneous airway constriction and airway wall properties coupled to the airway geometry and wall soft tissue (Zs) and cartilage (Zc) [41] (Fig. 3A). The model consists of 35 airway orders having own lengths and diameters. The impedance of the i-th order (i.e. resistance Ri, inertance Ii and compliance Ci) is computed using an equivalent acoustic transmission line model. At the end of each terminal airway an alveolus-tissue model is attached (Fig. 3B). It consists of an alveolar gas compressibility (Cg) in parallel with a constant phase tissue part (including tissue damping G and elastance H) and tissue inertia It. The model enables, among others, quantifying the contribution of the degree of heterogeneous constriction to the frequency dependence of respiratory resistance and elastance (Fig. 3C). A Ii/2
Ri/2
Ci
Zs
Ri/2
Zc
Z2
-3
B
Ii/2
G – jH
ωα
It
Cg
C
1.5 1 0.5 0
0
0.5
1
1.5
0
0.5
1
1.5
7
2.5
3
3.5
4
4.5
5
2
2.5
3
3.5
4
4.5
7
4 3 2 1 0 -1
Frequency [Hz]
Fig. 3. Complex model for respiratory impedance: A) structure of a single airway, B) structure of an alveolus-tissue component, and C) respiratory resistance and elastance vs. frequency for normal case (-), and mild heterogeneous peripheral constriction of airways (---) and lung tissue (·····).
3.1.2. Functional Linear Models A common feature of functional models for the lung subject to forced oscillations is that they have a simple linear structure enabling analytical calculation of input or transfer impedance for a given frequency. Oversimplification of the respiratory system is compensated here by very fast computations and by the possibility to simulate the system in the time domain. We have implemented the traditional six-element DuBois model [5], its nine-element modification incorporating some inhomogeneous pathways [6], as well as more developed structure including airway compliance (Caw) to investigate the impact of Caw on measurement results [42]. 3.2. Models for Mechanical Ventilation
3.2.1. A Complex Nonlinear Model A complex nonlinear model for mechanical ventilation has been elaborated, implemented and validated in the Chair of Electronic and Photonic Metrology, Wroclaw University of Technology [43]. The model includes the morphometry-based symmetrical structure of the 24 airway generations, the dynamic properties of the respiratory system, as well as the description of a ventilator. The distributed character of airway mechanical properties is taken into account when determining airway inertance, resistance and compliance, including turbulence of flow, airway collapsing and the wave speed theory. In effect, the airway parameters vary within the ventilatory cycle and their values are nonlinear functions of control signals. The results of simulations
corresponding to normal conditions and airway narrowing are consistent with the published experimental data. The model enables investigations on how specific pathological changes influence the signals and physiological variables during mechanical ventilation (Fig. 4), as well as testing known and developing new algorithms tracking time-variability of the respiratory parameters. A
1.6 1.4 1.2 1 0.8 0.6 0.4 0.2 0
15
20
25
30
35
B
0.81
Respiratory elastance [kPa·dm-3]
Respiratory resistance [kPa·dm-3·s]
1.8
40
45
50
55
60
0.805
0.8
0.795
0.79
0.785
0.78
15
20
25
Time [s]
30
35
40
45
50
55
60
Time [s]
Fig. 4. Time-varying respiratory parameters during airway constriction: A) respiratory resistance Rrs, and B) respiratory elastance Ers.
3.2.2. Functional Nonlinear Models The forward model for mechanical ventilation described above captures both the airway structure and nonlinear mechanical phenomena, but its complexity makes that simulations take several dozens of minutes - a time too long to generate hundreds of ventilatory cycles. Such huge amount of data is needed when, for instance, artificial neural networks are taught to analyse respiratory mechanics [44]. Thus, several simple functional models have been proposed during the last decades, e.g. [45, 46]. We have worked out a set of non-linear functional models being able to quickly simulate hundreds of cycles for different stages of the respiratory system ventilated with the rectangular waveform, as well as with the OVW and EVW [47, 26]. The models include airway resistance dependence both on lung volume and airflow, and also respiratory elastance relationship to lung volume. 3.3. Models for Forced Expiration
3.3.1. A Complex Asymmetrical Model A complex nonlinear model has been developed and set in the system to predict maximal expiration through a morphometry-based asymmetrical bronchial tree (Fig. 5A) [48]. It assumes the asymmetrical Horsfield-like geometry of the airway structure [3], includes wave-speed flow limitation and takes into consideration separate airflows from several independent alveolar compartments. The airflow values are calculated for quasi-static conditions by solving a system of nonlinear differential equations describing static pressure losses along the airway branches. Calculations done for succeeding lung volumes result in the semi-dynamic maximal expiratory flow-volume (MEFV) curve. Simulations performed show that the model captures the main phenomena observed in vivo during forced expiration: effort-independence of the flow-volume curve for most of the vital capacity, independence of limited flow on the properties of airways downstream the choke points, characteristic differences of lung regional pressures and volumes, and the shape of their variability during exhalation. Some new insights into the flow limitation
mechanism can be achieved with the model. For example it has been shown that flow limitation begins at slightly different time instants in individual branches of the bronchial tree, however after a short period of time, all regional flows are limited in a parallel fashion, each of the airway branches contributes its own flow-volume shape and just these individual flows constitute the measured MEFV curve, and the bronchial tree asymmetry is responsible for the non-gravitational component of regional volume variability [48]. Additionally, it is possible to track choke-points movement along the airway generations during forced expiration (Fig. 5B) [49].
B
C1 S1
A1
(31)
q1
C2
q2
(35)
A2
A4
(34)
(32)
A3 (33)
S2 (28)
q3
C3
S7 (29) C7
A6
q4
S3 (29)
A5 (33) q 7
S4 (31)
(32) q5
q6
S6 (28)
S5
C6
(31)
C4 C5
Position of an airway in the pathway
A
0.9 5
0.8 0.7
10
0.6 0.5
15 0.4 0.3 20 0.2 0.1 25 0.5
1.0
1.5
2.0
2.5
Time of expiration [s]
Fig. 5. Complex model for forced expiration: A) model structure, and B) index of wave-speed flow limitation (values given by the greyscale) in airways belonging to the pathway leading from C1 alveolar compartment.
3.3.2. A Complex Symmetrical Model The anatomic basis for the homogeneous model for forced expiration [50, 51] is a dichotomously branching bronchial tree structure based on the idealized lung geometry of Weibel [2]. It consists of 24 symmetrical branching airway generations with the mechanical properties of each generation being independently specified. All of the airways, apart from the trachea, are treated as intrapleural with external pressure assumed to be a pleural one. The model includes the basic physiological phenomena accompanying the forced vital capacity maneuver, as flow limitation in the airways, nonlinear relations between airway lumens and transmural pressure, nonlinear lung recoil characteristics, intrapleural bronchi length dependence on lung volume, as well as the mathematical description of the driving pressure as a function of lung volume. A given tracheal volume flow is distributed evenly among the airways in each generation. The pressure loss across the entire bronchial tree is calculated for this flow by integrating (from the alveoli to the trachea) the expression for the pressure gradient for consecutive airway generations. The integration is interrupted at each airway junction for the evaluation of the convective acceleration of the gas. Flow is then increased and the pressure integration is repeated for the new flow value. Maximum flow is identified when the pressure and/or flow accuracy criteria are reached. Successive maximal airflow values are calculated for quasi-static conditions at succeeding lung volumes in the whole range of FVC. The cognitive potential of the model has been demonstrated when using it to investigate lung function evolution after heart-lung transplantation [52]. 4. SUMMARY
The respiratory system is a primary component of the human body sustaining its vital functions. The very complex design of the lung and the multiplicity of occurring phenomena make that many methods have been elaborated to investigate the system. The methods cover both measurement techniques and mathematical modelling. Each of them provides one with a different kind of information about the lung. It seems that a combination of these methods may lead to a new-quality approach to research into the respiratory system. In this paper the multi-method system developed for complex investigations of lung mechanics is presented. It includes several complementary measurement techniques such as forced oscillations, interrupter technique, methods for measurement of pulmonary mechanics during artificial ventilation and spirometry. These techniques characterize both total and local pulmonary properties in the time and frequency domains. They are completed by computational models for the respiratory system under different circumstances, enabling an analysis of the relation between the lung structure, function, pathology and measurement results. The measurement system can be considered as a first step towards a new-quality approach providing specific, reliable and complex insight into the lung mechanics via multi-method fusion. The authors are grateful to Professor Kenneth R. Lutchen from the Department of Biomedical Engineering, Boston University, Boston, MA, for making available the complex computational model for forced oscillations. REFERENCES 1. Weibel E.R., Sapoval B., Filoche M.: Design of peripheral airways for efficient gas exchange. Respir. Phys. Neurobiol., vol. 148, no. 1-2, 2005, pp. 3-21. 2. Weibel E.R.: Morphometry of the Human Lung. Berlin, Springer 1963. 3. Horsfield K., Dart G., Olson D.E., Cumming G.: Models of the human bronchial tree. J. Appl. Physiol., vol. 31, no. 2, 1971, pp. 207-217. 4. Venegas, J.G., et al.: Self-organized patchiness in asthma, a prelude to catastrophic shifts? Nature, vol. 434, no. 7034, 2005, pp. 777-782. 5. DuBois A.B., Brody A.W., Lewis D.H., Burgess B.F. Jr.: Oscillation mechanics of lungs and chest in man. J. Appl. Physiol., vol. 8, no. 6, 1956, pp. 587-594. 6. Peslin R., Duvivier C., Gallina C.: Total respiratory input and transfer impedances in humans. J. Appl. Physiol., vol. 59, no. 2, 1985, pp. 492-501. 7. Michaelson E.D., Grassman E.D., Peters W.R.: Pulmonary mechanics by spectral analysis of forced random noise. J. Clin. Invest., vol. 56, no. 5, 1975, pp. 1210-1230. 8. Lutchen K.R., Everett J.R., Jackson A.C.: Impact of frequency range and input impedance on airway-tissue separation implied from transfer impedance. J. Appl. Physiol., vol. 74, no. 3, 1993, pp. 1089-1099. 9. Tomalak W., Peslin R., Duvivier C.: Respiratory tissue properties derived from flow transfer function in healthy humans. J. Appl. Physiol., vol. 82, no. 4, 1997, pp. 1098-1106. 10. Tomalak W., Peslin R., Duvivier C.: Variations in airways impedance during respiratory cycle derived from combined measurements of input and transfer impedances. Eur. Respir. J., vol. 12, no. 6, 1998, pp. 1436-1441. 11. Jensen A., Atileh H., Suki B., Ingenito E.P., Lutchen K.R.: Selected contribution: airway caliber in healthy and asthmatic subjects: effects of bronchial challenge and deep inspirations. J. Appl. Physiol., vol. 91, no. 1, 2001, pp. 506-515. 12. Suki B., Habib R.H., Jackson A.C.: Wave propagation, input impedance, and wall mechanics of the calf trachea from 16 to 1,600 Hz. J. Appl. Physiol., vol. 75, no. 6, 1993, pp. 2755-2766. 13. Guszkowski T., Polak A.G., Mroczka J., Wszoła W.: Optimization of forced oscillation phases by means of a genetic algorithm. XII Scientific Conference „Biocybernetics and Bioengineering”, Warszawa, November 28-30, 2001, pp. 390-393. (in Polish) 14. Wysoczański G., Polak A.G., Mroczka J.: A computer-based system for measurement of respiratory system properties with the use of high-frequency forced oscillations. Congress of Metrology KM 2004, Wrocław, September 6-9, 2004, pp. 619-622. (in Polish) 15. Suki B., Lutchen K.R.: Pseudorandom signals to estimate apparent transfer and coherence functions of nonlinear systems: applications to respiratory mechanics. IEEE Trans. Biomed. Eng., vol. 39, no. 11, 1992, pp. 1142-1151. 16. Wysoczański D., Polak A.G., Mroczka J.: A computer-based system for measurement of respiratory system properties with the use of low-frequency forced oscillations. Congress of Metrology KM 2004, Wrocław, September 6-9, 2004, pp. 611-614. (in Polish)
17. Lauzon A.M., Bates J.H.T.: Estimation of time-varying respiratory mechanical parameters by recursive least squares. J. Appl. Physiol., vol. 71, no. 3, 1991, pp. 1159-1165. 18. Avanzolini G., Barbini P., Cappello A., Cevenini G.: Influence of flow pattern on the parameter estimates of a simple breathing mechanics model. IEEE Trans. Biomed. Eng., vol. 42, no. 4, 1995, pp. 394-402. 19. Barbini P., Cevenini G., Bernardi F., Massai M.R., Gnudi G., Avanzolini G.: Effect of compliant intermediate airways on total respiratory resistance and elastance in mechanical ventilation. Med. Eng. Phys., vol. 23, no. 3, 2001, pp. 185-194. 20. Vassiliou M.P., et al.: Volume and flow dependence of respiratory mechanics in mechanically ventilated COPD patients. Respir. Physiol. Neurobiol., vol. 135, no. 1, 2003, pp. 87-96. 21. Polak A.G., Mroczka J. Pukacz A: A recursive algorithm for estimation of respiratory system parameters during mechanical ventilation. Congress of Metrology KM 2004, Wrocław, September 6-9, 2004, pp. 607-610. (in Polish) 22. Polak A.G., Mroczka J.: A method for estimation of time-varying properties of the respiratory system using the prior knowledge. Congress of Metrology KM 2004, Wrocław, September 6-9, 2004, pp. 577-580. (in Polish) 23. Peslin R., Felicio da Silva J., Duvivier C., Chabot F.: Respiratory mechanics studied by forced oscillations during artificial ventilation. Eur. Respir. J., vol. 6, no. 6, 1993, pp. 772-784. 24. Lutchen K.R., Yang K., Kaczka D.W., Suki B.: Optimal ventilatory waveform for estimating low frequency mechanical impedance. J. Appl. Physiol., vol. 75, no. 1, 1993, pp. 478-488. 25. Kaczka D.W., Ingenito E.P., Lutchen K.R.: Technique to determine inspiratory impedance during mechanical ventilation: implications for flow limited patients. Ann. Biomed. Eng., vol. 27, no. 3, 1999, pp. 340-355. 26. Polak A.G., Woźny Z., Mroczka J.: Validation of the algorithm for estimation of respiratory impedance during mechanical ventilation by the EVW. VIII Symposium „Modelling and Measurements in Medicine”, Krynica, May 14-18, 2006. (submitted, in Polish) 27. Neergaard J. von, Wirz K.: Die Messung der Strömungswiderstände in den Atemwegen des Menschen, insbesondere bei Asthma und Emphysem. Z. Klin. Med., vol. 105, 1927, pp. 51-82. 28. Romero P.V., Sato J., Shardonofsky F., Bates J.H.T.: High frequency characteristics of respiratory mechnaics determined by flow interruption. J. Appl. Physiol., vol. 69, no. 5, 1990, pp. 1682-1688. 29. Frey U., Schibler A., Kraemer R.: Pressure oscillations after flow interruption in relation to lung mechanics. Respir. Physiol., vol. 102, no. 2-3, 1995, pp. 225-237. 30. Frey U., Kraemer R.: Oscillatory pressure transients after flow interruption during bronchial challenge test in children. Eur. Respir. J., vol. 10, no. 1, 1997, pp. 75-81. 31. Frey U., Suki B., Kraemer R., Jackson A.C.: Human respiratory input impedance between 32 and 800 Hz, measured by interrupter technique and forced oscillations. J. Appl. Physiol., vol. 82, no. 3, 1997, pp. 1018-1023. 32. Polak A.G., Jabłoński I., Mroczka J.: Reduction of a mathematical model for the respiratory system during flow interruption. XI Scientific Conference „Biocybernetics and Bioengineering”, Warszawa, December 2-4, 1999, pp. 65-69. (in Polish) 33. Jabłoński I., Polak A.G., Mroczka J.: Methods of identification of the respiratory system after flow interruption. PAK, vol. 8, 2000, pp. 18-22. (in Polish) 34. Hyatt R.E.: Expiratory flow limitation. J. Appl. Physiol., vol. 55, no. 1, 1983, pp. 1-7. 35. Quanjer P.H., Tammeling G.J., Cotes J.E., Pedersen O.F., Peslin R., Yernault J.-C. Lung volume and forced ventilatory flows. Report Working Party Standardization of Lung Function Tests, European Community for Steel and Coal. Official Statement of the European Respiratory Society. Eur. Respir. J., vol. 6, suppl. 16, 1993, pp. 5-40. 36. American Thoracic Society. Standardization of spirometry, 1994 update. Am. J. Respir. Crit. Care Med., vol. 152, no. 3, 1995, pp. 1107-1136. 37. Miller M.R., et al.: Standardisation of spirometry. Eur. Respir. J., vol. 26, no. 2, 2005, pp. 319-338. 38. Roca J., et al.: References values for forced spirometry. Group of the European Community Respiratory Health Survey. Eur. Respir. J., vol. 11, no. 6, 1998, pp. 1354-1362. 39. Mroczka J.: Metrology in the process of cognition. In: Barzykowski J. (Ed.): Contemporary Metrology - Selected Problems. Warszawa, WNT 2004. (in Polish) 40. Bates J.H., Lutchen K.R.: The interface between measurement and modeling of peripheral lung mechanics. Respir. Physiol. Neurobiol., vol. 148, no. 1-2, 2005, pp. 153-164. 41. Lutchen K.R., Greenstein J.L., Suki B.: How inhomogeneities and airway walls affect frequency dependence and separation of airway and tissue properties. J. Appl. Physiol., vol. 80, no. 5, 1996, pp. 1696-1707. 42. Polak A.G., Adamusiak Ł., Mroczka J.: Impact of airway compliance on measurement of respiratory mechanics by forced oscillations. Proceedings of the VII Symposium „Modelling and Measurements in Medicine”, Krynica, May 8-12, 2005, pp. 49-54. (in Polish) 43. Polak A.G., Mroczka J.: Nonlinear model for mechanical ventilation of human lungs. Compt. Biol. Med., vol. 36, no. 1, 2006, pp. 41-58. 44. Polak A.G., Grześkowiak B., Mroczka J.: Measurement of respiratory system properties during mechanical ventilation with the use of neural networks. VIII Symposium „Modelling and Measurements in Medicine”, Krynica, May 14-18, 2006. (submitted, in Polish) 45. Golden J.F., Clark J.W. Jr, Stevens P.M.: Mathematical modeling of pulmonary airway dynamics. IEEE Trans. Biomed. Eng., vol. 20, no. 6, 1973, pp. 397-404.
46. Barbini P., Cevenini G., Avanzolni G.: Nonlinear mechanisms determining expiratory flow limitation in mechanical ventilation: a model-based interpretation. Ann. Biomed. Eng., vol. 31, no. 8, 2003, pp. 908-916. 47. Polak A.G., Mroczka J.: Computational model for mechanical ventilation of a patient. Congress of Metrology KM 2004, Wrocław, September 6-9, 2004, pp. 603-606. 48. Polak A.G., Lutchen K.R.: Computational model for forced expiration from asymmetric normal lungs. Ann. Biomed. Eng., vol. 31, no. 8, 2003, pp. 891-907. 49. Polak A.G., Mroczka J.: Model analysis of the choke points arrangement during forced expiration. 6th IFAC Symposium on Modelling and Control in Biomedical Systems, Reims, September 20-22, 2006 (submitted). 50. Lambert R.K., Wilson T A., Hyatt R E., Rodarte J.R.: A computational model for expiratory flow. J. Appl. Physiol.: Respirat. Environ. Exercise Physiol., vol. 52, no. 1, 1982, pp. 44-56. 51. Polak A.G.: A forward model for maximum expiration. Comp. Biol. Med., vol. 28, no. 6, 1998, pp. 613-625. 52. Morlion B., Polak A.G.: Simulation of lung function evolution after heart-lung transplantation using a numerical model. IEEE Trans. Biomed. Eng., vol. 52, no. 7, 2005, pp. 1180-1187.
WIELOMETODOWE PODEJŚCIE DO POMIARÓW WŁAŚCIWOŚCI MECHANICZNYCH UKŁADU ODDECHOWEGO Streszczenie Układ oddechowy jest podstawowym systemem podtrzymującym funkcje życiowe organizmu człowieka. Wysoce złożona budowa płuc i wielorakość zachodzących w nich procesów powodują, że opracowano wiele metod badania układu oddechowego. Obejmują one zarówno techniki pomiarowe jak i modelowanie matematyczne. Każda z metod dostarcza innego zasobu informacji o płucach. Wydaje się, że ich połączenie może stanowić podstawę jakościowo nowego podejścia w badaniach nad układem oddechowym. Z tego też powodu zbudowano system łączący kilka uzupełniających się technik pomiarowych, takich jak wymuszone oscylacje, przerywanie przepływu powietrza, pomiar właściwości mechanicznych płuc podczas sztucznej wentylacji i spirometria. Techniki te wzbogacone zostały o zaimplementowane modele komputerowe płuc działających w różnych warunkach, pozwalające analizować związki pomiędzy ich strukturą, funkcjonowaniem, zachodzącymi procesami patologicznymi i wynikami pomiarów. Skonstruowany system stanowi pierwszy krok w kierunku bardziej szczegółowego, wiarygodnego i wyczerpującego zrozumienia funkcjonowania układu oddechowego, bazującego na fuzji wyników wielu metod badawczych.