Head of Computer Science Department. Date: 25 / 03 / 2014. Page 3 of 112. A Multi-mode Internet Protocol Intrusion Detec
A MULTI-MODE INTERNET PROTOCOL INTRUSION DETECTION SYSTEM
A THESIS SUBMITTED TO THE COUNCIL OF THE FACULTY OF SCIENCE AND SCIENCE EDUCATION SCHOOL OF SCIENCE, UNIVERSITY OF SULAIMANI IN PARTIAL FULFILLMENT OF THE REQUIREMENTS FOR THE DEGREE OF MASTER OF SCIENCE IN COMPUTER
BY DEEMAN YOUSIF MAHMOOD B.SC. COMPUTER SCIENCE (2008), UNIVERSITY OF KIRKUK
SUPERVISED BY DR. MOHAMMED ABDULLAH HUSSEIN ASSISTANT PROFESSOR
June (2014 A.D)
Pushpar (2714 K)
بسم اهلل الرمحن الرحيم
َ َ ُ ُ ِّ ْ ْ َّ َ ا وما أو ِتيتم من العِلم ِ ِإال قلِيل
صدق اهلل العظيم
اإلسراء 58
Supervisor Certification I certify that the preparation of this thesis entitled, "A Multi-mode Internet Protocol Intrusion Detection System" accomplished by (Deeman Yousif Mahmood) was prepared under my supervision at the School of Science, Faculty of Science and Science Education at the University of Sulaimani, as partial fulfillment of the requirements for the degree of Master of Science in Computer Science.
Signature: Name: Ass. Prof. Dr. Mohammed Abdullah Hussein University of Sulaimani, Electrical Engineering Department Date: 25 / 03 / 2014
In view of the available recommendation, I forward this thesis for debate by the examining committee.
Signature: Name: Dr. Kamaran HamaAli Faraj University of Sulaimani, Head of Computer Science Department Date: 25 / 03 / 2014
Linguistic Evaluation Certification
I hereby certify that this thesis entitled, "A Multi-mode Internet Protocol Intrusion Detection System" prepared by Deeman Yousif Mahmood, has been read and checked and after indicating all the grammatical and spelling mistakes; the thesis was given again to the candidate to make the adequate corrections. After the second reading, I found that the candidate corrected the indicated mistakes. Therefore, I certify that this thesis is free from mistakes.
Signature: Name
: Jutiar Omer Salih
Position : English Department, School of Languages, University of Sulaimani Date
:
14 / 04 / 2014
Examining Committee Certification
We certify that we have read this thesis entitled "A Multi-mode Internet Protocol Intrusion Detection System" prepared by (Deeman Yousif Mahmood), and as Examining Committee, examined the student in its content and in what is connected with it, and in our opinion it meets the basic requirements toward the degree of Master of Science in Computer Science.
Signature:
Signature:
Name: Dr. Subhi R. M. Zebari
Name: Dr. Suzan Abdulla Mahmood
Title: Assistant Professor
Title: Assistant Professor
Date: 20 / 7 / 2014
Date: 17 / 7 / 2014
(Chairman)
(Member)
Signature:
Signature:
Name: Dr. Kamaran HamaAli Faraj
Name: Dr. Mohammed A. Hussein
Title: Lecturer
Title: Assistant Professor
Date: 21 / 7 / 2014
Date: 17 / 7 / 2014
(Member)
(Supervisor‐Member)
Approved by the Dean of the Faculty of Science.
Signature: Name: Dr. Bakhtiar Qader Aziz Title: Professor Date: 7 / 8 / 2014 (The Dean)
Dedication
This thesis is dedicated to: My parents for their endless love, support and encouragement, source of motivation and strength during moments of despair and discouragement.
Acknowledgments
Behind every successful work, there is a lot of devotion, hard work, efforts and sacrifice. Thanks to Allah for giving me this opportunity, the strength and the patience to complete my dissertation finally, after all the challenges and difficulties. This work would not have made it to this stage without the guidance of Dr. Mohammed Abdullah Hussein; I would like to thank him for introducing me to this interesting problem of network security. His knowledge, support, and guidance have a great contribution to the success of this work. I also would like to express my gratitude to all teaching staff at the university of Sulaimani/ School of Science – Computer Science Dept., who taught me during my Master courses; I really appreciate your efforts, encouragements and valuable instructions. Profound thanks to Prof. Dr. Hussein H. Khanaqa, previous president of Kirkuk University, for his encouragement during my work in rector office in presidency of Kirkuk University (2009-2012), and his valuable advice during my study which is a result of a great experience in directing and supervising for more than 35 years. Also I have to thank all my friends for their support, encouragement, and assistance in many aspects that I cannot list all them. Finally, I take this opportunity to thank my family for their moral support throughout my life. In particular, my parents who were behind me and inspired me during my entire studies. Their support and guidance gave me the power to struggle and survive during hard times.
Abstract Intrusion Detection Systems (IDS) are gaining more and more scope in the field of secure networks and new ideas and concepts regarding intrusion detection processes keep surfacing. Various services offered on the internet have problems of being unavailable for authorized users because of Denial-of-Service (DoS) attacks, which is the main concern of this thesis by implementing a semi-supervised hybrid IDS that can judge whether network traffics are normal or abnormal (attack) using machine learning techniques. To show the applicability of proposed intrusion detection approach the Knowledge Discovery and Data mining (KDD) Cup 99 dataset, which is considered as a standard dataset used for evaluation of security detection mechanisms, this dataset has served well to demonstrate that machine learning can be useful in intrusion detection. Two machine learning algorithms are applied to the basic security model to construct a semi-supervised hybrid technique for detecting intrusions: the K-means clustering (for unsupervised learning) and the Decision Tree algorithm (for supervised learning). These algorithms with information gain attribute ranking are used to filter and classify network packets. Although the K-means has been used previously for detecting intrusions, the addition of feature ranking enabled us to obtain better results compared to using K-means alone. With the K-means, packets could be classified either as normal or DoS packets, the DoS cluster feeds the Decision Tree, and with the addition of Decision Tree (DT) algorithm attack type classifications are made possible. Through the DT a hybrid system has been established. The result is an IDS that is effective in detecting network intrusions according to obtained high detection and low error rates, (DR = 98.2143%, Error Rate = 1.7857% for K-means and DR=99.9136%, Error Rate = 0.0864% for C4.5 Decision Tree).
i
CONTENTS
Abstract …………………………………………...………………………………… Contents …………………………………………………………………………….. List of Tables ……...………………………………………………………………... List of Figures ………………...…………………………………………………….. List of Abbreviations.…...…………………………………………………………...
i ii v vi vii
Chapter One: Introduction 1.1 Overview…………………………………………………………………...
1
1.2 Literature Survey…………………………………………………………...
3
1.3 Aim of the Thesis…………………………………………………………..
6
1.4 Thesis Outlines……………………………………………………………..
6
Chapter Two: Intrusion Detection and Data Mining 2.1 Introduction………………………………………………………………...
7
2.2 Definitions and Terminology……..………………………………………..
8
2.3 Intrusion Detection System (IDS)…..………………..........................……
11
2.4 Types of Intrusion Detection System………………………………………
12
2.4.1 Host-Based IDS…………………………………………......……..
13
2.4.2 Network-Based IDS……………..…………………………………
13
2.5 Intrusion Detection System Components and Requirements……………...
14
2.6 Intrusion Detection Techniques………………………….………………...
16
2.6.1 Anomaly Intrusion Detection……………...……………………....
17
2.6.2 Misuse Intrusion Detection………………………..……………….
18
2.7 Learning Procedures……………………………………………………….
19
2.8 Common Attacks and Vulnerabilities in NIDS…………………………....
20
2.9 Technical Discussion……………………………………………………….
21
2.9.1 Internet Protocol – IP………………………………………………
22
ii
2.9.2 Transmission Control Protocol – TCP…………………………….
22
2.10 IP Spoofing………………………………………………………………..
24
2.10.1 Denial of Service Attack…………………………………………..
25
2.11 Data Mining and Intrusion Detection System…………………………….
27
2.12 Feature Selection (FS)…………………………………………………….
28
2.12.1 General Methods for Feature Selection…………………………..
30
2.12.2 Information Gain (IG) Feature Selection…………………………
31
2.13 Clustering Algorithms…………………………………………………….
32
2.13.1 Classification of Clustering Algorithms…………………………..
33
2.13.2 K-means Algorithm………………………………………………
34
2.14 Decision Tree……………………………………………………………..
35
2.14.1 C4.5 Decision Tree Algorithm…………………………………...
36
2.15 Dataset Collection…………………………………………………………
38
2.15.1 Attacks in KDD Cup 99 Dataset………………………………….
39
2.15.2 Features of KDD Cup 99 Dataset…………………………………
39
Chapter Three: Proposed System Methodology 3.1 Introduction…………………………………………………………………
42
3.2 Dataset Pre-Processing……………………………………………………...
42
3.2.1 Dataset Transformation…………………………………………….
42
3.2.2 Dataset Normalization……………………………………………...
43
3.3 Proposed Detection Model………………………………………………….
44
3.4 Information Gain Feature Selection………………………………………...
46
3.5 K-means Clustering for the Proposed System……………………………...
47
3.5.1 Distance Calculation………………………………………………..
49
3.6 Decision Trees as a Model for Intrusion Detection………………………...
51
iii
Chapter Four: Implemented Results and Discussions
4.1 Introduction…………………………………………………………………..
55
4.2 Training and Testing the Dataset……………………………………………..
55
4.3 Experiment 1: Results of Pre-processing……………………………………..
55
4.3.1 Transformation and Normalization…………………………………...
55
4.3.2 Features Ranking and Subset Selection………………………………
59
4.4 Experiment 2: K-means Clustering (First Layer)……………………………..
61
4.5 Experiment 3: C4.5 Decision Tree (Second Layer)…………………………..
66
4.6 The Graphical User Interface (GUI)…………………………………………..
67
Chapter Five: Conclusions and Future Works 5.1 Conclusions……………………………………………………………………
71
5.2 Future Works…………………………………………………………………..
73
References………………………………………………………………………….
74
Appendices
iv
List of Tables
Table No.
Table Title
Page No.
2.1
Confusion Matrix
10
2.2
Comparison of Intrusion Detection Techniques
16
2.3
Basic Features of TCP Connection
40
2.4
Content Features of the TCP Connection
41
2.5
Time Based Features of the TCP Connection
41
3.1
Transformation Table for Different Values of Protocols, Flag and
43
Services 4.1
Sample Records of KDD Cup 99
56
4.2
Transformed Nominal Data and Normalized Numeric Data
57
Samples of KDD Cup 99 Dataset 4.3
Proportions of the Normal and DoS Classes in the Data Subset
58
4.4
Attribute Ranking by Information Gain
59
4.5
Attribute Ranking Using GainR for C4.5 DT
60
4.6
Attributes Centroid Using Euclidian Distance Metric for 20
62
Features with Highest Ranking 4.7
Attributes Centroid Using Manhattan Distance Metric for 20
63
Features with Highest Ranking 4.8
Evaluation and Results of K-means with Distance Functions Using
64
the Full Dataset 4.9
Evaluation and Results of K-means with Distance Functions Using
64
the Highest 10 Features Ranked by IG 4.10
Evaluation and Results of K-means with Distance Functions Using
65
the Highest 20 Features Ranked by IG 4.11
Evaluation and Results of C4.5 Algorithm
v
66
List of Figures
Figure No.
Figure Title
Page No.
2.1
OSI Model
21
2.2
IP Packet Header
22
2.3
TCP Packet Header
23
2.4
Types of Clustering Methods
34
2.5
Example of Decision Tree for IDS Classification
38
3.1
Records of the KDD Cup 99 Dataset
43
3.2
Records of the KDD Cup 99 Dataset After Transformation
44
3.3
Proposed Detection Model Structure
45
3.4
First Layer of Proposed Detection Model
47
3.5
K-means Clustering Flowchart
48
3.6
Euclidean Distance between Two Points
49
3.7
Manhattan Distance between Two Points
50
3.8
Decision Tree Structure for DoS Attack Classification
54
4.1
Comparative Chart of Distance Functions Values Using K-means
65
4.2
Main GUI of the Detection Model
68
4.3
Capturing and Classification of Network Traffics by the System
68
4.4
Extracting Normal and Attack Packets from Captured Packets
69
4.5
Log File of Captured Packets
70
vi
List of Abbreviations Abbreviation
Description
Acc
Accuracy
ACK
Acknowledge
ATM
Automated Teller Machine
CFS
Correlation-based Feature Selection
DDoS
Distributed Denial of Service attack
DNS
Domain Name Server
DoS
Denial of Service attack
DR
Detection Rate
DT
Decision Tree
ES
Expert System
FCBF
Fast Correlation-Based Feature selection
FN
False Negative
FNR
False Negative Rate
FP
False Positive
FPR
False Positive Rate
FS
Feature Selection
FSA
Feature Selection Algorithm
FTP
File Transfer Protocol
GainR
Gain Ratio
GUI
Graphical User Interface
HIDS
Host-based Intrusion Detection System
HTTP
Hyper Text Transfer Protocol
ICMP
Internet Control Message Protocol
IDE
Integrated Development Environment
IDS
Intrusion Detection System
vii
IG
Information Gain
IP
Internet Protocol
JDK
Java Development Kit
KDD
Knowledge Discovery in Database
MAE
Mean Absolute Error
MITM
Man In The Middle
ML
Machine Learning
MSE
Mean Square Error
NIDES
Next generation of Intrusion Detection Expert System
NIDS
Network-based Intrusion Detection System
OSI
Open Systems Interconnection
PCA
Principal Component Analysis
PoD
Ping of Death
PPV
Positive Predictive Value
R2L
Remote to Local
RMSE
Root Mean Squared Error
SOM
Self-Organizing Maps
SQL
Structured Query Language
SVM
Support Vector Machines
Sr. No.
Source Number
SYN
Synchronize
TCP
Transfer Control Protocol
TN
True Negative
TNR
True Negative Rate
TP
True Positive
TPR
True Positive Rate
U2R
User to Root
viii
Chapter One Introduction
Chapter One Introduction
1.1 Overview The world has seen rapid advances in science and technology in the last two decades. This has enabled dealing with a wide spectrum of human needs effectively. These needs vary from simple day-to-day needs like online shopping, online booking tickets, online banking, e-library, etc. [1]. These technologies have made life easier for average people, but make it harder for security experts and network administrators, and in the middle of this phenomenon, the rise and growth of a parallel technology is fearful that of compromising security, thereby resulting in different effects detrimental to the use of technology. This includes attacks on information, such as stealing private information, hacking, and outage of services [2]. Media and other forms of network security literature report the possibility of the existence of underground anonymous attack networks which can effectively attack any given target at any time [3]. An intrusion to a computer system does not need to be executed manually by a person; it may be executed automatically with engineered software. A well-known example of this is the Slammer worm (also known as Sapphire), which performed a global Denial of Service (DoS) attack in 2003. The worm exploited vulnerability in Microsoft’s SQL Server, which allowed it to disable database servers and overload networks. Slammer was the fastest computer worm in history and affected approximately 75,000 computer systems around the world within 10 minutes. Not only did the Slammer worm restrict the general Internet traffic, it caused network outages and unforeseen consequences such as canceled airline flights, interference with elections, and ATM failures [4].
1
Chapter One
Introduction
There are several mechanisms that can be adopted to increase the security in computer systems. A commonly used three-level protection is by [5]: Attack prevention: Firewalls, user names and passwords, and user rights. Attack avoidance: Encryption. Attack detection: Intrusion detection systems. Despite adopting mechanisms such as cryptography and protocols to control the communication between computers (and users), it is impossible to prevent all intrusions, Firewalls serve to block and filter certain types of data or services from users on a host computer or a network of computers, aiming to stop some potential misuse by enforcing restrictions. However, firewalls are unable to handle any form of misuse occurring within the network or on a host computer. Furthermore, intrusions can occur in traffic that appears normal [6]. IDS do not replace the other security mechanisms, but compliment them by attempting to detect when malicious behavior occurs. The purpose of an IDS, in general terms, is to detect network traffics when the behavior of a user conflicts with the intended use of the computer, or computer network, e.g., committing fraud, hacking into the system to steal information, conducting an attack to prevent the system from functioning properly or even break down. Before the 1990s, the intrusion detection was performed by system administrators, manually analyzing logs of user behavior and system messages, with poor chances of being able to detect intrusions in progress [7]. Due to the increased use of computers, the magnitude of data in contemporary computer networks still renders this a significant challenge, while the range of attacks that can be performed on targets is as broad as the spectrum of constructive technology itself, this thesis deals with a particular class of attacks known as Denial of Service (DoS) attacks that mostly uses IP spoofing. DoS attacks is a class of attacks on targets which aims at exhausting target resources, thereby denying service to valid users [3].
2
Chapter One
Introduction
1.2 Literature Survey As the network dramatically extended, security is considered as a major issue in networks. Internet attacks are increasing, and there have been various attack methods, researchers and companies have analyzed these methods and below are a survey on some of related researches: In 1980, the concept of intrusion detection began with Anderson’s seminal paper [8]; he introduced a threat classification model that develops a security monitoring surveillance system based on detecting anomalies in user behavior. In 1995, Anderson et al. [9], designed the Next generation of Intrusion Detection Expert System (NIDES) to operate in real time to detect intrusions as they occur. NIDES is a comprehensive system that uses innovative statistical algorithms for anomaly detection, as well as an expert system that encodes known in intrusion scenarios. Again in 1995, Kummer [10], used the classification of intrusion based on the "signatures" (patterns) they leave in the audit trial of the system made. The classification is intended or used in intrusion detection systems based on pattern matching. In 2002, Andrew et al. [11], used KDD CUP 1999 Data set for training and testing their model. Data were classified in to two classes: Normal (+1) and Attack (-1). They had used the SVM light freeware package. For data reduction, they had applied SVMs to identify the most significant features for detecting attack patterns. The procedure is to delete one feature at a time, and train SVMs with the same data set. By this process, 13 out of the 41 features of KDD CUP 1999 dataset are identified as most significant: 1, 2, 3, 5, 6, 9, 23, 24, 29, 32, 33, 34, and 36. Training was done using the RBF (Radial Bias Function) kernel option. In their
3
Chapter One
Introduction
experiment, authors got 98.9% accuracy for true negative case, and 99.7% accuracy for true positive case. In 2005 Mitrokotsa and Douligeris [12], proposed an approach that detects DoS attacks using Emergent Self-Organizing Maps. The approach is based on classifying “normal” traffic against “abnormal” traffic in the sense of DoS attacks. The approach permits the automatic classification of events that are contained in logs and visualization of network traffic. Extensive simulations show the effectiveness of this approach compared to previously proposed approaches regarding false alarms and detection rates. In 2008 Rajesh and Shina [13], proposed a method of analysis for the best feature selection method for Network intrusion detection model. In their paper they analyzed three measures namely: the Chisquare, Information Gain and the Gini Index methods for feature selection. These are the various filter based approaches that have been used. Among these filter based approaches given upon the open source Windows version 3.4 three of them were tested. Results have proved that the Information gain when used for the feature selection produces accurate results by accurately detecting the least prominent attack in the dataset. In 2009 Bian et al. [14], used K-means algorithm to cluster and analyze the data of KDD Cup 99 dataset. The simulation results that run on KDD Cup 99 dataset showed that the K-means method is an effective algorithm for partitioning large dataset and can detect unknown intrusions with detection rate 96%. In 2010 Affendey et al. [15], compared the efficiency of machine learning methods in intrusion detection system, including Classification Tree and Support Vector Machines. that Classification Decision Tree algorithm detects attacks at a very much greater rate than the Support Vector machines (SVM’s), the same dataset were evaluated with the two Data mining approaches. The correlation between the
4
Chapter One
Introduction
samples was measured by using the min-max normalization. The Results show that the C4.5 Classification Decision Tree algorithm is giving fewer false alarm rates than SVM. Again in 2010 Bharti et al. [16], used fuzzy k-mean clustering algorithm and random forest tree classification techniques for assigning a cluster to a particular class. From experimental results it is observed that for two class datasets the combination of clustering random forest tree gives the better results than the clustering alone. In 2012 Bhaskar and Kumar [17], presented an approach for identifying network anomalies by visualizing network flow data which is stored in weblogs. Various clustering techniques can be used to identify different anomalies in the network. Here, they present a new approach based on simple K-Means for analyzing network flow of data using different attributes like IP address, Protocol, Port number etc. to detect anomalies. By using visualization, they can identify which sites are more frequently accessed by the users. In their approach they provide overview about given dataset by studying network key parameters. In this process they used preprocessing techniques to eliminate unwanted attributes from weblog data. Since it is challenging for IDSs to maintain high accuracy, an IDS that uses attack signatures to detect intrusions cannot discover new attacks. These IDSs are becoming incapable of protecting computer system; therefore a detection approach that is able to detect new attacks is necessary for building reliable and efficient IDS. For this purposes an unsupervised data mining approach deployed the K-means clustering algorithm in the first layer of proposed IDS model, which is a selfadministrative and can learn new patterns within the dataset without any interference from outside (i.e., an administrator), and C4.5 DT deployed in the second layer for classifying DoS attack types which is a very accurate and easy classifier.
5
Chapter One
Introduction
1.3 Aim of the Thesis The aim of this thesis is to design an efficient IDS to detect DoS attacks in a NIDS. This thesis provides a survey of the state-of-the-art in the field of hybrid approaches applied to IDS’s and ends with implementing a system that utilizes unsupervised K-means and supervised Decision Tree algorithms. Additionally, it shows that each class of attacks could be treated separately as the thesis focuses only on DoS attack. In fact it is possible that at least one algorithm can be assigned to detect one class of attacks instead of using a single algorithm to detect all classes of attacks.
1.4 Thesis Outlines The rest of the thesis is organized as follows: Chapter Two (Intrusion Detection and Data Mining): This chapter deals with the concept of intrusion detection systems. It will also cover the different types of IDSs, and explain what a network-based IDS is, Machine learning types, used algorithms, and different types of attack and concepts of IP spoofing. Chapter Three (Proposed System Methodology): This chapter will cover an overall design of the IDS regarding the pre-processing, algorithms, and the overall proposed detection model structure. Chapter Four (Implemented Results and Discussions): This chapter will present results of functionally and efficiency test of the implemented IDS model.
Chapter Five (Conclusions and Future Works): This chapter will cover concluding remarks on the IDS and the whole work of this thesis, and gives some possibilities of future works.
6
Chapter Two Intrusion Detection and Data Mining
7
Chapter Two Intrusion Detection and Data Mining
2.1 Introduction Computer networks have expanded significantly in use and number. This expansion makes them target to different attacks [18]. It is obvious that, in today’s era of Information Technology, the sharing of resources and information in interconnected network is essential. But as to secure this information from unauthorized uses and manipulation, it is necessary to impose some restrictions. Some of the tools that are developed for these purposes are firewalls, anti-viruses and intrusion detection programs [19]. The use of an intrusion detection system is becoming common due to the increase in attack complexity and the evolution of computer systems. Generally intrusion detection system works in pre-defined manner regardless of the implementation mechanism selected. These are some common steps followed by the intrusion detection system [20]: Data is captured, often in the form of IP packets. The data are decoded and transformed into a uniform format, through the process of feature extraction. The data are then analyzed in a manner which is specific to the individual IDS, and classified as threatening or not. Alerts are generated if a threatening pattern is encountered. Computer and data security is a complex topic. The goals of computer security are [21]:
7
Chapter Two
Intrusion Detection and Data Mining
1. Data Confidentiality: protection of data so that it is not disclosed in an unauthorized fashion. 2. Data Integrity: protection against unauthorized modification of data. 3. Data Availability: protection from unauthorized attempts to withhold information or computer resources. This chapter starts with an introduction to the concept of intrusion detection system and the components of intrusion detection system. Algorithms and techniques of IDS that are used in this thesis are discussed.
2.2 Definitions and Terminology An Intrusion Detection System (IDS) employs techniques for modeling and recognizing intrusive behavior in a computer system. When referring to the performance and measurement factors of IDSs, the following terms are often used: Alarm: A signal suggesting that a system has been or is being attacked. True positive (TP): classifying an intrusion as an intrusion. The true positive rate is synonymous with detection rate, sensitivity and recall, which are terms often used in the literature. False positive (FP): incorrectly classifying normal data as an intrusion, also known as a false alarm. True negative (TN): correctly classifying normal data as normal. The true negative rate is also referred to as specificity. False negative (FN): incorrectly classifying an intrusion as normal.
In particular, the following measures will be used to assess the IDS's performance. The performances metrics are calculated as follows:
8
Chapter Two
Intrusion Detection and Data Mining
𝑇𝑟𝑢𝑒 𝑃𝑜𝑠𝑖𝑡𝑖𝑣𝑒 𝑅𝑎𝑡𝑒(𝑇𝑃𝑅) =
𝑇𝑃 𝑇𝑃+𝐹𝑁
𝐹𝑎𝑙𝑠𝑒 𝑃𝑜𝑠𝑖𝑡𝑖𝑣𝑒 𝑅𝑎𝑡𝑒(𝐹𝑃𝑅) =
𝐹𝑃 𝐹𝑃+𝑇𝑁
𝑇𝑟𝑢𝑒 𝑁𝑒𝑔𝑎𝑡𝑖𝑣𝑒 𝑅𝑎𝑡𝑒(𝑇𝑁𝑅) =
𝐹𝑎𝑙𝑠𝑒 𝑁𝑒𝑔𝑎𝑡𝑖𝑣𝑒 𝑅𝑎𝑡𝑒(𝐹𝑁𝑅) =
#𝐶𝑜𝑟𝑟𝑒𝑐𝑡 𝐼𝑛𝑡𝑟𝑢𝑠𝑖𝑜𝑛𝑠
=
#𝐼𝑛𝑡𝑟𝑢𝑠𝑖𝑜𝑛𝑠
=
𝑇𝑁 𝑇𝑁+𝐹𝑃
#𝑁𝑜𝑟𝑚𝑎𝑙 𝑎𝑠 𝐼𝑛𝑡𝑟𝑢𝑠𝑖𝑜𝑛𝑠 #𝑁𝑜𝑟𝑚𝑎𝑙
=
𝐹𝑁 𝐹𝑁+𝑇𝑃
#𝐶𝑜𝑟𝑟𝑒𝑐𝑡 𝑁𝑜𝑟𝑚𝑎𝑙 #𝑁𝑜𝑟𝑚𝑎𝑙
=
#𝐼𝑛𝑡𝑟𝑢𝑠𝑖𝑜𝑛 𝑎𝑠 𝑁𝑜𝑟𝑚𝑎𝑙 #𝐼𝑛𝑡𝑟𝑢𝑠𝑖𝑜𝑛𝑠
Eq.2.1
Eq.2.2
Eq.2.3
Eq.2.4
True Positive Rate is also referred to as Sensitivity or Recall, and precision is also referred to as Positive Predictive Value (PPV). True Negative Rate is also called Specificity.
Commonly additional performance metrics are used referred to as accuracy, Error rate, precision and F-measure:
𝐴𝑐𝑐𝑢𝑟𝑎𝑐𝑦 =
𝑇𝑃+𝑇𝑁 𝑇𝑃+𝑇𝑁+𝐹𝑃+𝐹𝑁
=
#𝐶𝑜𝑟𝑟𝑒𝑐𝑡 𝐶𝑙𝑎𝑠𝑠𝑖𝑓𝑖𝑐𝑎𝑡𝑖𝑜𝑛 #𝐴𝑙𝑙 𝐼𝑛𝑠𝑡𝑎𝑛𝑐𝑒𝑠
𝐸𝑟𝑟𝑜𝑟 𝑟𝑎𝑡𝑒 = 1 − 𝐴𝑐𝑐𝑢𝑟𝑎𝑐𝑦 𝑃𝑟𝑒𝑐𝑖𝑠𝑖𝑜𝑛 =
𝑇𝑃 𝑇𝑃+𝐹𝑃
𝐹 − 𝑚𝑒𝑎𝑠𝑢𝑟𝑒 = 2 ∗
=
Eq.2.5
Eq.2.6
#𝐶𝑜𝑟𝑟𝑒𝑐𝑡 𝐼𝑛𝑡𝑟𝑢𝑠𝑖𝑜𝑛𝑠 #𝐼𝑛𝑠𝑡𝑎𝑛𝑐𝑒𝑠 𝐶𝑙𝑎𝑠𝑠𝑖𝑓𝑖𝑒𝑑 𝑎𝑠 𝐼𝑛𝑡𝑟𝑢𝑠𝑖𝑜𝑛
𝑃𝑟𝑒𝑐𝑖𝑠𝑖𝑜𝑛∗𝑅𝑒𝑐𝑎𝑙𝑙
Eq.2.7
Eq.2.8
𝑃𝑟𝑒𝑐𝑖𝑠𝑖𝑜𝑛+𝑅𝑒𝑐𝑎𝑙𝑙
Accuracy is the most basic measure of the performance of a learning method. This measure determines the percentage of correctly classified instances and the overall classification rate, while F-measure is a measure of a test's accuracy. It considers both the precision and the recall of the test. The F-measure can be
9
Chapter Two
Intrusion Detection and Data Mining
interpreted as a weighted average of the precision and recall, where F-measure reaches its best value at 1 and worst score at 0. These metrics are derived from a basic data structure known as the confusion matrix [22;23],
which contains information about actual and predicted
classifications done by a classification system. A sample confusion matrix for a two class case can be represented as shown in Table 2.1. Table 2.1: Confusion Matrix Predicted Class Activity Attack Normal Actual Class Attack Normal
TP
FN
FP
TN
Another evaluation method is to calculate the Mean Absolute Error (MAE) and Root Mean Squared Error (RMSE) values. Small values indicate classes of a higher quality. MAE is the average absolute difference between classifier predicted output and actual output, while RMSE is the square root of the Mean Square Error (MSE), which is the average of the sum of squared differences between classifier predicted output and actual output. 1
𝑀𝐴𝐸 = ∑𝑁 𝑖=1|𝐷𝑒𝑠𝑖𝑟𝑒𝑑𝑖 − 𝐴𝑐𝑡𝑢𝑎𝑙𝑖 | 𝑁
1
2 𝑀𝑆𝐸 = ∑𝑁 1 (𝐷𝑒𝑠𝑖𝑟𝑒𝑑𝑖 − 𝐴𝑐𝑡𝑢𝑎𝑙𝑖 ) 𝑁
1
2 𝑅𝑀𝑆𝐸 = √ ∑𝑁 1 (𝐷𝑒𝑠𝑖𝑟𝑒𝑑𝑖 − 𝐴𝑐𝑡𝑢𝑎𝑙𝑖 ) 𝑁
10
Eq.2.9 Eq.2.10
Eq.2.11
Chapter Two
Intrusion Detection and Data Mining
2.3 Intrusion Detection System (IDS) An intrusion can be defined as: any set of actions that attempt to compromise the integrity, confidentiality, or availability of resources. Intrusion detection is therefore required as an additional wall for protecting systems. [24]. Intrusion detection system (IDS) is a security layer that is used to discover ongoing intrusive attacks and anomaly activities in information systems and it is usually working in a dynamically changing environment. There are two types of intrusion detection systems, one of them is host based and the other is network based and usually they differ in the detection techniques they use. It ranges from misuse detection, anomaly detection to supervised and unsupervised based learning [24,25]. IDS’s perform the following operation in order to identify an intrusion [26]: Manual log examination. Automated log examination. Host-based intrusion detection software. Network-based intrusion detection software. Audit of system structure and fault. Audit tracing management of operating system and recognition of user’s behavior against security policy of an organization. Statistics analysis of abnormal activities. Monitoring and analyzing user and system activities. Recognition activity model for identification of known attacks and generating the alarm as an indication of attack. Measuring the confidentiality and integrity of the system and data files. Manual log examination can be effective but it can also be time-consuming and prone to error. Human beings are just not good at manually reviewing computer logs. A better form of log examination would be to create programs or scripts that
11
Chapter Two
Intrusion Detection and Data Mining
can search through computer logs looking for potential anomalies. Intrusion detection systems were once touted as the solution to the entire security problem. No longer would we need to protect our files and systems, we could just identify when someone was doing something wrong and stop them [26]. In fact, some of the intrusion detection systems were marketed with the ability to stop attacks before they were successful. Strictly speaking IDS does not prevent the intrusion from occurring but it detects the intrusion and reports it to the system operator. No intrusion detection system is foolproof and thus they cannot replace a good security program or a good security practice. They will also not detect legitimate users who may have incorrect access to information. The implementation of intrusion detection mechanisms should not be considered until the majority of high-risk areas are addressed, because they are broadly considered to be a classification problem [26]. The main issue in standard classification problem lies in minimizing the probability of error while making the classification decision; hence the key point is how to choose an effective classification method to construct accurate intrusion detection system with high detection rate and keeping low false alarm rate [27,28].
2.4 Types of Intrusion Detection Systems There are several types of intrusion detection systems and the choice of which one to use depends on the overall risks to the organization and the resources available [22]. One of the classifications of IDSs is established by the resource they monitor. According to this classification, IDSs are divided into two categories or two primary types of IDS according to their location: Host-based (HIDS) and Network-based (NIDS). As the name suggests, HIDS is located on the host computer. HIDSs analyzes audit trail data such as user logs, system calls (which are calls to functions provided by the operating system kernel) on the host where it is installed and looks for indications of attacks on that host [29].
12
Chapter Two
Intrusion Detection and Data Mining
NIDS on the other hand, resides on a separate system that watches network traffic, looking for indications of attacks that traverse that portion of the network and intercept packets passing through the network in order to analyze them and detect possible intrusion attempts. The current trend in intrusion detection is to combine both host based and network based information to develop hybrid systems [26,30].
2.4.1 Host-Based IDS A host-based IDS operates on data collected from a single computer system (host). These data can be from the innermost part of the host's operating system (audit data) or system log data. Host-based IDS uses these data to detect traces of an attack. They are usually deployed in the host system and usually they use the host's computational infrastructure that will lead to performance degradation. It is also deployed on individual hosts that make the configuration difficult as different hosts may have different behaviors and usage [31]. HIDS have access to detailed information on system events that may get disabled or made useless by an attacker who successfully gains administrative privileges on the protected machine. An intrusion that installs root kits (a piece of software that installs itself as part of the operating system kernel) is able to hide traces of anomalous in system activities [32]. Once the root kit is installed, it enables the attacker to cover the traces of malicious activities by cleaning system logs and hiding information about malicious processes at the kernel level.
2.4.2 Network-Based IDS A network-based IDS acquires and examines network traffic packets for signs of intrusion. A network-based IDS comprises a set of dedicated sensors or hosts which scan network traffic data to detect attacks or intrusive behaviors and protects the hosts connected to the network [31].
13
Chapter Two
Intrusion Detection and Data Mining
The major advantages of network-based IDS include its ability to scan large networks in a transparent way without affecting the normal operation of the network. Also, it has the ability to scan the traffic passively without being visible, and this makes it invisible to attackers and makes the network more secure [34]. NIDS analyzes packets crossing an entire network segment. NIDS has the advantage of being able to protect a higher numbers of hosts at the same time. However, it can suffer from performance problems due to the large amount of traffic it needs to analyze in real-time. In addition it can receive some attacks that exploit ambiguities in network protocols and cause the exhaustion of the memory and computational resources of the IDS [33]. The major disadvantages of network-based IDS are inability to handle encrypted data, incapacity to report whether an attack was successful or not and incapability to handle fragmented packets (that makes the IDS unstable). Furthermore, it can report only the initiation of an attack [34]. Furthermore, Network-Based IDS cannot easily monitor encrypted communications and is inherently unable to monitor intrusive activities that do not produce externally observable evidence.
2.5 Intrusion Detection System Components and Requirements IDS components can be fulfillment and summarized from two perspectives [35]: 1. From an algorithmic perspective: Features - capture intrusion evidence from audit data. Models – to infer attack from evidence. 2. From a system architecture perspective: Audit data processor, knowledge base, decision engine, alarm generation and responses. While the requirements to develop an IDS can be listed at two levels of abstraction [36]:
14
Chapter Two
Intrusion Detection and Data Mining
1. High Level Requirements: Develop a capable application that can sniff the traffic to and from the host machine. Development of an application that is competent of analyzing the network traffic and detects numerous pre-defined intrusion attacks and mappings. Development of an application that warns the owner of the host machine about the likely occurrence of an intrusion attack. The application should block traffic to and from a machine identified to be potentially malicious and usually it is defined by the owner of the host machine.
2. Low Level Requirements: Develop an application capable enough of displaying the incoming and outgoing traffic from the host machine in the form of packets to the owner of the host. An application that detects occurrence of Denial of Service (DoS) attacks such as Smurf and Syn-Flood is required. Development of an application that detects attempts to map the network of the host, using techniques such as Efficient Mapping and Cerebral Mapping. An application is required that detects actions attempting to gain unauthorized access to the services provided by the host machine using techniques such as Port Scanning. An application that maintains a "Log Record" of identified intrusion attacks done on the host in the present session and also displays it upon request. Activation or de-activation of each of the Attack Detection methods should be possible.
15
Chapter Two
Intrusion Detection and Data Mining
Provide a selection procedure for the user of the host for framing rules which explicitly specifies the set of IP addresses to be blocked or allowed. These Rules shall determine the flow of traffic at the host.
2.6 Intrusion Detection Techniques The techniques for the intrusion detection can be divided into two categories: Anomaly Intrusion Detection Misuse Intrusion Detection These techniques are categorized based upon different approaches like Statistics, Data mining, and Neural Network. Table 2.2 shows a comparison between different intrusion detection techniques [26].
Table 2.2: Comparison of Intrusion Detection Techniques Detection of Detection of No. Detection Technique
Approach
Known
Unknown
Attack
Attack
1
Misuse
Genetic Algorithm
Yes
No
2
Based
Expert system
Yes
No
3
Detection
State Transition
Yes
No
Data Mining
Yes
Yes
Rule Based
Yes
Yes
Decision Tree
Yes
Yes
Statistical
Yes
Yes
8
Signature
Yes
Yes
9
Neural network
Yes
Yes
4 5 6 7
Anomaly Based Detection
16
Chapter Two
Intrusion Detection and Data Mining
Intrusion detection methods may also include the detection using supervised and unsupervised learning. Supervised learning methods for intrusion detection can only detect known intrusions, while unsupervised learning methods can detect intrusions that have not been learned previously. Examples of unsupervised learning for intrusion detection include K-means-based approaches and self-organizing feature maps.
2.6.1 Anomaly Intrusion Detection This method works by using the definition "anomalies are not normal" [37,38]. Anomaly detection tries to determine whether deviation from the established normal usage patterns can be flagged as an intrusion. Anomaly detection technique assumes that all the intrusive activities are anomalous. There are many anomaly detection techniques that work on the principle of detecting deviations from normal behavior. This means that a normal activity profile for a system could be established and it could be stated that all system states that are varying from the established profile could be classified as an intrusion [38]. Anomaly Detection techniques includes Statistical, Neural Network, Immune System, File Checking and Data Mining [26]. Below is a brief description of each: Statistical based methods: Statistical methods monitor the user/network behavior by measuring certain variable statistics over time. Distance based methods: These methods try to overcome limitations of the statistical approach when the data are difficult to estimate in the multidimensional distributions. Rule based: Rule based system uses a set of "if-then" implication rules to characterize computer attacks. State transition is used to identify an intrusion by using a finite state machine that is deduced from the network. IDS states correspond to different states of the network, and an event makes a transition in
17
Chapter Two
Intrusion Detection and Data Mining
this finite state machine. An activity identifies intrusion if state transitions in the finite state machine of the network reach a sequel state. Profile based methods: This method is similar to rule based method. Here normal behavior’s profiles are built for different types of network traffics, users, and devices. Deviations from these profiles mean intrusion. Model based methods: This approach is based on the differences between a normal and abnormal behavior by modeling them but without creating several profiles of them. In model based methods, researchers attempt to model the normal or abnormal behaviors and deviation from this model means intrusion. Signature based: Matching available signatures in a database with collected data from activities for identifying intrusions. Neural Network Based: Neural Network model can distinguish between normal and attack patterns by training them and it can also identify the type of the attack.
2.6.2 Misuse Intrusion Detection Misuse detection is the most common approach used in the commercial IDS. Misuse Intrusion Detection uses the pattern of known attacks or weak spots of the system to match and identify attacks [26]. So there are some ways to represent attacks in forms of patterns or attacks signatures and even variations of the same attack can be detected. The main object of misuse detection focuses on the use of an expert system to identify intrusions based on an available knowledge base. This approach detects all the known attacks and tries to recognize known bad behavior [38]. Misuse attack detection techniques include genetic algorithm, expert system, pattern matching, state transition analysis and keystroke monitoring [26]. Below is a brief description of each: Genetic Algorithm based Detection (GAD): There are many researchers who used GAD in IDS to detect malicious intrusion. The Genetic Algorithm provides
18
Chapter Two
Intrusion Detection and Data Mining
the necessary population breeding, randomizing, and statistics gathering functions. Expert System based Detection: Expert System is software or a combined software and hardware capable of competently executing a specific task usually performed by a human expert. Expert systems are highly specialized computer systems capable of simulating human specialist knowledge and reasoning by using a knowledge-base. It is characterized by a set of facts and heuristic rules. Heuristic rules are rules of thumb accumulated by a human expert through intensive problem solving in the domain of a particular task. State Transition based Detection: In this approach the IDS identify an intrusion by using a finite state machine that is deduced from the network. IDS states correspond to different states of the network and an event generates a transition in this finite state machine. An activity is identified as an intrusion if the state transition in the finite state machine reaches an abnormal state. The main problem in this technique is to find out known signatures that include all the possible variations of pertinent attack, and which do not match the non-intrusive activity. 2.7 Learning Procedures Machine learning algorithms can be organized into a taxonomy based on the desired outcome of the algorithm or the type of input available during training the machine to [39,40]:
Supervised learning algorithms are trained on labeled examples. The supervised learning algorithm attempts to generalize a function or mapping from inputs to outputs which can then be used to speculatively generate an output for previously unseen inputs.
19
Chapter Two
Intrusion Detection and Data Mining
Unsupervised learning algorithms operate on unlabeled examples. Here the objective is to discover structure in the data (e.g. through a cluster analysis) for inputs where the desired output is unknown.
Semi-supervised learning combines both labeled and unlabeled examples to generate an appropriate function or classifier.
Reinforcement learning is concerned with how intelligent agents ought to act in an environment to maximize some notion of reward. The agent executes actions which cause the observable state of the environment to change. Through a sequence of actions, the agent attempts to gather knowledge about how the environment responds to its actions, and attempts to synthesize a sequence of actions that maximize a cumulative reward.
Learning procedure of this thesis fall in the Semi-supervised learning category.
2.8 Common Attacks and Vulnerabilities in NIDS Current NIDSs requires substantial amount of human interference and administrators for an effective operation. Therefore, it becomes important for the network administrators to understand the architecture of NIDS, the well-known attacks and the mechanisms used to detect them to contain the damages. In this section, some well-known attack types, exploits, vulnerabilities (in the end host operating systems) will be discussed, attack categories are [41]: 1. Confidentiality: In such kinds of attacks, the attacker gains access to confidential and otherwise inaccessible data. 2. Integrity: In such kinds of attacks, the attacker can modify the system state and alter the data without proper authorization from the owner.
20
Chapter Two
Intrusion Detection and Data Mining
3. Availability: In such kinds of attacks, the system is either shut down by the attacker or made unavailable to general users. Denial of Service attacks fall into this category. 4. Control: In such attacks the attacker gains full control of the system and can alter the access privileges of the system thereby potentially triggering all of the above three attacks.
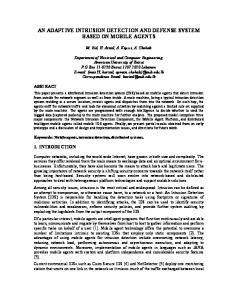
2.9 Technical Discussion To completely understand how these attacks take place, one must examine the structure of the TCP/IP protocol suite of the OSI model Figure 2.1. A basic understanding of these headers and network exchanges is crucial to the process.
OSI Model Data unit
Layer 7. Application
Function Network process to application Data
Host
Data
representation,
encryption
6. Presentation decryption, convert machine dependent data to machine independent data
layers 5. Session
Inter host communication, managing sessions between applications End-to-end connections, reliability and flow
Segments
4. Transport
Packet/Datagram
3. Network
Path determination and logical addressing
Frame
2. Data link
Physical addressing
Bit
1. Physical
Media, signal and binary transmission
control
Media layers
and
Figure 2.1: OSI Model
21
Chapter Two
Intrusion Detection and Data Mining
2.9.1 Internet Protocol – IP Internet Protocol (IP) is a network protocol operating at layer 3 (network) of the OSI model. It is a connectionless model, meaning there is no information regarding transaction state, which is used to route packets on a network [42]. Additionally, there is no method in place to ensure that a packet is properly delivered to the destination. Examining the IP header Figure 2.2, the first 12 bytes (or the top 3 rows of the header) contain various information about the packet. The next 8 bytes (the next 2 rows), however, contain the source and destination IP addresses. Using one of several tools like (HPing, NMap, PacketExcalibur, Scapy, etc.) [43], an attacker can easily modify these addresses specifically the "source address" field. It is important to note that each datagram is sent independent of all others due to the stateless nature of IP.
Figure 2.2: IP Packet Header 2.9.2 Transmission Control Protocol – TCP IP can be thought of as a routing wrapper for layer 4 (transport) of OSI model, which contains the Transmission Control Protocol (TCP). Unlike IP, TCP uses a connection-oriented design. This means that the participants in a TCP session must
22
Chapter Two
Intrusion Detection and Data Mining
first build a connection - via the 3-way handshake (SYN-SYN/ACK-ACK) then update one another on progress via sequences and acknowledgements [42]. This "conversation", ensures data reliability, since the sender receives an OK from the recipient after each packet exchange [44]. A TCP header is very different from an IP header Figure 2.3. The concerned will be with the first 12 bytes of the TCP packet, which contain port and sequencing information. Much like an IP datagram, TCP packets can be manipulated using software. The source and destination ports normally depend on the network application in use (for example, HTTP via port 80). What's important for understanding of spoofing are the sequence and acknowledgement numbers. The data contained in these fields ensures packet delivery by determining whether or not a packet needs to be resent [42].
Figure 2.3: TCP Packet Header The sequence number is the number of the first byte in the current packet which is relevant to the data stream. The acknowledgement number, in turn, contains the value of the next expected sequence number in the stream. This relationship confirms, on both ends, that the proper packets were received. It is quite different than IP since transaction state is closely monitored [42].
23
Chapter Two
Intrusion Detection and Data Mining
2.10 IP Spoofing The basic protocol for sending data over the Internet and many other computer networks is the Internet Protocol ("IP") [44]. The header of each IP packet contains, among other things, the numerical source and destination address of the packet. The source address is normally the address that the packet was sent from. By forging the header so it contains a different address, an attacker can make it appear that the packet was sent by a different machine. The machine that receives spoofed packets will send response back to the forged source address. This means that this technique is mainly used when the attacker does not care about response or the attacker has some way of guessing the response [45]. IP spoofing or Internet protocol address spoofing is the method of creating an Internet protocol packet or IP packet using a fake IP address that is impersonating a legal and legitimate IP address. IP spoofing is a method of attacking a network in order to gain unauthorized access [46]. The attack is based on the fact that Internet communication between distant computers is routinely handled by routers which find the best route by examining the destination address, but generally ignore the origination address. The origination address is only used by the destination machine when it responds back to the source [47]. In a spoofing attack, the intruder sends messages to a computer indicating that the message has come from a trusted system. To be successful, the intruder must first determine the IP address of a trusted system, and then modify the packet headers to a form that it appears that the packets are coming from the trusted system [47], these include obscuring the true source of the attack, implicating another site as the attack origin, pretending to be a trusted host, hijacking or intercepting network traffic, or causing replies to target another system.
24
Chapter Two
Intrusion Detection and Data Mining
IP spoofing is most frequently used in denial-of-service attacks which will be addressed in the next section of this chapter.
2.10.1 Denial of Service Attack IP spoofing is almost always used in what is currently one of the most difficult attacks to defend against – denial of service attacks, or DoS. Since crackers are concerned only with consuming bandwidth and resources, they need not to worry about properly completing handshakes and transactions. Rather, they wish to flood the victim with as many packets as possible in a short amount of time [48]. In order to prolong the effectiveness of the attack, they spoof source IP addresses to make tracing and stopping the DoS as difficult as possible. When multiple compromised hosts are participating in the attack, all sending spoofed traffic; it will be very challenging to quickly block traffic [49]. A denial-of-service attack (DoS attack) or distributed denial-of-service attack (DDoS attack) is an attempt to make a computer resource unavailable to its intended users. Although the means to carry out, motives for, and targets of a DoS attack may vary, it generally consists of the efforts of a person or persons to prevent an Internet site or service from functioning efficiently, temporarily or indefinitely [50]. Perpetrators of DoS attacks typically target sites or services hosted on highprofile web servers such as banks, credit card payment gateways, and even DNS root servers [51]. One common method of attack involves saturating the target (victim) machine with external communications requests, such that it cannot respond to legitimate traffic, or responds so slowly as to be rendered effectively unavailable. In general terms, DoS attacks are implemented by either forcing the targeted computer(s) to reset, or consume its resources so that it can no longer provide its intended service or obstructing the communication media between the intended users and the victim so
25
Chapter Two
Intrusion Detection and Data Mining
that they can no longer communicate adequately [52]. Main types of DoS attack are listed below: Smurf Attack: Smurf attack exploits the target by sending repeated ping request to broadcast address of the target network. The ping request packet often uses forged IP address (return address), which is the target site that is to receive the denial of service attack. The result will be lots of ping replies flooding back to the innocent, spoofed host. If number of hosts replying to the ping request is large enough, the network will no longer be able to receive real traffic [52,53].
SYN Floods (Neptune): When establishing a session between TCP client and server, a hand-shaking message exchange occurs between a server and client. A session setup packet contains a SYN field that identifies the sequence in the message exchange. An attacker may send a flood of connection request and do not respond to the replies. This leaves the request packets in the buffer so that legitimate connection request cannot be accommodated [44].
Ping of Death (PoD): Ping of Death is caused by an attacker overwhelming the victim network with Internet Control Message Protocol (ICMP) echo requests packets. This is a fairly easy attack to perform without extensive network knowledge as many ping utilities support this operation. A flood of ping traffic can consume significant bandwidth on low to mid speed networks bringing down a network to a crawl. A ping of death is also known as "long ICMP" [53].
26
Chapter Two
Intrusion Detection and Data Mining
Teardrop Attack: Teardrop attack exploits by sending IP fragment packets that are difficult to reassemble. A fragment packet identifies an offset that is used to assemble the entire packet to be reassembled by the receiving system. In the teardrop attack, the attacker's IP puts a confusing offset value in the subsequent fragments and if the receiving system does not know how to handle such situation, it may cause the system to crash [53]. Back: This type of DoS attack works against the Apache web server, an attacker submits requests with URL's containing many fronts’ lashes. As the server tries to process these requests it will slow down and becomes unable to process other requests [54].
This thesis focuses on detection of DoS attack class and its types, system training and testing done on normal packets and DoS packets, to construct a model for DoS detection. 2.11 Data Mining and Intrusion Detection System The term data mining is frequently used to designate the process of extracting useful information from large databases. The term knowledge discovery in databases (KDD) is used to denote the process of extracting useful knowledge from large datasets. Data mining, by contrast, refers to one particular step in this process, which ensures that the extracted patterns actually correspond to useful knowledge [55]. Data mining refers to a set of procedures that use the process of excavating previously unknown but potentially valuable data from large stores of past data. Data mining techniques basically correspond to pattern discovery algorithms, but
27
Chapter Two
Intrusion Detection and Data Mining
most of them are drawn from related fields like machine learning or pattern recognition [56]. In this thesis two machine learning techniques have been used: Unsupervised K-means algorithm and Supervised Decision Tree (C4.5).
2.12 Feature Selection (FS) Feature selection is an important topic in data mining, especially for high dimensional datasets [57]. Multiple dimensions are hard to think in, impossible to visualize, and due to the exponential growth of the number of possible values with each dimension, complete enumeration of all subspaces becomes intractable with increasing dimensionality, this problem is known as the curse of dimensionality [58]. Feature selection (also known as subset selection) is a process of selecting a group of useful features from the original feature space [59]. This process commonly used in machine learning, wherein subsets of the features available from the data are selected for application of a learning algorithm. The best subset contains the least number of dimensions that mostly contribute to accuracy, and the remaining unimportant dimensions will be discarded. Feature selection is an important stage of preprocessing and is one of the ways of avoiding the curse of dimensionality which refers to how certain learning algorithms may perform poorly in multi-dimensional data. Usually before collecting data, features are specified or chosen. Features can be discrete, continuous, or nominal. Generally, features are characterized as [60]: 1. Relevant: Features which have an influence on the output and their role cannot be assumed by the rest. 2. Irrelevant: Irrelevant features are defined as those features that do not have any influence on the output, and whose values are generated at random.
28
Chapter Two
Intrusion Detection and Data Mining
3. Redundant: A redundancy exists whenever a feature can take the role of another (the simplest way to model redundancy). Feature Selection is an essential data processing step prior to applying a learning algorithm [61]. Features are not all useful in constructing the system model, some features may be redundant or irrelevant; thus, not contributing to the learning process. The main aim of the feature selection process is to determine a minimal feature subset from the problem domain while retaining a suitably high accuracy in representing the original features. There are two approaches in feature selection (FS) known as Forward Selection and Backward Selection. Forward Selection start with no variables and add them one by one, at each step adding the one that decreases the error the most, until any further addition does not significantly decrease the error, while Backward Selection start with all the variables and remove them one by one, at each step removing the one that decreases the error the most (or increases it only slightly), until any further removal increases the error significantly. To reduce over fitting, the error referred to in above is the error of a validation set that is distinct from the error of a training set [60]. The main idea of the FS process is to choose a subset of input variables by eliminating features that are with little or no predictive information. Advantages of FS can be listed as: It reduces the dimensionality of the feature space, to limit storage requirements and increase algorithm speed. It removes the redundant, irrelevant or noisy data. The immediate effects for data analysis tasks are speeding up the running time of the learning algorithms. Improving the data quality. Increasing the accuracy of the resulting model.
29
Chapter Two
Intrusion Detection and Data Mining
Feature set reduction to save resources in the next round of data collection or during utilization. Performance improvement to gain in predictive accuracy. Data understanding to gain knowledge about the processes that generated the data or simply to visualize the data in a better way. Feature selection is also useful as part of the data analysis process, as it shows which features are important for prediction, and how these features are related. The removal of irrelevant and redundant information often improves the performance of the machine learning algorithm.
2.12.1 General Methods for Feature Selection The relationship between a feature selection algorithm (FSA) and the inciter chosen to evaluate the usefulness of the feature selection process can be classified into two types: Wrapper and Filter methods. The Wrapper approach uses the method of classification itself to measure the importance of the feature set, hence the feature selected depends on the classifier model used. Wrapper methods generally result in a better performance than the filter methods because the feature selection process is optimized for the classification algorithm to be used. However, wrapper methods are too expensive for large dimensional database in terms of computational complexity and time, since each feature set considered must be evaluated with the classifier algorithm used. The Filter approach actually precedes the actual classification process, independent of the learning algorithm, computationally simple, fast and scalable. Using the Filter method feature selection is done only once and then can be provided as an input to different classifiers. Various feature ranking and feature selection techniques have been proposed such as Correlation-based Feature Selection (CFS), Principal Component Analysis (PCA), Gain Ratio (GainR) attribute evaluation, Chi-square Feature Evaluation, Fast Correlation-based Feature
30
Chapter Two
Intrusion Detection and Data Mining
(FCBF), Information Gain (IG), Euclidean distance, I-test and Markov blanket filter. Some of these filter methods do not perform feature selections but only feature rankings, hence they are combined with a search method when one needs to find out the appropriate number of attributes. Such filters are often used with forward selection (which considers only additions to the feature subset), backward elimination, bi-directional search, best-first search, and genetic search.
2.12.2 Information Gain (IG) Feature Selection Information Gain (IG) is an entropy-based feature evaluation method, widely used in the field of machine learning. As Information Gain is used in feature selection, it is defined as the amount of information provided by the feature items for the IDS [62]. Information gain is calculated by how much of a term can be used for classification of information in order to measure the importance of lexical items for the classification. In Information Gain the features are filtered to create the most prominent feature subset before the start of the learning process. It takes number and size of branches into account when choosing an attribute as it corrects the information gain by taking the intrinsic information of a split into account [22]. The procedures of the information gain are shown below: Let S be a set of training set samples with their corresponding labels. Suppose there are m classes and the training set contains si samples of class i and S is the total number of samples in the training set. Expected information needed to classify a given sample is calculated as in Eq. 2.12: 𝑠
𝑠𝑖
𝑆
𝑆
𝑖 𝐼(𝑠1 , 𝑠2 , … , 𝑠𝑚 ) = − ∑𝑚 𝑖=1 log 2
Eq.2.12
A feature F with values {f1, f2, … , fv} can divide the training set into v subsets { S1, S2, …, Sv } where Sj is the subset which has the value fj for feature F.
31
Chapter Two
Intrusion Detection and Data Mining
Furthermore let Sj contain sij samples of class i. Entropy of the feature F is calculated as in Eq. 3.: 𝐸 (𝐹 ) = ∑𝑣𝑗=1
𝑠1𝑗 +⋯+𝑠𝑚𝑗 𝑆
∗ 𝐼(𝑠1 , 𝑠2 , … , 𝑠𝑚 )
Eq.2.13
Information gain for feature F can be calculated as in Eq.2.14: 𝐼𝐺 (𝐹 ) = 𝐼 (𝑠1 , 𝑠2 , … , 𝑠𝑚 ) − 𝐸(𝐹)
Eq.2.14
2.13 Clustering Algorithms Clustering, or cluster analysis groups the data objects based on the information found in the data, which describes the objects and their relationships. The goal is to make objects within a group similar (or related) to one another and different (or unrelated) to objects in other groups. The quality of clustering is determined by distinctiveness of these groups, as well as homogeneity within a single group [63]. Cluster analysis is the formal study of methods and algorithms for grouping, or clustering objects according to measured or perceived intrinsic characteristics or similarity [64]. Clustering is the classification of similar objects into different groups, or more precisely, the partitioning of data into subsets (clusters), so that the data in each subset (ideally) share some common trait of proximity according to some defined distance measure [65]. By clustering, one can spot dense and sparse regions and consequently, discover overall distribution samples and interesting relationships among the data attributes. Clustering algorithms are used extensively not only to organize and categorize data, but are also useful for data compression and model construction. By finding similarities in data, one can represent similar data within fewer symbols [66,67].
32
Chapter Two
Intrusion Detection and Data Mining
Also by finding groups of data, a model of the problem could be built based on those groupings. Another reason for clustering is its descriptive nature which can be used to discover relevant knowledge in huge dataset [67]. Clustering is a challenging field of research as it can be used as a separate tool to gain insight into the allocation of data, to observe the characteristic feature of each cluster and to spotlight on a particular set of clusters for more analysis. The advantage of applying Data Mining technology to Intrusion Detection Systems lies in its ability of mining the succinct and precise characters of intrusions in the system from large quantities of information automatically. It can solve the problem of difficulties in picking-up rules and in coding of the traditional Intrusion Detection System [56].
2.13.1 Classification of Clustering Algorithms There are essentially two types of clustering methods (Figure 2.4): hierarchical clustering and partitioning clustering. In hierarchical clustering once groups are found and objects are assigned to the groups, this assignment cannot be changed. In case of partitioning clustering, the assignment of objects into groups may change during the algorithm application. Further, the Partitioning clustering is categorized into hard clustering and soft clustering. Hard Clustering is based on mathematical set theory i.e. either a data point belong to a particular cluster or not. K-means clustering is a type of hard clustering. Soft Clustering is based on fuzzy set theory i.e. a data point may partially belong to a cluster [56]. Clustering algorithms can also be classified based on different parameters, based on whether the number of clusters to be formed are well known (priory) in advance or not known (a-priory). In priory since the number of clusters are well known in advance, priory algorithms try to partition the data into the given number of clusters. Since K-means and fuzzy c-means clustering algorithms need prior knowledge of the number of clusters, they belong to priory type. In the case of a-priory, since
33
Chapter Two
Intrusion Detection and Data Mining
number of clusters are not known in advance, the algorithm starts by finding the first large cluster, and then goes to find the second and so on, Mountain and Subtractive clustering algorithms are examples of this type [56].
Data Clustering
Hierarchal Clustering
Partitional Clustering
Hard Clustering (K-means)
Soft Clustering (Fuzzy C-means)
Figure 2.4: Types of Clustering Methods
K-means clustering algorithm has been used in this thesis. The K-means clustering algorithm clusters the combination of normal and Denial of Service (DoS) dataset into two clusters, normal and DoS attack clusters.
2.13.2 K-means Algorithm K-means is one of the simplest unsupervised clustering algorithms that solve the well-known problems in many fields. K-means is an iterative algorithm in which the number of clusters must be determined before the execution. The K-means algorithm partitions n data points into k clusters where the number of clusters K is pre-decided by users [68]. At the beginning K centroids are initialized according to some rule (usually at random from the data points) and they represent the centers of weight of corresponding clusters. For each data point in set the closest centroid is computed so that clusters of points are created. Assignment of the data points to clusters is depending upon the distance between cluster centroid and data point [69].
34
Chapter Two
Intrusion Detection and Data Mining
In the next step all data points assigned to a given cluster are used to recalculate the centroid. The procedure is repeated until certain termination condition is met. The general steps of K-means algorithm are as following: Place K points into the space represented by the objects that are being clustered. These points represent initial group centroids. Assign each object to the group that has the closest centroid. When all objects have been assigned, recalculate the positions of the K centroids. Repeat steps 2 and 3 until the centroids no longer move. This produces a separation of the objects into groups from which the metric to be minimized can be calculated.
2.14 Decision Tree A Decision Tree is defined as a predictive modeling technique from the fields of machine learning and statistics that builds a simple tree-like structure to model the underlying pattern of data [70]. Decision Trees are one example of a classification algorithm. Classification is a data mining technique that assigns objects to one of several predefined categories. Classification algorithms recognize distinctive patterns in a dataset and classifying activity based on this information [63]. A Decision Tree is a collection of if-then conditional rules for assignment of class labels to instances of a dataset. Decision Trees consist of nodes that specify a particular attribute of the data, branches that represent a test on each attribute value, and leaves that correspond to the terminal decision [71]. Decision Trees are well known machine learning technique and they are composed of three basic elements [72]:
35
Chapter Two
Intrusion Detection and Data Mining
A decision node specifying a test attributes. An edge or a branch corresponding to one of the possible attributes values. A leaf, usually named an answer node, which contains the class to which the object belongs. In Decision Trees, two major phases should be ensured: Building the tree: Based on a given training set. Classification: Order to classify a new instance. At start the root of the tree is determined, and then the node specified property is tested. The test results allow moving down the tree relative to a given instance of the attribute value. This process is repeated until it encounters a leaf. The instance is then classified in the same class based on leaves characteristics [73]. In summary, Decision Trees provide a simple set of rules that can categorize new data. Creating Decision Trees requires a pre-classified dataset in order for the algorithms to learn patterns in the data. The training dataset is made up of features which are quantifiable characteristics of the data. When the Decision Tree is built from these features, the rules of characterizing information can be used to identify and classify new data of interest by incorporating the logic into existing defenses, like IDSs, firewalls, custom-built detection scripts, or classification software [74].
2.14.1 C4.5 Decision Tree Algorithm C4.5 Decision Tree algorithm has been used in this thesis. The C4.5 is an algorithm used to generate a Decision Tree developed by Ross Quinlan [73]. C4.5 is an extension of Quinlan's earlier ID3 algorithm [75]. The Decision Trees generated by C4.5 can be used for classification and for this reason the C4.5 is often referred to as a statistical classifier [76].
36
Chapter Two
Intrusion Detection and Data Mining
The pseudo code for building C4.5 Decision Trees is written below [23]: 1. Check for a base case 2. For each attribute find the normalized information gain ratio. 3. Let a_best be the attribute with the highest normalized information gain 4. Create a decision node that splits on a_best 5. Recurse on the sublists obtained by splitting on a_best. Add the obtained nodes as children of the a_best node Decision Tree algorithms use the strategy of future generations, from root to leaves. To ensure this process, the attribute selection measure is used, taking into account the discriminative power of each attribute over the classes in order to choose the "best" one as the root of the (sub) Decision Tree [77]. In other words, best attribute should be used as a root node for splitting the tree. Objective criteria for judging the efficiency of the split is needed, and information gain measure is used to select the test attribute at each node in the tree [23]. The attribute with the highest information gain (or greatest entropy reduction) is chosen as the test attribute for the current node [78]. This attribute minimizes the information needed to classify samples in the resulting partitions. C4.5 uses an extension of information gain known as gain ratio for attributes ranking, which applies normalization to information gain [79]. Gain ratio (GainR) should be larger when data is evenly spread and small when all data belong to one branch attribute. GainR for set S to get split on feature F is: 𝐺𝑎𝑖𝑛𝑅 (𝑆, 𝐹 ) =
𝐼𝐺(𝑆,𝐹)
Eq.2.15
𝐸(𝐹)
Where the Information Gain IG(S,F) and Entropy E(F) is calculated by using Eqs. 2.13 and 2.15, respectively. From an intrusion detection perspective, classification algorithms can characterize network
data as normal or attack using information like
37
Chapter Two
Intrusion Detection and Data Mining
source/destination ports, IP addresses, and the number of bytes sent during a connection. Classification algorithms create a Decision Tree like the one presented in Figure 3.7, by identifying patterns in an existing dataset and using that information to create the tree. The algorithms take pre-classified data as input. They learn the patterns in the data and create simple rules to differentiate between the various types of data in the pre-classified dataset.
Figure 2.5: Example of Decision Tree for IDS Classification
2.15 Dataset Collection To verify the effectiveness and the feasibility of the proposed IDS`, KDD Cup 99 dataset has been used [80]. This dataset considered as a standard dataset and the most wildly used dataset for the evaluation of intrusion detection methods [22,29]. A connection is a sequence of TCP packets to and from some IP addresses, starting and ending at some well-defined times. This dataset contains seven weeks of network traffic; this was processed into about five million connection records and two weeks of test data that have around two million connection records. KDD Cup 99 training dataset consists approximately 4,900,000 single connection vectors, each of which is a vector of extracted feature values of that network connection which contains 41 features [Appendix A, Table A1].
38
Chapter Two
Intrusion Detection and Data Mining
2.15.1 Attacks in KDD Cup 99 Dataset The simulated attacks in the KDD Cup 99 dataset fall in one of the following four categories [81]: Denial of Service (DoS): Attacker tries to prevent legitimate users from using a service. Remote to Local (R2L): Attacker does not have an account on the victim machine, hence tries to gain access. User to Root (U2R): Attacker has local access to the victim machine and tries to gain super user privileges. Probe: Attacker tries to gain information about the target host.
2.15.2 Features of KDD Cup 99 Dataset In KDD Cup 99, the original TCP dump files were pre-processed for utilization in the Intrusion Detection System benchmark of the International Knowledge Discovery and Data Mining Tools Competition [81]. Packet information in the TCP dump file is summarized into connections. Specifically, a connection is a sequence of TCP packets starting and ending at some well-defined times, between which data flows from a source IP address to a target IP address under some well-defined protocol, with 41 features for each connection. The features are grouped into three categories:
Basic Features: Basic features can be derived from TCP/IP connection packet headers without inspecting the payload. Basic features are listed in Table 2.3.
Content Features: Domain knowledge is used to assess the payload of the original TCP packets. This includes features such as the number of failed login attempts as shown in Table 2.4.
39
Chapter Two
Intrusion Detection and Data Mining
Traffic Features: This category includes features that are computed with respect to a window interval and divided into two groups: -
"Same Host" Features: Examine only the connections in the past 2 seconds that have the same destination host as the current connection, and calculate statistics related to protocol behaviour, service, etc.
-
"Same Service" Features: Examine only the connections in the past 2 seconds that have the same service as the current connection.
The two aforementioned types of "Traffic" features are called time-based and are listed in Table 2.5. Table 2.3: Basic Features of TCP Connection No.
Feature
Description
1
Duration
2
Protocol_type
3
Service
4
Flag
5
Src_bytes
No. of Data Bytes sent from source to destination
6
Dst_bytes
No. of Data Bytes sent from destination to source
7
Land
8
Wrong_fragment
9
Urgent
Length of the connection (No. of Seconds) Type of connection Protocol (tcp, udp) Network Service on the destination (talnet, ftp) Status flag of the connection
1 if connection is from/to the same host/port; 0 otherwise No. of wrong fragments No. of urgent packets
The feature protocol type has 3 different values of icmp, tcp and udp. Likewise, the feature service has 70 different values and the flag feature has 11 different values. The description of different flag values are listed in [Appendix A, Table A2]. These 3 features and their different values acquire significant position to construct grammars of the proposed method.
40
Chapter Two
Intrusion Detection and Data Mining Table 2.4: Content Features of the TCP Connection
No.
Feature
Description
10
Hot
11
Num_failed_logins
12
Logged_in
13
Num_compromised
14
Root_shell
15
Su_attempted
16
Num_root
17
Num_file_creations
18
Num_shells
19
Num_access_files
20
Num_outbound_cmds
21
s_host_login
1 if the login belongs to the “hot” list; 0 otherwise
22
s_guest_login
1 if the login is a “guest” login; 0 otherwise
No. of “hot” indicators No. of failed logins 1 if successfully logged in; 0 otherwise No. of “compromised” conditions 1 if root shell is obtained; 0 otherwise 1 if “su root” command attempted; 0 otherwise No. of “root” accesses No. of file creation operations No. of shell prompts No. of operations on access control files No. of outbound commands in an ftp session
Table 2.5: Time Based Features TCP Connection No.
Feature
Description
23
Count
24
Srv_count
25
Serror_rate
% of connections that have “SYN” errors
26
Srv_serror_rate
% of connections that have “SYN” errors
27
Rerror_rate
% of connections that have “REJ” errors
28
Srv_rerror_rate
% of connections that have “REJ” errors
29
Same_srv_rate
% of connections to the same service
30
Diff_srv_rate
% of connections to different services
31
Srv_diff_host_rate
No. of connections to the same host as the current connection in the past two seconds No. of connections to the same service as the current connection in the past two seconds
% of connections to different hosts
41
Chapter Three Proposed System Methodology
42
Chapter Three Proposed System Methodology
3.1 Introduction This chapter describes the architecture and workflow process of the proposed IDS. It explains pre-processing of the dataset used for experiments including features transformation and normalization, optimal features selection using information gain. The proposed hybrid model will be described with its basic architecture in block diagram, and then gives details of each part.
3.2 Dataset Pre-Processing The first part of analysis engine component of the hybrid IDS model is the preprocessing dataset. The pre-processing of dataset is of great importance as it results in the increase the efficiency of intrusion detection mechanism in case of training, testing, and clustering of network activity into normal and abnormal. Pre-processing of original KDD Cup 99 dataset is necessary to make it suitable for IDS structure. Dataset pre-processing can be achieved by applying: Dataset transformation for nominal features Dataset normalization for numeric features
3.2.1 Dataset Transformation The training dataset of KDD Cup 99 consists of approximately 4,900,000 single connection instances. Each connection instance contains 42 features including target class attacks or normal. These labelled connection instances have to be transformed from nominal features to numeric values to be a suitable input for clustering by the
42
Chapter Three
Proposed System Methodology
K-means algorithm. For this transformation, Table 3.1 will be used. In this step, some useless data will be filtered and modified. For example, some text items need to be converted into numeric values. There are several nominal values like HTTP, TCP and SF. Hence it is necessary to transform these nominal values to numeric values in advance. For example, the service type of "tcp" is mapped to 1, "udp" is mapped to 2 and "icmp" is mapped to 3. Hence, keys in Table 3.1 will be followed to transform the nominal values of dataset features into the numeric values. Table 3.1: Transformation Table for Different Values of Protocols, Flag and Services TCP 1 Protocol Type UDP 2 ICMP 3 OTH 1 REJ 2 RSTO 3 RSTOS0 4 RSTR 5 Flag S0 6 S1 7 S2 8 S3 9 SF 10 SH 11 Service All services 1 to 70
An example of original KDD Cup 99 dataset record is shown in Figure 3.1. 0 tcp ftp_data SF 491 0 0 0 0 0 0 0 0 0 0 0 0 0 0 0 0 0 2 2 0 0 0 0 1 0 0 150 25 0.17 0.03 0.17 0 0 0 0.05 0 normal 0 udp other SF 146 0 0 0 0 0 0 0 0 0 0 0 0 0 0 0 0 0 13 1 0 0 0 0 0.08 0.15 0 255 1 0 0.6 0.88 0 0 0 0 0 normal
Figure 3.1: Records of the KDD Cup 99 Dataset
43
Chapter Three
Proposed System Methodology
After transformation, the original KDD Cup 99 dataset will become as shown in Figure 3.2. 0,1,30,10,491,0,0,0,0,0,0,0,0,0,0,0,0,0,0,0,0,0,2,2,0,0,0,0,1,0,0,150,25,0.17,0.03,0.17,0,0,0, 0.05,0,0 0,2,40,10,146,0,0,0,0,0,0,0,0,0,0,0,0,0,0,0,0,0,13,1,0,0,0,0,0.08,0.15,0,255,1,0,0.6,0.88,0,0, 0,0,0,0
Figure 3.2: Records of the KDD Cup 99 Dataset After Transformation
3.2.2 Dataset Normalization Dataset normalization is essential to enhance the performance of intrusion detection system when datasets are too large. The first step is to normalize continuous attributes, so that attribute values fall truly within a specified range of 0 to 1. Here, Min-Max method of normalization has been used, using the following equation [82]:
𝑥𝑖 =
𝑣𝑖 −min(𝑣𝑖 )
Eq.3.1
max(𝑣𝑖 )−min(𝑣𝑖 )
Where, xi is the normalized value, vi is the actual value of the attribute, and the maximum and minimum are taken over all values of the attribute. Normally xi is set to zero if the maximum is equal to the minimum.
3.3 Proposed Detection Model This thesis aims at building and simulating an intelligent IDS that can detect known and unknown network intrusions automatically. Under machine learning framework, the IDS is trained with unsupervised learning algorithm, namely the Kmeans algorithm.
44
Chapter Three
Proposed System Methodology
With the K-means two clusters are obtained which are normal and DoS attacks. With the normal one there is no action. For DoS attacks, the cluster acquired by Manhattan distance will be passed to the second layer classifier to feed classifier which is the C4.5 DT. At this stage the tree has already been constructed and learned and it can generate rules to classify types of DoS attacks to Smurf, Neptune, Pod, Back and Teardrop. Figure 3.3 shows the structure of the proposed system.
KDD Cup Dataset (Normal & DoS) records
Information Gain (IG) Feature Selection (Pre-Processing)
Testing Set (40%)
Training Set (60%)
K-means Clustering Algorithm with K=2 using Euclidean Distance metric
K-means Clustering Algorithm with K=2 using Manhattan Distance metric
Normal Cluster
DoS Cluster
Decision Tree (C4.5) Classification
Testing Set (40%)
Normal Cluster
Results comparison and evaluation
Results and performance evaluation
Figure 3.3: Proposed Detection Model Structure
45
DoS Cluster
Chapter Three
Proposed System Methodology
3.4 Information Gain Feature Selection The dataset which is used as an input for the proposed IDS consists of a huge amount of data with normal and DoS attacks records, and each record of data has numerous attributes associated with it, which means that it needs a lot of processing. A classification process that considers all these attributes needs a lot of processing time and it leads to an increase in the error rate, and a decrease in the efficiency of the classification process. The proposed system comes with a solution to overcome this problem by using Information Gain feature selection process. Information Gain (IG) algorithm can be described in algorithm 3.1 Algorithm 3.1: Information Gain Input: Number of samples in training set S. Number of class m. Output: a value represents Information gain for feature F. Step1: [Divide Training Set] Divide the training set into v subsets {S1, S2 …Sv} where Sj is the subset which has the value fj for feature F. Step2: [Compute Information Needed for Clustering S] 𝒎
𝑰(𝒔𝟏 , 𝒔𝟐 , … , 𝒔𝒎 ) = − ∑ 𝒊=𝟏
𝒔𝒊 𝒔𝒊 𝐥𝐨𝐠 𝟐 𝑺 𝑺
Step3: [Compute the Entropy of feature F] 𝒗
𝑬(𝑭) = ∑ 𝒋=𝟏
𝒔𝟏𝒋 + ⋯ + 𝒔𝒎𝒋 ∗ 𝑰(𝒔𝟏 , 𝒔𝟐 , … , 𝒔𝒎 ) 𝑺
Step4: [Compute Information Gain for Feature F] 𝑰𝑮(𝑭) = 𝑰(𝒔𝟏 , 𝒔𝟐 , … , 𝒔𝒎 ) − 𝑬(𝑭)
46
Chapter Three
Proposed System Methodology
3.5 K-means Clustering for the Proposed System The general structure of the first layer of the proposed IDS presented in Figure 3.4. Subset of KDD Cup 99 dataset
Transformation and Normalization
IG Feature Selection
Training Set (60%)
Testing Set (40%)
K-means Clustering Algorithm with K=2
Normal Cluster
DoS Cluster
Figure 3.4: First Layer of Proposed Detection Model K-means clustering includes procedures and steps to determine centroids of each cluster as shown in Figure 3.5. K-means training phase determines the centroid of both normal and attack cluster. The centroid is used in distance calculation for any coming packet to classify it to either normal or attack, based on the minimum distance to cluster centroid. Two distance metrics has been used, the Euclidean and the Manhattan, evaluate of the results and the performance of the K-means clustering with both metrics has been done. Manhattan distance metric did show much higher detection rates with
47
Chapter Three
Proposed System Methodology
reasonable true positive rates when compared to the Euclidean distance using the subset of the KDD Cup 99 dataset.
Start
Number of clusters K
Select randomly K points from the data as initial centroids
Calculate distance of objects to centroids
Group based on minimum distance
Calculate centroid
Is there objects movements between groups?
Yes
No Store the centroid
End
Figure 3.5: K-means Clustering Flowchart
48
Chapter Three
Proposed System Methodology
3.5.1 Distance Calculation Assignment of the data points to clusters depends upon the distance between cluster centroid and data point. A distance function is required to compute the distance between two objects. Distance functions also affect the size and members of a cluster as different distance functions use a different approach to find the distance between the data objects which is the most important step of the creation of clusters, so distance functions should be chosen wisely and according to the dataset. Generally K-means algorithm uses Euclidean distance, which is a distance function used to compute the distance between two objects. Two distance metrics used with K-means in this thesis: Euclidian Distance and Manhattan Distance. ● Euclidean Distance Metric: In mathematics, the Euclidean distance or Euclidean metric is the "ordinary" distance between two points that one would measure with a ruler, and is given by the Pythagorean formula [83]. By using this formula for distance, Euclidean space becomes a metric space as shown in Figure 3.6.
Y
X
Figure 3.6: Euclidean Distance between Two Points
The Euclidean distance between points x and y is the length of the line segment connecting them (𝑥𝑦 ̅̅̅). The formula for this distance between a point X (X1, X2, etc.) and a point Y (Y1, Y2, etc.) is:
49
Chapter Three
Proposed System Methodology
2 𝑑 (𝑥, 𝑦) = √∑𝑚 𝑖=1(𝑥𝑖 − 𝑦𝑖 )
Eq.3.2
Two input vectors with m quantitative features where x = (x1,….,xm) and y = (y1,….,ym). ● Taxicab Geometry (Manhattan): Manhattan is a form of geometry in which the usual distance function or metric of Euclidean geometry is replaced by a new metric in which the distance between two points is the sum of the absolute differences of their Cartesian coordinates. The taxicab metric is also known as rectilinear distance, L1 distance or l1 norm, Manhattan distance, or Manhattan length, with corresponding variations in the name of the geometry [84]. The Manhattan distance function computes the distance that would be traveled to get from one data point to the other, if a gridlike path is followed as shown in Figure 3.7. Y
X
Figure 3.7: Manhattan Distance Between Two Points The formula for this distance between a point X= (X1, X2, …. , Xn) and a point Y= (Y1, Y2, …. , Yn) is: 𝑑(𝑥, 𝑦) = ∑𝑛𝑖=1|𝑥𝑖 − 𝑦𝑖 |
Eq.3.5
Where n is the number of variables, and Xi and Yi are the values of the ith variable, at points X and Y respectively.
50
Chapter Three
Proposed System Methodology
3.6 Decision Trees as a Model for Intrusion Detection Intrusion detection can be considered as classification problem where each connection or user is identified either as one of the attack types or normal based on some existing data. Decision Trees can solve this classification problem of intrusion detection as they learn the model from the dataset and can classify new data items into one of the classes specified in the dataset. Decision Trees can be used as misuse intrusion detection as they can learn a model based on the training data and can predict the future data as one of the attack types or normal based on the learned model. DT constructs easily interpretable models, which is useful for a security officer to inspect and edit. In this thesis different set of (if-then) rules based on the GianR attribute ranking has been used to construct DT, and the rule with highest detection rate for known and unknown attacks will be adopted as the second layer of the proposed IDS.
Rule 1: Root node = flag If flag = SF and protocol_type = tcp and dst_host_same_srv_rate < 0.94 Then Classification = unknown If flag = SF and protocol_type = tcp and dst_host_same_srv_rate >= 0.94 Then Classification = back If flag = SF and protocol_type = udp Then Classification = teardrop If flag = SF and protocol_type = icmp and src_bytes < 1256 Then
51
Chapter Three
Proposed System Methodology
Classification = smurf If flag = SF and protocol_type = icmp and src_bytes >= 1256 Then Classification = pod If flag = RSTO or SH or OTH or or RSTOS0 or S1 or S0 or REJ Then Classification = back
Rule 2: Root node = protocol_type If protocol_type = tcp and serror_rate