transmission system at its bottleneck under competitive environment in ... introduce Flexible AC Transmission System (FACTS) devices are redefined by many ...
IOSR Journal of Electrical and Electronics Engineering (IOSR-JEEE) e-ISSN: 2278-1676,p-ISSN: 2320-3331, Volume 11, Issue 4 Ver. I (Jul. – Aug. 2016), PP 90-97 www.iosrjournals.org
A Multi-Objective Hybrid Heuristic Approach for Optimal Setting of FACTS Devices in Deregulated Power System Sai Ram Inkollu1 and Venkata Reddy Kota2 1
Dept. of Electrical and Electronics Engineering, Dhanekula Institute of Engineering & Technology, Vijayawada – 521 139, Andhra Pradesh, India 2 Dept. of Electrical and Electronics Engineering, Jawaharlal Nehru Technological University, Kakinada – 533 003, Andhra Pradesh, India
Abstract: Improvement of power system performance in terms of increased voltage profile and decreased transmission loss is becoming one of the challenging tasks to the system operators under open access environment. Apart from traditional power flow controlling devices, use of Flexible AC Transmission System (FACTS) devices can give an attractive solution for the operation and control of deregulated power system. The type, size, location and number of FACTS devices are to be optimized appropriately in order to get the targeted benefits. In this paper, two FACTS devices, TCPST and IPFC are selected to obtain the required performance. To search the optimal location and optimal rating of the selected FACTS devices, a hybrid algorithm which formulated with PSO and GSA is proposed. At the first step, the optimization problem is solved for finding the optimal location of FACTS devices using PSO with an objective of voltage profile maximization and later GSA is implemented to optimize their parameters with an objective of transmission loss minimization. The proposed method is implemented on IEEE 30-bus test system and from the simulation results it can be proved that this technique is well suited for real-time application. Keywords: Deregulated power system, open access, TCPST, IPFC, PSO-GSA
I. Introduction The practical limitations to expansion and ever increasing electricity demand are causing to operate transmission system at its bottleneck under competitive environment in deregulated power system. In addition, the randomness in power injection and withdrawals with the strategic behavior of market participants are further causing to decrease the security margin of transmission system. Under this scenario, the primary objectives to introduce Flexible AC Transmission System (FACTS) devices are redefined by many researchers during last decade. Some of the major areas focused with FACTS devices are like security margin enhancement [1-3], stability enhancement [4-10], reliability management [11], system performance improvement [12-19], congestion management [20-24] and electricity market economic efficiency maximization [25-30] etc. As per the controlling attribute in power system, the type, size, location, number etc. are required to optimize very precisely. Many researchers have attempted to solve this problem by heuristic algorithms due to their adoptability for multi-objective complex problems. Using Genetic Algorithm (GA), the optimal location and number of thyristor-controlled phase shifters are optimized in [31, 32]. In [33], hybrid TS/SA approach has been proposed to solve OPF problem incorporating FACTS devices. An evolutionary algorithm based evolution strategies (ES) technique is proposed to maximize system loadability via optimizing type of FACTS device, their location and settings [34]. Similarly, the ABC algorithm and PSO algorithm application for optimizing IPFC location can be found [35, 36]. On other side, the conventional approach like mixed-integer nonlinear programming (MINLP) is adopted to find the optimal setting of FACTS devices used in the optimal power-flow problem. [37].It is worthwhile to notify the role of heuristic algorithms used to solve in all these complex problems. The objective of this paper is not only to resolve multi-objective optimization problem but also to investigate the effectiveness with the use of FACTS devices for the improvement of the performance of transmission system. This is an extension of our existing works [38] under open access environment. Under open access, the bilateral or multilateral transactions are executed with an assumption of unconstrained transmission system. With this new generation and loading levels, the ability of various FACTS devices for the improvement of the transmission system performance is analyzed. Two FACTS devices, TCPST and IPFC devices are used in this work. To identify the most suitable locations, the Particle Swarm Optimization (PSO) is applied first. Later, the Gravitational Search Algorithm (GSA) is implemented to find the optimal parameters of the FACTS devices. The overall voltage deviation index (VDI) is considered while optimizing the location and the transmission loss is considered while optimizing the parameters of FACTS devices. This paper is arranged as follows: section 1 gives introduction, section 2 shows the power injection modeling of various FACTS devices. Section 3 explains the objective function in the necessary mathematical DOI: 10.9790/1676-1104019097
www.iosrjournals.org
90 | Page
A Multi-Objective Hybrid Heuristic Approach for Optimal Setting of FACTS Devices in Deregulated.. equations. In section 4, the proposed hybrid algorithm is explained briefly. Section 5 deals with various case studies on standard IEEE test systems and section 6 concludes the paper.
II. Modeling of FACTS Devices 2.1. Thyristor Controller Phase Shift Transformer As far as the static modeling is concerned, the power injection equations are as follows:
Pinj ,i r Qinj ,i r 2
1 VV i j sin i j tcpst X se
1 2 1 Vi r VV i j cos i j tcpst X se X se Pinj , j Pinj ,i
Qinj , j r
1 VV i j cos i j tcpst X se
where, tan tcpst is the phase angle adjustment by TCPST between , , r is the ratio between the 2 2
magnitude of the induced series voltage and magnitude of the ith bus voltage. It is variable in the range 0, rmax ,
i
and j are the load angles of buses
i, j
2 respectively. In addition, X se xse n xsh , where
xse and xsh are the
series and shunt reactances of transmission line/transformer and n is the variable of the phase shift angle. The detailed information can be found in [39]. 2.2. Interline Power Flow Controller By assuming IPFC location between buses i, j and k, the power injections are as follows [15, 16].
Pinj ,i
VV
n j, k
i
b sin i sein
sein in
Qinj ,i Vi Vsein bin cos i sein n j, k
Pinj ,n V j Vsein bin sin j sein
Qinj ,n V j Vsein bin cos j sein Here
n j, k
n j, k
Vsein and sein are the magnitude and angle of series injected voltage source. III. Problem Formulation
The transmission system performance can be mathematically formulated in terms of two terms: voltage deviation of the system, f1 x, u , and transmission losses, f 2 x, u . Therefore the major objective function can be defined as: F x, u f1 x, u , f 2 x, u The first objective is to optimize the overall system voltage profile i.e., minimize the voltage deviation at load buses, which can be defined as NLB
f1 x, u VDI x, u Vi Vi ref
2
i 1
where NBL is the number of load buses, Vi ref is the pre-specified reference magnitude at ith load bus, which usually with magnitude of 1.0 p.u. The second objective is to minimize the total real power loss of the lines, which is written as: NL
f 2 x, u Ploss x, u Pi ,loss i 1
where Pi ,loss is the real power loss in transmission line i, and NL is the total number of transmission lines. In both the objective functions, x denotes the vector of dependent variables such as slack bus power PG1, generator reactive power outputs QG, load bus voltages VL and apparent power flows in transmission lines SL. Therefore x can be defined as: xT PG1 , QG1 ,...QNGB , VL1 ,...VNLB , S L1 ,...S NL
DOI: 10.9790/1676-1104019097
www.iosrjournals.org
91 | Page
A Multi-Objective Hybrid Heuristic Approach for Optimal Setting of FACTS Devices in Deregulated.. where NGB is the number of generator buses. Similarly, u denotes the vector of control variables such as generator bus voltages VG, location of FACTS devices L, and real and reactive power injections Pinj & Qinj at FACTS device incident buses i, j respectively. Therefore u can be expressed as: uT VG1 ,...VNGB , L1 ,...LNL , Pinj ,i , Qinj ,i , Pinj , j , Qinj , j As per the type of FACTS device, the power injections again controlled with their respective controlling parameters. a) Equality constraints The equality constraints which are the real and reactive power balance equations for all the buses except buses p and q with UPFC are shown in the following equations. Pi Pg ,i Pd ,i Vi Vk Yik cos ik i j NB
k 1
Qi Qg ,i Qd ,i Vi Vk Yik sin ik i j NB
i 1, 2,..., NB ; but i p, q
k 1
For buses p and q, the equality constraints can be written as Pp Pg , p Pd , p Vp Vk Ypk cos pk p j Pp ,inj NB
k 1
Qp Qg , p Qd , p V p Vk Ypk sin pk p j Qp ,inj NB
k 1
Pq Pg , q Pd , q Vq Vk Yqk cos qk q j Pq ,inj NB
k 1
Qq Qg , q Qd , q Vq Vk Yqk sin qk q j Qq ,inj NB
k 1
b) Inequality constraints Real power generation limits: The upper and lower limit of the real power generated by the generators can be shown as Pgmin Pg ,i Pgmax i 1, 2,..., NG , ,i ,i
Reactive power generation limits: The upper and lower limit of the reactive power can be shown as Qgmin Qg ,i Qgmax i 1, 2,..., NG , ,i ,i
Voltage limits: The upper and lower limit of the bus voltage magnitude can be shown as Vi min Vi Vi max , i 1, 2,..., NG
Phase angle limits: The upper and lower limits on the bus voltage phase angle can be shown as imin i imax , i 1, 2,..., NG
Tap-Changers limits: The upper and lower limits on the tap positions in tap-changing transformer lines can be shown as aimin ai aimax , i 1, 2,..., NTCL
MVAr injection limits: The upper and lower limits on the MVAr injections at voltage controlled buses can be shown as Qinjmin,i Qinj ,i Qinjmax,i , i 1, 2,..., NVCB
Line flow limits: The maximum MVA power flow in a transmission line can be shown as Sl Slmax , l 1, 2,..., NL
IV. Proposed Hybrid Approach The hybrid algorithm adopted here is similar to our previous works and the detailed algorithm can be found [38]. The pseudo code of the procedure involved in PSO-GSA is as follows: PSO for Optimal Location 1. For each particle i. Initialize particle, End Do DOI: 10.9790/1676-1104019097
GSA for Optimal Parameters 1. Search space identification, t=0; 2. Random initialization, Xi(t); For i=1, …, N www.iosrjournals.org
92 | Page
A Multi-Objective Hybrid Heuristic Approach for Optimal Setting of FACTS Devices in Deregulated.. ii.
i. ii.
2. For each particle Calculate fitness value If it is better than the best fitness value (pBest) in history iii. Set current value as the new pBest End 3. Choose the particle with the best fitness value of all the particles as the gBest 4. For each particle Calculate velocity Update position End - while maximum iterations or minimum error criteria is not attained.
3. Fitness evaluation of objects; 4. Update the parameters of G, best, worst and M; For i=1, …, N 5. Calculation of the force on each object; 6. Calculation of the acceleration and the velocity of each object; 7. Update the position of the agents by (4) to yield Xi(t+1); t=t+1; 8. Repeat steps 3 to 7 until the stop criteria is reached; 9. End
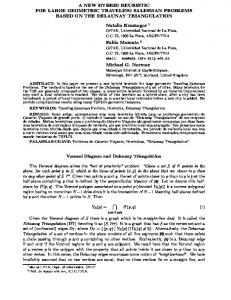
V. Case Studies The GSA-PSO algorithm is applied for optimal placement of each FACTS device on the IEEE 30-bus test system. The real load of the system is 283.4 MW. We have allocated 37.7615 MW for generator 2 and the rest of load is allocated to generator 1. Since the test system has consisting of 6 generator buses and 21 load buses. Hence each generator can treat as source bus and similarly each load bus can be like a sink bus in open access environment. Since the participants and their required MW quantities are unpredictable in real-time, we have determined by using random numbers theory. It means, the algorithm will decide the source bus and sink bus as well as their contracted power. For each simulation, we can have either bilateral or multilateral contracts and hence numerous case studies can generate. Here we have given some limited transactions. 5.1 With TCPST 5.1.1. Single Source – Single Sink Simulation Results with TCPST The base case transmission loss before transaction is 18.0524 MW. It has been increased during tractions and the TCPST controls in line 12–16 are minimized that increased loss at every transaction. Similarly, the voltage deviation index (VDI) is high without TCSC and it is also decreased with TCPST. Finally, the transmission losses as well as VDI are optimized at every bilateral transaction as given in Table 3. The performance characteristics of PSO-GSA for first transaction are illustrated for voltage profile as well as transmission loss in each transmission line are illustrated in Fig. 1 and Fig. 2 respectively. Table 3. TCPST impact on losses and VDI for single source – single sinks transactions Source
13 11 2 5 8
Sink
Contracted Power (MW)
16 16 8 20 2
Transmission losses (MW) Before After With transaction transaction TCPST 18.0524 19.9794 16.2055 18.0524 19.0341 16.8536 18.0524 19.0729 16.9496 18.0524 20.8488 16.9301 18.0524 17.8908 16.9269
1.114 4.458 1.62 4.956 1.802
VDI Without TCPST 0.012046 0.011178 0.0087398 0.012125 0.013845
With TCPST 0.0072891 0.0072886 0.0073145 0.0073282 0.0072623
Single Source – Multiple Sinks Simulation Results with TCPST In section 5.1, we have executed only with one source bus and one sink bus. In this section, one source bus and two sink buses are considered for each transaction. The combined increased load at two sink buses is supplied by one source bus. The multilateral contracts and system performance with TCPST are given in Table 4 and Table 5 respectively. For multiple sources – single sink transactions and corresponding TCPST impact on system performance are given in Table 6 and Table 7 respectively. Similarly, for multiple sources – multiple sinks and corresponding TCPST impact on system performance are given in Table 8 and Table 9 respectively. 5.1.2.
Table 4. Multilateral transactions for single source – multiple sinks simulations Source 13 2 1 1 5
Sinks 24 14 16 16 15
DOI: 10.9790/1676-1104019097
24 4 17 3 23
18 8 15 17 30
At sink 1 4.7680 1.1340 1.9770 2.5030 4.4460
Contracted Power (MW) At sink 2 At sink 3 1.4440 1.6540 2.1910 3.5030 2.2970 3.0380 4.5580 3.0480 3.5800 3.4770
www.iosrjournals.org
Total 7.8660 6.8280 7.3120 10.1090 11.5030
93 | Page
A Multi-Objective Hybrid Heuristic Approach for Optimal Setting of FACTS Devices in Deregulated.. Table 5. TCPST impact on losses and voltage VDI for single source – multiple sinks simulations Transmission losses (MW) Before After Transaction transaction 18.0524 18.9428 18.0524 21.6983 18.0524 19.0186 18.0524 18.7147 18.0524 20.7028
5.1.3.
VDI With TCPST 17.4178 16.9484 17.3977 16.5567 16.7609
Without TCPST 0.010698 0.013126 0.021109 0.029984 0.014798
With TCPST 0.0073391 0.0073258 0.0073208 0.0072327 0.0073658
Multiple Sources – Single Sink Simulation Results with TCPST Table 6. Multilateral transactions for multiple sources – single sink simulations Sources 8 11 2 8 1
Sink
11 11 5 13 5
2 1 11 1 8
At source 1 1.0630 2.9230 3.6840 4.8090 4.3800
24 16 12 8 26
Contracted Power (MW) At source 2 At source 3 3.7420 2.7540 2.0520 4.8940 4.7270 2.5100 1.9930 2.7300 1.4250 3.0130
Total 7.5590 9.8690 10.9210 9.5320 8.8180
Table 7. TCPST impact on losses and voltage VDI for multiple sources – single sink simulations Transmission losses (MW) Before After Transaction transaction 18.0524 17.5893 18.0524 18.8399 18.0524 19.9077 18.0524 18.2232 18.0524 18.6513
5.1.4.
VDI With TCPST 16.4034 17.144 17.5496 17.5021 16.8284
Without TCPST 0.012418 0.016708 0.018664 0.010239 0.014459
With TCPST 0.0073336 0.0073349 0.0073082 0.0073271 0.0072731
Multiple Sources – Multiple Sinks Simulation Results with TCPST Table 8. Multilateral transactions for multiple sources – multiple sinks simulations Sources 11 2 2 11 11
Sinks
2 5 8 11 13
16 10 2 19 21
12 16 3 23 17
At source 1 2.2000 3.6230 4.1970 3.6800 1.9810
Contracted Power (MW) At source 2 At sink 1 2.6650 2.2000 1.8660 3.6230 3.5490 4.1970 2.3560 3.6800 1.5550 1.9810
At sink 2 2.6650 1.8660 3.5490 2.3560 1.5550
Total 4.8650 5.4890 7.7460 6.0360 3.5360
Table 9. TCPST impact on losses and voltage VDI for multiple sources – multiple sink simulations Transmission losses (MW) Before After Transaction transaction 18.0524 20.4394 18.0524 18.3073 18.0524 19.9373 18.0524 20.7416 18.0524 21.4521
VDI With TCPST 17.3873 17.4353 17.6502 17.5492 17.5443
Without TCPST 0.022854 0.0079498 0.012314 0.020786 0.011449
With TCPST 0.0072904 0.0073024 0.0073631 0.007282 0.0072908
1.1 N-R Method Transaction GSA
1.08
Bus Voltage
1.06
1.04
1.02
1
0.98
0.96
0
5
10
15 Bus No
20
25
30
Fig. 1. Bus System voltage profile with TCPST DOI: 10.9790/1676-1104019097
www.iosrjournals.org
94 | Page
A Multi-Objective Hybrid Heuristic Approach for Optimal Setting of FACTS Devices in Deregulated.. 7 N-R Method Transaction Proposed method with TCPST
6
Power Loss in MW
5 4 3 2 1 0 -1
0
5
10
15
20 25 Transmission Line
30
35
40
45
Fig. 2. Loss in each transmission line with TCPST 5.2. With IPFC 5.2.1. Multiple Sources – Multiple Sinks Simulation Results with IPFC The base case transmission loss before transaction is 18.0524 MW. It has been increased during tractions and the IPFC controls in line 12–15-16 are minimized that increased loss at every transaction. Similarly, the voltage deviation index (VDI) is high without IPFC and it is also decreased with IPFC. Finally, the transmission losses as well as VDI are optimized at every multilateral transaction as given in Table 10 and Table 11 respectively. The voltage profile as well as transmission loss in each transmission line are illustrated in Fig. 3 and Fig. 4 respectively. performence of IPFC bus no vs bus voltage 1.1 N-R Method Transation GSA
1.08
BUS voltage
1.06
1.04
1.02
1
0.98
0.96
0
5
10
15 BUS NO
20
25
30
Fig. 4. Bus voltage profile with IPFC Table 10. IPFC impact on losses and VDI for single source – single sinks transactions Source
5 11 5 1 1
Sink
14 30 21 19 4
Contracted Power (MW) 4.917 3.316 1.745 4.059 4.717
DOI: 10.9790/1676-1104019097
Transmission losses (MW) Before After With transaction transaction IPFC 18.0524 19.2266 16.907 18.0524 18.8323 18.2391 18.0524 17.9059 16.8218 18.0524 18.679 16.8295 18.0524 20.5078 8.722
www.iosrjournals.org
Without IPFC 0.1161 0.14014 0.11413 0.10518 0.10895
VDI With IPFC 0.012462 0.02457 0.0080656 0.023328 0.028008
95 | Page
A Multi-Objective Hybrid Heuristic Approach for Optimal Setting of FACTS Devices in Deregulated.. 7 N-R Method Transation Proposed method with IPFC
6
Power Loss in MW
5 4 3 2 1 0 -1
0
5
10
15
20 25 Transmission Line
30
35
40
45
Fig. 5. Loss in each transmission line with IPFC
VI. Conclusion In open access transmission system, the transactions can take place at any time among various market participants. Some transactions can cause to decrease total transmission losses due to counter flows and some are cause to increase due to dominant flows. Irrespective of transactions and their volumes, the major responsibility of power system engineers is to decrease net transmission losses as well as to maintain good voltage profile for the better performance of system. In this paper, the impact of TCPST and IPFC on system performance is analyzed for both bilateral and multilateral transactions. It has been observed that the transmission losses are decreased and voltage profile is increased significantly with FACTS controllers in the network. The adopted hybrid algorithm GSA-PSO is proved its ability to solve complex optimization problem with multiple objectives.
References [1] [2] [3] [4] [5] [6] [7] [8] [9] [10] [11] [12] [13] [14] [15]
[16]
Gerbex, S., R. Cherkaoui, and A. J. Germond. "Optimal location of FACTS devices to enhance power system security." Power Tech Conference Proceedings, 2003 IEEE Bologna. Vol. 3. IEEE, 2003. Ongsakul, Weerakorn, and Peerapol Jirapong. "Optimal allocation of FACTS devices to enhance total transfer capability using evolutionary programming." Circuits and Systems, 2005. ISCAS 2005. IEEE International Symposium on. IEEE, 2005. Zhang, Jun, and Akihiko Yokoyama. "Application of interline power flow controller to ATC enhancement by optimal power flow control." Power Tech, 2007 IEEE Lausanne. IEEE, 2007. Hammad, A. E. "Analysis of power system stability enhancement by static VAR compensators." Power Systems, IEEE Transactions on 1.4 (1986): 222-227. Mohanty, Alok Kumar, and Amar Kumar Barik. "Power System Stability Improvement Using FACTS Devices." International Journal of Modern Engineering Research (IJMER) 1.2 (2011): 666-672. Kumkratug, Prechanon. "Application of interline power flow controller to increase transient stability of power system." Journal of Computer Science 6.12 (2010): 1490. Mohanty, Alok Kumar, and Amar Kumar Barik. "Power System Stability Improvement Using FACTS Devices." International Journal of Modern Engineering Research (IJMER) 1.2 (2011): 666-672. Zhang, Jun, and Akihiko Yokoyama. "Power System Transient Stability Improvement by the Interline Power Flow Controller (IPFC)." 電気学会論文誌 B (電力・エネルギー部門誌) 128.1 (2008): 208-215. Karami, A., M. Rashidinejad, and A. A. Gharaveisi. "Voltage Security Enhancement and Congestion Management via STATCOM & IPFC using Artificial Intelligence*." Iranian Journal of Science and Technology 31.B3 (2007): 289. Gupta, Sandeep, R. K. Tripathi, and Rishabh Dev Shukla. "Voltage stability improvement in power systems using facts controllers: State-of-the-art review." Power, Control and Embedded Systems (ICPCES), 2010 International Conference on. IEEE, 2010. Moghadasi, S-M., et al. "Composite system reliability assessment incorporating an interline power-flow controller." Power Delivery, IEEE Transactions on 23.2 (2008): 1191-1199. Bhaskar, M. Arun, et al. "Voltage profile improvement using FACTS devices: A comparison between SVC, TCSC and TCPST." Advances in Recent Technologies in Communication and Computing, 2009. ARTCom'09. International Conference on. IEEE, 2009. Sinagham, Rajshekar, and K. Vijay Kumar. "Role of Interline Power Flow Controller for Voltage Quality." International Journal of Advances in Electrical and Electronics Engineering,(IJAEEE), ISSN (2013): 2319-1112. Fardanesh, B. "Optimal utilization, sizing, and steady-state performance comparison of multiconverter VSC-based FACTS controllers." Power Delivery, IEEE Transactions on 19.3 (2004): 1321-1327. Babu, AV Naresh, et al. "Multi-Line Power Flow Control using Interline Power Flow Controller (IPFC) in Power Transmission Systems." World Academy of Science, Engineering and Technology, International Journal of Electrical, Computer, Energetic, Electronic and Communication Engineering 4.3 (2010): 577-581. Babu, AV Naresh, and S. Sivanagaraju. "Mathematical modelling, analysis and effects of interline power flow controller (IPFC) parameters in power flow studies." Power Electronics (IICPE), 2010 India International Conference on. IEEE, 2011.
DOI: 10.9790/1676-1104019097
www.iosrjournals.org
96 | Page
A Multi-Objective Hybrid Heuristic Approach for Optimal Setting of FACTS Devices in Deregulated.. [17] [18] [19] [20] [21] [22] [23] [24]
[25] [26] [27] [28] [29] [30] [31] [32] [33] [34] [35] [36] [37] [38] [39]
Kahyaei, Amir. "Analysis of interline power flow controller (IPFC) location in power transmission systems." Research Journal of Applied Sciences, Engineering and Technology 3.7 (2011): 633-639. Kargarian, Amin, et al. "Multiobjective optimal power flow algorithm to enhance multi-microgrids performance incorporating IPFC." Power and Energy Society General Meeting, 2012 IEEE. IEEE, 2012. Singh, Sunil Kumar, Lobzang Phunchok, and Y. R. Sood. "Voltage profile and power flow enhancement with facts controllers." International Journal of Engineering Research and Technology. Vol. 1. No. 5 (July-2012). ESRSA Publications, 2012. Singh, S. N., and A. K. David. "Congestion management by optimising FACTS device location." Electric Utility Deregulation and Restructuring and Power Technologies, 2000. Proceedings. DRPT 2000. International Conference on. IEEE, 2000. Singh, S. N., and A. K. David. "Optimal location of FACTS devices for congestion management." Electric Power Systems Research 58.2 (2001): 71-79. Zhang, Juyong. "Optimal power flow control for congestion management by interline power flow controller (IPFC)." Power System Technology, 2006. PowerCon 2006. International Conference on. IEEE, 2006. Shao, Wei, and Vijay Vittal. "LP-based OPF for corrective FACTS control to relieve overloads and voltage violations." Power Systems, IEEE Transactions on 21.4 (2006): 1832-1839. Hajforoosh, S., S. M. H. Nabavi, and Mohammad AS Masoum. "Coordinated aggregated-based particle swarm optimisation algorithm for congestion management in restructured power market by placement and sizing of unified power flow controller." Science, Measurement & Technology, IET 6.4 (2012): 267-278. Singh, S. N., and A. K. David. "Placement of FACTS devices in open power market." Advances in Power System Control, Operation and Management, 2000. APSCOM-00. 2000 International Conference on. Vol. 1. IET, 2000. Cai, L. J., Istvan Erlich, and Georgios Stamtsis. "Optimal choice and allocation of FACTS devices in deregulated electricity market using genetic algorithms." Power Systems Conference and Exposition, 2004. IEEE PES. IEEE, 2004. Kazemi, Ahad, and Reza Sharifi. "Optimal location of Thyristor controlled phase shifter in restructured power systems by congestion management." Industrial Technology, 2006. ICIT 2006. IEEE International Conference on. IEEE, 2006. Ongsakul, W., and P. Bhasaputra. "Optimal power flow with FACTS devices by hybrid TS/SA approach." International journal of electrical power & energy systems 24.10 (2002): 851-857. Bhasaputra, P., and W. Ongsakul. "Optimal power flow with multi-type of FACTS devices by hybrid TS/SA approach." Industrial Technology, 2002. IEEE ICIT'02. 2002 IEEE International Conference on. Vol. 1. IEEE, 2002. Chung, T. S., and Y. Z. Li. "A hybrid GA approach for OPF with consideration of FACTS devices." Power Engineering Review, IEEE 20.8 (2000): 54-57. Ippolito, L., and P. Siano. "Selection of optimal number and location of thyristor-controlled phase shifters using genetic based algorithms." Generation, Transmission and Distribution, IEE Proceedings-. Vol. 151. No. 5. IET, 2004. Gerbex, Stéphane, Rachid Cherkaoui, and Alain J. Germond. "Optimal location of multi-type FACTS devices in a power system by means of genetic algorithms." Power Systems, IEEE Transactions on 16.3 (2001): 537-544. Ongsakul, W., and P. Bhasaputra. "Optimal power flow with FACTS devices by hybrid TS/SA approach." International journal of electrical power & energy systems 24.10 (2002): 851-857. Santiago-Luna, M., and J. R. Cedeno-Maldonado. "Optimal placement of FACTS controllers in power systems via evolution strategies." Transmission & Distribution Conference and Exposition: Latin America, 2006. TDC'06. IEEE/PES. IEEE, 2006. Sreejith, S., Sishaj Psimon, and M. P. Selvan. "Optimal location of interline power flow controller in a power system network using ABC algorithm." Archives of Electrical Engineering 62.1 (2013): 91-110. Mohamed, Khalid H., KS Rama Rao, and Khairul Nisak Bt Md Hasan. "Optimal parameters of interline power flow controller using particle swarm optimization." Information Technology (ITSim), 2010 International Symposium in. Vol. 2. IEEE, 2010. Ara, A. Lashkar, A. Kazemi, and S. Niaki. "Multiobjective optimal location of FACTS shunt-series controllers for power system operation planning." Power Delivery, IEEE Transactions on 27.2 (2012): 481-490. Sai Ram Inkollu and Venkata Reddy Kota, “Optimal setting of FACTS devices for voltage stability improvement using PSO adaptive GSA hybrid algorithm,” Engineering Science and Technology, an International Journal, Available online 17 March 2016. L. Ippolito and P. Siano, "Selection of optimal number and location of thyristor-controlled phase shifters using genetic based algorithms," in IEE Proceedings - Generation, Transmission and Distribution, vol. 151, no. 5, pp. 630-637, 13 Sept. 2004.
DOI: 10.9790/1676-1104019097
www.iosrjournals.org
97 | Page