WILDLAND FIRE HAZARD AND PRIORITIZING TREATMENTS ... a prototype decision support system (DSS) for evaluating wildfire hazard and prioritizing.
In: Proceedings of the 3rd International Fire Ecology and Management Congress. November 13-17, 2006, Town & Country Resort & Convention Center, San Diego, CA.
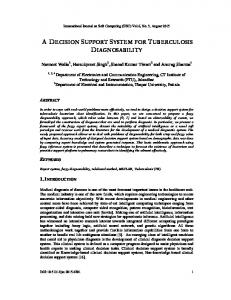
A MULTI-SCALE DECISION SUPPORT SYSTEM FOR EVALUATING WILDLAND FIRE HAZARD AND PRIORITIZING TREATMENTS Paul F. Hessburg USDA Forest Service, Pacific Northwest Research Station, Wenatchee, WA Keith M. Reynolds USDA Forest Service, Pacific Northwest Research Station, Corvallis, OR Robert E. Keane Missoula Fire Sciences Laboratory, Missoula, MT R. Brion Salter USDA Forest Service, Pacific Northwest Research Station, Wenatchee, WA INTRODUCTION Wildland fuels have accumulated in western US forests for the past 70 years due to 20th century human settlement and management activities, and a shifting climate. As demonstrated by recent wildland fires, added fuels foster intense wildfires that are difficult to contain and control. We present a prototype decision support system (DSS) for evaluating wildfire hazard and prioritizing subwatersheds for vegetation and fuels treatment. The DSS consists of logic and decision models. We evaluate hazard in the logic model as a function of three primary topics: fire vulnerability, wildfire severity, and risk of ignition. Primary topics have secondary topics under which data are evaluated. The logic model shows the state of each evaluated landscape with respect to fire hazard. In the decision model, we place the fire hazard summary conditions of each evaluated landscape in the context of the amount of associated wildland-urban interface (WUI). The logic and decision models are executed in EMDS (Reynolds et al. 2003), a DSS that operates in ArcGIS. We show that a decision criterion such as relationship to WUI can significantly influence the outcome of a decision to determine treatment priorities. We demonstrate use of the system with an example from the Rocky Mountain region in Utah, a planning area of about 4.8 million ha. METHODS We selected one map zone as a proving ground for our approach, but methods could be applied to any/all map zones (http://www.nationalmap.gov). Map zones are broad biophysical land units represented by similar surface landforms, land cover conditions, and natural resources; there are 66 in the continental US. Map zone 16 contains 575 subwatersheds and falls almost entirely within the State of Utah (Fig. 1). Most spatial data layers came from the LANDFIRE prototype mapping effort (Rollins et al. 2006, www.landfire.gov, Fig. 2); others data layers were obtained from the National Climate Data Center (NCDC) and National Lightning Detection Network (NLDN). We constructed a logic model within the EMDS modeling system to show how all elementary topics contributed to an evaluation of fire hazard. Under the fire vulnerability topic (Fig. 2), Figure 1. Subwatersheds of we estimated for each elementary topic (lowest level where data are map zone 16 in Utah. evaluated) the percentage area and degree of aggregation of observations exceeding a specified threshold value using spatial data layers provided by LANDFIRE 1
In: Proceedings of the 3rd International Fire Ecology and Management Congress. November 13-17, 2006, Town & Country Resort & Convention Center, San Diego, CA. and the FRAGSTATS spatial Fire hazard analysis program (McGarigal et al. 2002). For each elementary Fire vulnerability Fire behavior Ignition risk topic under fire severity and Surface fuels ignition risk, we estimated the Palmer drought Spread rate severity index Fire behavior fuel probability that conditions within model a given watershed exceeded a Keetch-Byram Flame length Fuel characterization drought index specified threshold value based on class Canopy fuels spatial layers generated by NDVI Relative Fireline intensity Greenness index FIREHARM (Keane et al. 2004) Canopy bulk density using the Rothermel (1972) Crown fire Lightning strike Canopy base height potential spread model, and data layers Fire regime from the NCDC and NLDN. condition class We evaluated evidence for low wildfire hazard within Figure 2. Organization of the fire hazard evaluation showing watersheds of a map zone to primary, secondary and elementary topics provide an ecological basis for determining treatment priority (Fig. 3). A decision analysis was then run in a separate but related decision model to incorporate ecological and logistical considerations for planning fuels treatments. The decision Fire hazard model was graphically designed with Criterium DecisionPlus (InfoHarvest, Seattle), which uses both the analytic hierarchy process (AHP, Saaty 1992) and the simple multi-attribute rating technique (SMART, Kamenetsky 1982) Fire vulnerability Fire severity Ignition risk to support planning activities such as priority setting, alternative selection, and resource allocation. The decision Fire behavior fuel model model contained three hazard criteria-Spread rate vulnerability, severity, and ignition risk, Palmer drought severity index and a fourth criterion--amount of subwatershed area in wildland-urban Surface fuels Fuel characterization interface (WUI), to illustrate expanding class the scope of analysis to include Flame length logistical factors that can influence Keetch-Byram drought index priorities. Canopy bulk density
RESULTS AND DISCUSSION Fire line intensity
Canopy fuels
Relative greenness Canopy base height Crown fire potential Fire regime condition class Lightning strikes
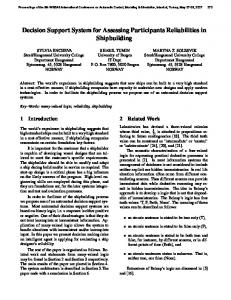
Figure 3. Composite of all partial products leading to the full evaluation of fire hazard for map zone 16.
2
There were pronounced differences in fire hazard between subwatersheds in the northern and southern portions of the study area. Hazardous wildfire conditions were largely driven by conditions conducive to severe fire behavior. Figure 3 shows the partial products of the evaluation process; from viewing this composite, we see the contributions to overall fire hazard.
In: Proceedings of the 3rd International Fire Ecology and Management Congress. November 13-17, 2006, Town & Country Resort & Convention Center, San Diego, CA. There appear to be significant opportunities for restoration. Priorities for treatment. The majority of subwatersheds with a priority rating of high or very high occurred in the southern two-thirds of the map zone (Fig. 4). The map of treatment priorities was strongly conditioned by the presence of wildland-urban interface in a subwatershed because of the emphasis placed on this criterion in the decision model. Normalized weights on primary criteria, derived from the pair-wise comparison process, were: wildland-urban interface, 0.50; fire severity, 0.27; fire vulnerability, 0.15; and ignition risk, 0.08. SUMMARY AND CONCLUSIONS This study provides a starting point for finer-scale planning. We examined the evidence for fire hazard in subwatersheds, but this information, by itself, is not sufficient for fuels treatment planning. Subwatersheds that exhibit a similar level of fire hazard do not necessarily share the same Figure 4. Priorities for fuels treatment in evaluation results for primary topics. Thus variability of subwatersheds of map zone 16, support for propositions within a subwatershed at the level in reflecting the influence of weighted the logic model where data are evaluated should be decision criteria and proximity to the wildland-urban interface; compare with considered when interpreting an evaluation result among overall fire hazard result (Fig. 3). subwatersheds at the primary or secondary topics level. This is one reason why model transparency is important. To that end, subwatersheds in the worst condition with respect to fuels may not be the best candidates for fuels treatment. In particular, additional strategic or logistical factors such as proximity to population centers, relationship to WUI, presence of endangered species, slope steepness, and road access all might be taken into account when prioritizing watersheds area for fuel treatment. LITERATURE CITED Kamenetzky, R., 1982. The relationship between the analytical hierarchy process and the additive value function. Decision Sciences 13, 702-716. Keane, R.E., Rollins, M., and Parsons, R. 2004. Developing the spatial programs and models needed for the implementation of the LANDFIRE Project. In: Proceedings of the 5th Symposium on Fire and Forest Meteorology and the 2nd International Wildland Fire Ecology and Fire Management Congress. http://ams.confex.com/ams/FIRE2003/5FIRE/abstracts/66069.htm McGarigal, K., S.A. Cushman, M.C. Neel and E. Ene. 2002. FRAGSTATS 3.0: spatial pattern analysis program for categorical maps. University of Massachusetts, Amherst. Reynolds, K.M., S. Rodriguez and K. Bevans. 2003. User guide for the Ecosystem Management Decision Support System, version 3.0. Environmental Systems Research Institute, Redlands. Rollins, M.G., Keane, R.E. and Zhu, Z. 2006. An overview of the LANDFIRE Prototype Project. General Technical Report RMRS-GTR-175, USDA Forest Service Rocky Mountain Research Station, Fort Collins, CO USA. 840 p. Rothermel, R.C. 1972. A mathematical model for predicting fire spread in wildland fuel. Research Paper INT-115, United States Department of Agriculture, Forest Service, Intermountain Forest and Range Experiment Station, Ogden, Utah. Saaty, T.L. 1992. Multicriteria Decision Making: The Analytical Hierarchy Process. RWS Publications, Pittsburgh, PA. 3