Departmmt of Engirweting, Universi~ of Warwick, Coventry CV4 7AL (UK) ... realized in custom PCBs housed in a Eurorack-based multisensor system. A comprehensive suite of software ... on the development of a superior electronic nose that.
Semm and Actuators B, 18-19 (1994) 24&243
240
A multisensor system for beer flavour monitoring using an array of conducting polymers and predictive classifiers Julian W. Gardner*, Timothy C. Pearce and Sharon Friel Departmmt of Engirweting,Universi~of Warwick,CoventryCV4 7AL (UK) Philip N. Bartlett and Neil Blair Depanbtent of Chemisby, Univmip of Southampton, Southampton SO9 5NH (UK)
Abstract This paper describes the results of a three year project, jointly funded by the UK government and industry, to develop a multisensor systemcapable of discriminatingbetween the aromas of different beers. The system consists of an array of up to 24 conducting polymer sensors (thin films electrodeposited onto a microelectrode structure). The conducting polymers provide the active layer in these conductometric odour sensors and respond differentially to the headspaces of beers and lagers. The interface circuitry and signal conditioning have been designed and realized in custom PCBs housed in a Eurorack-based multisensor system. A comprehensive suite of software modules has been developed to automate the sampling system and process the sensor array data. The output from the polymer array is pre-processed using a variety of algorithms (e.g., fractional change in conductance, normalized relative response) and then classified using a statistical (chemometric fingerprinting technique) or neural predictive classifier (multi-layer perceptron using back-propagation learning). The odour-sensing system can distinguish subtle taints, e.g., 0.5 ppm of diacetyl in an ethanol solution with only nine different varieties of conducting polymers.
Introduction
The flavour of beer is determined by the sensory impact from a combination of its smell, taste and texture. However, the sense of smell adds the largest contribution to its overall flavour [ 11.There are about 800 compounds that are known to influence the flavour of beers, each differing in their sensory thresholds of detection. Of these 800 or so compounds, about 40 may be regarded as having key impacts. Flavour is currently measured using a combination of analytical chemistry techniques, e.g., gas chromatography-mass spectrometry (GC-MS), and sensory analysis, e.g., a human tasting panel. However, this can be a slow and expensive process, with the analytical methods failing to identify some of the key compounds and the sensory panels producing qualitative information. In addition, the output from this type of analytical instrumentation is difficult to map onto sensory descriptors such as malty, warty, stale, and so on. Consequently, there is a considerable need for superior analytical instrumentation [2]. We have previously reported on the design of a 1Zelement conducting polymer chemoresistor based electronic nose for monitoring the flavours of lager beers [3]. This ‘Author to whom correspondence should be addressed.
O925-4005/94/$7.00 Q 1994 Elsevier Sequoia. All rights reserved SSDl 0925-4005(93)01144-S
instrument relies upon the manual injection of an odorant into a chamber containing the array of sensors and uses a statistical predictive classifier (a so-called chemometric fingerprinting algorithm). We now report on the development of a superior electronic nose that has fully automated flow-injection complete with selfdiagnostics, an array of 24 conducting polymers, and a multi-layer perceptron (MLF’) neural network, using back-propagation of errors learning, to predict class membership.
Automated flow-iujection system
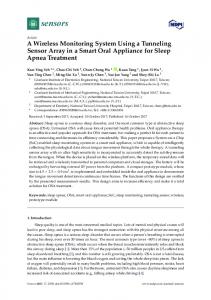
Figure 1 shows the basic configuration of our flowinjection system. Individual gases or a mixture of gases are supplied by pressurized bottles via the three input lines. Carrier flow into the test rig is controlled by three programmable mass-flow controllers (MFCs), leading to a mixing chamber used to combine the gases. The flow-path is configurable, via the action of the quad Neptune Research (NR) valve blocks, to direct carrier gases through to any selected sample vessel and from there onto the sensor head. We have selected nitrogen (line l), air (line 2) and CO, as carrier gas
241
Fig. 1. Schematic diagram of the odour-sampling apparatus for the automated electronic nose system, showing from left to right, gas bottle sources (line 1, 2 and 3), line filters, mass-flow controllers (MFC), non-return valves, two-way purging valve, quad normally closed (NC) valves, sample vessels, fuel cell with compressor pump, final flow-meter, sensor head by-pass valve and sensor head housing temperature, humidity and odour sensors.
TABLE 1. Conducting
polymers used in our electronic nose
Sensor No.
Polymer type
Sensor No.
Polymer type
1, 3, 5, 7, 9,
polypyrrolefIEATS/water polypyrrolefT’EATS/l’C polypyrrole/pTSA/ethanol polypyrrole/l%Vwater polypyrrole/HpSA/water
11, 12 13, 14 15, 16 17, 18 19-24
poly-pyrrole/HxWwater polypyrrole/OSA/water polypyrrole/pTSA/water polypyrrole/DSA/water unused
2’ 4 6 8 10
agents. The samples are maintained at an elevated temperature of 30 “C and are also constantly stirred at a controlled rate in order to promote an odorous headspace. During the sampling phase, the carrier gas is made to percolate through the sample, thereby increasing the sensor array response. All the valves and mass-flow controllers shown are under computer control. The sensor head contains an array of up to 24 conducting polymer chemoresistors mounted on a conical block, together with a PRT temperature sensor and capacitive humidity sensor. The 18 conducting polymers used in the work presented here are given in Table 1. We have used duplicates of each sensor in the array to check the reliability of the output. Full details of the polymer growth have been given elsewhere [3, 41. The electronic hardware has been implemented using custom-designed PCBs conforming to EurocardTM module standards in a Eurorack-based system. Figure 2 shows the lay-out of the four modules that are used in this system. Hardware functionality includes conducting polymer interface circuitry (module 2) providing 24 channels, described previously [3]. The system includes a fuel cell for the monitoring of the ethanol level if required. Further details of the instrumentation are given elsewhere [5].
Data acquisition and processing The custom-designed software was written in Borland Pascal 7.0 as a protected-mode DOS application. The software provides calibration, data acquisition, data processing, data display and data export in standardized Lotus 1-2-3TMformat (for subsequent processing using commercial pattern-recognition packages). A real-time rig monitor in the form of a graphical user interface (GUI) has been implemented to also allow manual control over the odour-sampling apparatus. Figure 3 shows the sampling sequence used for the purposes of this study. Three cleaning phases have been included in the sequence to ensure contamination-free odour sampling. We initially used clean air to prepare the system and CO, to store the lager samples in each of the three sample vessels and then carry the odour to the sensor head. Automated self-diagnostics are also carried out to improve confidence in the acquired data. In all, the sampling sequence takes approximately 4 h for three individual samples. The digitized signals from the sensor array were averaged to reduce bit noise and the fractional change in conductance calculated for each sensor i responding to an odour j:
51 and also by a neural network. In the latter case, the sensor signals were normalized so that the values lay in the range [0, l] and hence maximized the use of the network input space. Then the values were fed into a three-layer fully connected MLP neural network using a back-propagation of errors learning regime. There were 18 elements in the input layer, six elements in the hidden layer and three elements in the output layer representing the odour classes. Sigmoid functions were used in the hidden layer to act as data ‘squashing functions’, combined with linear transfer functions in the input and output layers. A learning rate of 1.0 and momentum term of 0.7 were chosen because of good results achieved earlier [6]. Training took place using the three-fold cross-validation method over 100 000 training iterations.
Results
Fig. 2. Schematic diagram of the electronic circuitry for the automated electronic nose system showing module 2, six-channel conducting polymer interface card; module 3, temperature and humidity card; module 4, system cards; module 5, flow injection rig controller.
Fig. 3. Flow-chart of the phases in the odour-sampling
procedure.
(1) was generally negative, except for sensor nos. 5 and 6. The overall array response is thus an 18-dimensional vector representing the odour. The response vectors were analysed using the chemometric fingerprinting method reported previously [3,
This response parameter
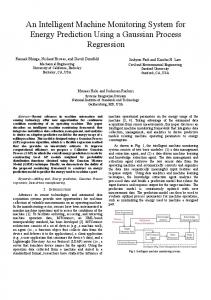
The automated electronic nose system was tested using an ethanol solution representing the basic chemical constituents of a lager beer: 4% ethanol in pure deionized water. Considerable effort was spent in optimizing the stability and response of the polymer array. First, it was found that the response of the sensors fell sharply with increasing temperature, and so the array was run at a constant temperature of about 35 “C. Secondly, CO, carrier gas produced a drift in the baseline resistance of some of the sensors and so nitrogen was used in all phases except during sampling. Thirdly, some sensors were sensitive to water vapour, but this sensitivity changed in the presence of the ethanol. Clearly, there is a competition in hydrophilic binding sites within the polymers between water and ethanol. After some effort, the experimental coefficient of variance was reduced to below 7%. Five samples of pure carrier gas, a 4% ethanol solution, and a 4% ethanol solution with 0.5 ppm diacetyl(2,3 butanedione) added, were then tested. The level of diacetyl, present in the lager beer, is closely associated with the maturation of the brew and is therefore of prime interest to brewers. Figure 4 shows radar plots of the response vectors calculated by eqn. (1). Clearly, the baseline response (to pure carrier gas) is quite different from that to the ethanol solutions. The difference between the control ethanol solution with and without the added diacetyl taint is more subtle. However, sensors 2, 7, 9, 10, 17 and 18 do show small but statistically significant variations between all three classes. These sensors were selected for use in the chemometric fingerprinting technique described previously [3, 51. This technique, employing a simple array normalization scheme, was used to obtain a statistical fingerprint of the class data against which all 15 samples were then compared in a leaving-
(4
5
15
5
15
5
6
14
b
14
b
10
IO
@I
(c)
IO
Fig. 4. Radar plots of (a) tbe pure carrier gas, (b) the ethanol solution (4% v/v) and (c) 0.5 ppm of diacetyl in the ethanol solution. The solid lines indicate the mean values, while the dashed lines show the upper and lower confidence levels. TABLE 2. Number of odours correctly predicted by the pattern-recognition
methods
Method
Carrier gas
Ethanol solution
Diacctyl taint
Apparent
Fingerprinting Back propagation
5 5
4 5
4 4
13/15 or 87% 14/15 or 93%
one-out method. Then four of the five samples were used to train an 18 X6X3 neural network and the fifth used to test the network (three-fold cross-validation). This was repeated in turn for each of the five samples until all 15 measurements had been predicted. The chemometric fingerprinting method correctly predicted the class of 13 of the 15 measurements, while the neural network proved to be slightly better with 14 out of 15 correctly predicted. Table 2 summarizes the results.
Conclusions An electronic nose with a fully automated flowinjection system has been developed for the analysis of flavours in lager beers. The system has been designed in a modular lay-out, runs under DOS on a PC platform and is self-diagnostic. A conducting polymer electronic nose has been shown to provide a good sensitivity to a diacetyl taint at the sub-ppm level.
success-rate
Acknowledgements The authors wish to thank the Department of Trade and Industry, Ministry of Agriculture, Fisheries and Food, Bass plc and Neotronics Ltd. for their Gnancial support of this LINK project. References C. Murphy and W.S. Cain, Taste and olfaction: independence versus interaction, Psych& Eehavio~ 24 (1980) 601-605. M.C. Meilgaard, The tlavour of beer, MB4,4 Tech. Q., 28 (1991) 132-141. T.C. Pearce, J.W. Gardner, S. Friel, P.N. Bartlett and N. Blair, Electronic nose for monitoring the tlavour of beers, Anafyst, 118 (1993) 371-377. J.W. Gardner and P.N. Bartlett, Device for sensing volatile materials, ht. Patent No. WO93/03355 (Feb. 1993). T.C. Pearce, J.W. Gardner and S. Friel, Machine olfaction: intelligent sensing of odours, IEEE Con&, France, Oct. 1993. J.W. Gardner, EL Hines and H.C. Tang, Detection ofvapours and odours from a multisensor array using pattern recognition techniques, Part 2. Artificial neural networks, Sensors and Actuators B, 9 (1992) 9-15.