Copyright 2004 by the Genetics Society of America DOI: 10.1534/genetics.103.013227
A Multistage Testing Strategy for Detection of Quantitative Trait Loci Affecting Disease Resistance in Atlantic Salmon Thomas Moen,*,1 Kjersti T. Fjalestad,* Hege Munck* and Luis Gomez-Raya† *AKVAFORSK (Institute of Aquaculture Research), N-1432 Aas, Norway and †` Area de Produccio´ Animal, Centre UdL-IRTA, 25198 Lleida, Spain Manuscript received January 10, 2003 Accepted for publication February 1, 2004 ABSTRACT A multistage testing strategy to detect QTL for resistance to infectious salmon anemia (ISA) in Atlantic salmon is proposed. First, genotyping of amplified fragment length polymorphisms (AFLP) and a transmission disequilibrium test (TDT) were carried out using dead offspring from a disease resistance challenge test. Second, AFLP genotyping among survivors followed by a Mendelian segregation test was performed. Third, within-family survival analyses using all offspring were developed and applied to significant TDT markers with Mendelian inheritance. Maximum-likelihood methodology was developed for TDT with dominant markers to exploit linkage disequilibrium within families. The strategy was tested with two fullsib families of Atlantic salmon sired by the same male and consisting of 79 offspring in total. All dead offspring from the two families were typed for 64 primer combinations, resulting in 340 scored markers. There were 26 significant results out of 401 TDTs using dead offspring. In the second stage, only 17 marker families showed Mendelian segregation and were tested in survival analysis. A permutation test was performed for all survival analyses to compute experimentwise P-values. Two markers, aaccac356 and agccta150, were significant at P ⬍ 0.05 when accounting for multiple testing in the survival analyses. The proposed strategy might be more powerful than current mapping strategies because it reduces the number of tests to be performed in the last testing stage.
T
HE spread of diseases is a major problem in aquaculture production, and determining the genetic architecture of disease resistance traits is of great interest to geneticists working on aquaculture species. Mapping of quantitative trait loci (QTL) for disease resistance is one approach that can provide information on the location and effects of the genes influencing the trait. QTL can be identified through a genome scan in which the segregation of a large number of markers, distributed over the whole genome, is tested for associations with the recorded phenotypes. Ideally, the markers should be codominant and have high heterozygosity. Microsatellite markers fulfill both these criteria and are regarded by many as the marker of choice for QTL research (e.g., Jackson et al. 1998; Ozaki et al. 2001). The development of microsatellites is, however, a resource-demanding process, and for many species, highdensity microsatellite maps are not available. Among the aquaculture species, microsatellite maps have been published on rainbow trout (Young et al. 1998; Sakamoto et al. 2000; Nichols et al. 2003), catfish (Waldbieser et al. 2001), tilapia (Kocher et al. 1998; Agresti et al. 2000), and Japanese flounder (Coimbra et al. 2003), but not on Atlantic salmon. 1 Corresponding author: AKVAFORSK, Box 5010, N-1432 Aas, Norway. E-mail:
[email protected]
Genetics 167: 851–858 ( June 2004)
When a genetic map is not available, an alternative strategy for a genome scan is to use markers that can be developed without prior knowledge of the DNA sequence in the marker region. Among these markers, amplified fragment length polymorphisms (AFLP) markers are the most widely used. AFLP markers (Vos et al. 1995) are known to be highly reproducible ( Jones et al. 1997; Bagley et al. 2001), and several markers can be genotyped at a time. AFLPs, however, are dominant markers, meaning that one of the homozygous genotypes cannot be distinguished from the heterozygous genotype without the use of special equipment/software (Castiglioni et al. 1999; Piepho and Koch 2000). The dominant nature of AFLP markers makes their use in mapping experiments more difficult. QTL mapping for disease resistance in fish typically relies on the use of challenge tests in which offspring groups are exposed to the disease. The survival times are recorded, or each animal is classified simply as susceptible or resistant. The data can be analyzed by different methods. We propose in this article a testing strategy based on two statistical methods used in research on humans. The transmission disequilibrium test (TDT; Spielman et al. 1993) compares the number of times that a marker allele is transmitted or not transmitted from a heterozygous parent to an affected offspring, and therefore only the affected offspring are consid-
852
T. Moen et al.
ered. The TDT has been applied only to codominant markers such as microsatellites, because the test requires that alleles can be traced from parents to offspring. Survival analysis (Altman 1991) has been widely used in human medicine for testing of medical treatments. Survival analysis is expected to be more powerful than the TDT, since the variable used is the survival time of each animal instead of the categorical characteristics “susceptible/resistant.” However, it is more labor demanding, since it requires the genotyping of both susceptible and resistant animals. A common problem in QTL mapping experiments attempting a large coverage of the genome is reduced power of detection due to multiple testing; i.e., when many markers are tested, some tests are expected to give significant results just by chance. We propose in this article a strategy for detection of QTL that takes into account both the multiple testing problem and the possible lack of a genetic map. The testing stages of this scheme are (1) affected fish from a disease-resistance challenge test are genotyped for AFLP markers and the data are analyzed with the TDT; (2) resistant fish are genotyped for significant markers from stage 1, and a test for Mendelian segregation is performed; and (3) all TDT-significant markers that follow Mendelian segregation are analyzed using survival analysis. The strategy makes it possible to perform a genome scan in a relatively fast and cost-effective way. Furthermore, it reduces the multiple testing problem because only a subset of markers is taken to the final test stage. Objectives needed to make the strategy feasible were (a) to develop a maximum-likelihood method to allow transmission disequilibrium testing using dominant markers and (b) to develop within-family survival analysis for QTL detection with dominant markers. The strategy is a general approach to detect QTL in species with no available maps. However, we have developed and applied the strategy to detect QTL for resistance against infectious salmon anemia (ISA) in Atlantic salmon. ISA causes severe problems in the Atlantic salmon farming industry in Norway, Canada, Scotland, and the United States (Thorud and Djupvik et al. 1988; Mullins et al. 1998; Rodger et al. 1998; Bouchard et al. 2001). The causal agent belongs to the orthomyxoviridae family of RNA viruses (Falk et al. 1997), and typical pathological changes include severe anemia, leucopenia, ascites, and hemorrhagic liver necrosis (Thorud and Djupvik et al. 1988; Evensen et al. 1991). The accumulated mortality of an attack ranges from 15 to 100% (Thorud 1991). Atlantic salmon is the only species known to develop the disease, although the virus may survive and replicate in other salmonids as well (Nylund et al. 1997). MATERIALS AND METHODS Challenge test for resistance to ISA: The genetic material came from the 1995 class of the breeding population of Aqua-
Gen A/S, Hemne, Norway. The breeding population consists of paternal half-sib families, each comprised of two full-sib families (Refstie 1990). Challenge tests for ISA are carried out on a routine basis at VESO Vikan AkvaVet, Namsos, Norway, as part of the procedure for broodstock selection. Prior to the challenge test, the fish were kept under standard environmental conditions and individually tagged with passive integrated transponder tags. The test was performed 8 months after first feeding. After 8 days of acclimatization at the test facilities, the fish were intraperitoneally injected with 0.2-ml doses of the infectious material diluted in 0.85% PBS. The challenge was done in fresh water with an approximate water temperature of 12⬚. Mortality was monitored until 50% of the offspring overall were dead and then the experiment was terminated. The cause of death was verified by bacteriological tests of 10% of the fish using blood-agar plates. Plates with and without 2% NaCl were used, since other potential pathogens could have a range of salt preferences. Dead fish were collected each day and stored at ⫺20⬚ for later DNA analyses. After termination of the test, the survivors were killed and stored at ⫺20⬚. All procedures were according to standard operation procedures at VESO Vikan AkvaVet, which is operated in compliance with the OECD principles of Good Laboratory Practice with regard to European Union Council Directive 88/320/ EEC. From the larger set of families tested, tissue was collected from parents and all offspring from 30 randomly selected paternal half-sib families to be used in this study. From among these 30 families, 1 half-sib family, composed of 2 full-sib families of 40 and 39 offspring, was chosen on the basis of (1) the number of informative AFLP markers observed in the three parents and (2) the distribution of susceptible/resistant individuals within each full-sib family (1:1 ratio considered optimal). DNA extraction: DNA was extracted using the DNeasy kit (96-well format) from QIAGEN (Chatsworth, CA). The DNA concentration was estimated from the absorbance at 260 nm (A260), measured on a GeneQuant II spectrophotometer (Amersham Pharmacia). The quality of the DNA was inspected using agarose gel electrophoresis and the A260/A280 ratio. AFLP genotyping: The AFLP (Vos et al. 1995) genotyping was done using the AFLP Analysis System I and the AFLP starter primer kit from Life Technologies and according to the kit manual. The EcoRI primers were end labeled with ␥-33P. DNA fragments were separated on 6% polyacrylamide gels (19:1 acrylamide:bis; 7.5 m urea, 1⫻ TBE buffer). The electrophoresis was run at 60 W constant power. Only markers that were reproducible and had a fragment size of 50–600 bp were scored. The AFLPs were scored as dominant markers. The genotypes of parents with the bandpresent phenotype for a given marker were inferred from the AFLP phenotypes of offspring. The AFLP markers were named by the three selective nucleotides of the EcoRI primer, followed by the three selective nucleotides of the MseI primer, with the fragment length (in base pairs) at the end. Multistage testing strategy: The strategy was based on discarding markers in the following sequential tests: transmission disequilibrium test, Mendelian segregation test, and QTL detection using survival analysis within families (Figure 1). Transmission disequilibrium test: An application of the TDT was developed to deal with dominant markers and the family structure currently used in challenge tests by the Norwegian salmon industry (one sire mated to two dams). The form of the TDT depended on the parental genotypes. The standard TDT is a McNemar test: 2 ⫽ (T ⫺ NT)2/(T ⫹ NT), where T is the number of times that the allele in question was transmitted from a heterozygous parent to an affected offspring, and NT is the number of times that the allele was not transmitted (from a heterozygous parent carrying the allele to an affected offspring). The McNemar test was performed for
A QTL Mapping Strategy
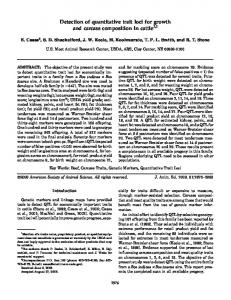
Figure 1.—Experiment design for the challenge test for ISA resistance in Atlantic salmon.
markers having one of the following parental marker genotype configurations: (1) sire heterozygous (Aa) and both dams homozygous for the null allele (aa ; the test was then done on the half-sib family); (2) sire Aa, one of the dams aa and the other dam homozygous for the band allele (AA; the test was then done on the full-sib family with mixed band-present/ band-absent offspring); (3) sire aa and one or two dams Aa (the test was then done on the full-sib family/families with mixed band-present/band-absent offspring). McNemar’s test approximately follows a chi-square distribution with 1 d.f. For the other markers, one or both full-sib groups had two heterozygous parents. Maximum-likelihood methods were developed to detect distorted segregation of alleles among the affected offspring. Table 1 lists the expected genotype frequencies used to construct the likelihood equation when
853
sire and both dams were heterozygous. In Table 1, vs, vd1, vd2 are the transmission parameters from the sire, dam 1, and dam 2, respectively. A transmission parameter is the probability of transmission of one of the parental alleles to its offspring. Under the null hypothesis vs ⫽ 0.5, vd1 ⫽ 0.5, and vd2 ⫽ 0.5; K1 and K2 are constants. The likelihood equation corresponding to the case in which the sire and both dams were heterozygous can be found in the first row of Table 2. A test for the transmission disequilibrium based on the likelihood ratio statistics was performed by likelihood ratio test (LRT) ⵑ ⫺2 ln L(0.5, 0.5, 0.5)/L(vs, vd1, vd2) with 2 d.f. Similar equations and tests were derived for the other situations (Table 2). Mendelian segregation test: A test for the Mendelian segregation was carried out for each marker that turned out significant in the TDT. The expected segregation ratios were tested using chi-square goodness of fit. The significance levels used for the test were 0.10, 0.05, and 0.01. Markers significant at any of those levels were not used in the following testing stage. The use of threshold at 0.10 was done to assure that markers in the survival analyses were segregating in a Mendelian fashion. QTL detection using survival analysis within families: Survival analysis utilizes more information than TDT does, since the variable used is the number of days each fish survived. Also, it considers both susceptible and resistant fish. All fish shared the same environment and a survival analysis within families was therefore appropriate. The two groups to be compared were (1) offspring with the band-present marker phenotype within a full-sib family and (2) offspring with the band-absent marker phenotype within the same full-sib family. Hypothesis testing was carried out using a log-rank test, LRANK ⫽ (Oa ⫺ E a)2/E a ⫹ (Op ⫺ E p)2/E p, where E a ⫽ 兺ti⫽1Eai , E p ⫽ 兺ti⫽1E pi , where Eai ⫽ di (rai/ri); Epi ⫽ di (rpi/ri); di is the total number of cases (fish that died) during day i; ri is the total number of fish at risk (still alive) at the beginning of day i; rai is the number of fish at risk in the bandabsent group at the beginning of day i; rpi is the number of fish at risk in the band-present group at the beginning of day i; Oa and Op are the total number of cases in the band-absent and band-present groups, respectively (E a and E p are the corresponding expected counts). LRANK is distributed as a 2 distribution with 1 d.f. Kaplan-Meier survival curves were constructed for both groups by computing the cumulative proportion of offspring within the group still alive at any time; S a(ti) ⫽ S a(ti⫺1) (rai ⫺ d ai)/rai for the band-absent group, and Sp(t i) ⫽ Sp(t i⫺1) (rpi ⫺ d pi)/a pi for the band-present group. The difference between the survival curves for the two groups was estimated by the hazard ratio:
TABLE 1 The expected genotype frequencies within full-sib family when sire and both dams were heterozygous Allele from sire A A a a A A a a
Allele from dam 1
Allele from dam 2
Genotype
A A A A — — — —
— — — — A a A a
AA Aa AA Aa AA Aa AA Aa
Phenotype Band Band Band Band Band Band Band Band
present present present absent present present present absent
Expected genotype frequency vs vd1 vs (1 ⫺ vd1) (1 ⫺ vs) vd1 (1 ⫺ vs)(1 ⫺ vd1) vs vd2 vs (1 ⫺ vd2) (1 ⫺ vs) vd2 (1 ⫺ vs) (1 ⫺ vd2)
vs, vd1, and vd2 are the transmission parameters from the sire and dam 1 and 2, respectively.
854
T. Moen et al. TABLE 2 Likelihood and McNemar equations for transmission disequilibrium testing for the possible combinations of parental genotypes for one sire mated to two dams Parental genotypes
Sire
Dam 1
Dam 2
Aa
Aa
Aa
Aa
Aa
aa
Aa Aa Aa aa
Aa aa aa Aa
AA aa AA —
Likelihood or 2 equations L(vs, vd1, vd2) ⫽ K1((1 ⫺ vs)(1 ⫺ vd1))n a1(1 ⫺ (1 ⫺ vs)(1 ⫺ vd1))n p1 ⫻ K 2((1 ⫺ vs)(1 ⫺ vd2))n a2(1 ⫺ (1 ⫺ vs)(1 ⫺ vd2))n p1 L(vs, vd1) ⫽ K1((1 ⫺ vs)(1 ⫺ vd1))n a1(1 ⫺ (1 ⫺ vs)(1 ⫺ vd1))np1 ⫻ K 2(1 ⫺ vs)n a 2 v ns p 2 L(vs, vd1) ⫽ K1((1 ⫺ vs)(1 ⫺ vd1))na1(1 ⫺ (1 ⫺ vs)(1 ⫺ vd1))np1 2 ⫽ (n p1 ⫹ n p2 ⫺ n a1 ⫺ n a2)2/(n p1 ⫹ n p2 ⫹ n a1 ⫹ n a2) 2 ⫽ (n p1 ⫺ n a1)2/(n p1 ⫹ n a1) 2 ⫽ (n p1 ⫺ n a1)2/(n p1 ⫹ n a1)
Degrees of freedom 2 1 1 1 1 1
K1 and K 2 are constants; vs, v d1, and v d2 are the transmission parameters from the sire, dam 1, and dam 2, respectively; n a1 and n a2 are the numbers of affected offspring having the band-absent marker phenotype in families 1 and 2, respectively; n p1 and np2 are the numbers of affected offspring having the band-present marker phenotype in families 1 and 2, respectively.
h⫽
Op/E p Oa/E a .
An approximate 95% confidence interval for h was estimated by the back transformation of the standard error of loge(h ) with value SE(loge(h)) ⫽
冪E
1 p
⫹
1 . Ea
Permutation test using survival analysis: Following Churchill and Doerge (1994), a permutation test was performed to account for multiple testing. The usual procedure is to shuffle the trait values randomly and then reassign each trait value to a new individual while retaining the genotype at all typed markers for each individual. In the present permutation test, the individuals were shuffled and the number of surviving days was reassigned in the same order as the real data. This was done for computational ease since shuffling the trait values would require ordering according to the number of days alive. The shuffling was done 100,000 times within each full-sib family and for all markers tested in the survival analysis. A log-rank test was computed for each marker and permuted sample. Each permutation set corresponding to all markers was ordered and the highest value taken. The experimentwise critical value was computed as the number of times that the observed LRT value, when analyzing the true data, was higher than the highest value of each permutation set divided by 100,000. In addition, one permutation test with one million replicates but using one single marker was performed to compare empirical and tabulated thresholds in the survival analysis.
RESULTS
Parents and affected offspring of a paternal half-sib family comprising of two full-sib families were genotyped with AFLP markers. A total of 64 AFLP primer combinations were used, resulting in 340 scored markers (a polymorphism rate of 5.3%). A total of 401 transmission disequilibrium tests were performed using susceptible fish and the 340 polymorphic markers. This
first testing stage resulted in 6 markers significant at P ⬍ 0.01 and 20 significant at P ⬍ 0.05 (Table 3). This result indicates that the rate of significant markers is higher than expected by chance; there is an “excess” of significant markers that could be attributed to the association of alleles with disease resistance. The second testing stage consisted of genotyping survivors for all significant markers at stage 1 and carrying out a Mendelian segregation test. This test was performed to reduce the number of tests in the third stage and to identify markers with non-Mendelian inheritance. It is shown in Table 3 that six, five, and four of the TDT significant markers departed from the expected Mendelian segregation at P ⬍ 0.01, P ⬍ 0.05, and P ⬍ 0.10, respectively. These markers were eliminated from the third stage of analyses. The third stage was to perform survival analyses for markers that were significant in the TDT and that also followed Mendelian inheritance. A total of 17 markers were tested using survival analysis, from which 2 and 7 were significant using the tabulated thresholds at P ⬍ 0.1 and P ⬍ 0.05, respectively (Table 4). A permutation test for the survival analysis with one million replicates was, first, performed for one single marker to compare tabulated and empirical thresholds. Table 5 shows that tabulated thresholds are conservative, in particular, at low significance levels. Next, a permutation test was performed simulating and testing all 17 markers in the survival analysis to account for multiple testing. The results of the permutation test are shown in Table 4. Only the 2 markers aaccac74 and agccta290 remained significant at P ⬍ 0.05 after the permutation test. The hazard ratio was ⵑ0.25 for both markers; i.e., a reduction of the mortality rate of ⵑ25% was observed among fish inheriting the band-present allele for either marker. The Kaplan-Meier survival curves for markers aac
A QTL Mapping Strategy
855
TABLE 3 LRT after TDT among susceptible offspring and Mendelian segregation test
Parental genotypes
No. of resistant offspring
No. of susceptible offspring
Marker
Sire
Dam
p
a
p
a
LRT
MST
acactg299 acacat393 aggcat376 aaccta206 actcta476 aacctg366 agcctt142 aggcat346 aggctt110 agccta219 acactg369 aagcag276 aggcaa241 aggctt391 acgcag88 acacaa404 aagctt275 acactg289 aagcta477 agccta290 acacta397 acgcac188 actcaa133 acccaa181 aaccac74 acgcag89
aa Aa Aa aa Aa Aa aa Aa Aa Aa Aa aa aa Aa Aa Aa aa aa Aa aa aa aa aa aa aa Aa
Aa aa aa, aa Aa aa, aa aa, Aa Aa Aa, aa Aa, Aa aa, Aa Aa, Aa Aa Aa Aa Aa, aa aa, Aa Aa Aa aa,aa Aa Aa Aa Aa Aa Aa Aa
19 17 5, 5 16 6,5 12, 21 17 16, 17 10, 13 4, 16 15, 11 4 15 20 16, 7 5,19 16 16 6,6 6 14 12 6 6 6 9
2 2 13, 17 3 13,17 6, 1 4 3, 5 9, 9 15, 6 4, 11 15 4 1 1, 13 14,3 5 5 12, 13 16 5 4 15 15 15 8
6 17 7,5 8 6,4 13,16 8 16, 11 14, 10 9,11 17, 13 9 9 11 15, 3 13,14 6 6 11,10 12 8 12 7 8 13 17
10 2 13,11 7 14,11 7, 1 9 3, 5 4, 4 12, 3 3, 3 11 4 4 4,14 6,3 10 11 9, 6 3 12 9 8 9 4 3
13.76** 11.84** 10.00** 8.89** 8.80** 8.76* 8.05** 7.86* 7.08* 6.84* 6.49* 6.37* 6.37* 6.24* 6.20* 6.16* 5.76* 5.76* 4.57* 4.55* 4.26* 4.00* 3.86* 3.86* 3.86* 3.85*
4.56* 23.68** 13.47** 5.76* 15.21** 3.79†, 8.21** 3.79*** 1.72, 8.53** 4.38* 4.9*, 0.0 0.21 4.33* 8.00** 2.37 2.37, 7.81** 0.11, 1.92 1.32 0.95 0.89 0.03 0.64 3.27*** 2.78*** 2.63 0.00 0.44
p, band-present phenotype; a, band-absent phenotype. Parental genotypes: Aa is heterozygous and aa is homozygous for the band-absent allele. MST, Mendalian segregation test. *P ⬍ 0.05; **P ⬍ 0.01; ***P ⬍ 0.10.
cac74 and agccta290 are shown in Figure 2. Only at the very beginning did the lines corresponding to the bandpresent and band-absent groups cross each other for marker agccta290, indicating possible departure from the proportional hazard assumption. This assumption means that there is a constant relative risk along time for each tested group. However, the crossing of the two lines takes place at the very beginning and could be attributed to chance. DISCUSSION
The purpose of this study was to propose a strategy to detect QTL for disease resistance in aquaculture species for which genetic maps are not available. The strategy is multistage: (1) TDT in deceased offspring is applied using AFLPs; (2) only markers that were significant in the affected offspring are typed for the survivors and a test for Mendelian segregation is performed; and (3) a survival analysis is performed for markers that were significant for the TDT but segregated according to
Mendelian inheritance. The advantages of this strategy are, first, that large parts of the genome can be covered using fast and easily applicable typing. Second, the number of tests in the last stage is reduced, allowing a more powerful design. The need to account for multiple testing is a general problem in genome-wide testing for QTL. The proposed strategy alleviates the problem by making a large reduction in the number of tests performed in the survival analysis. However, the multistage method was not optimized in the sense that thresholds at the TDT stage could be made larger or smaller to maximize the probability of not missing a QTL while limiting the number of tests to be performed in the survival analysis. If the threshold is made smaller than that in this study (e.g., top 20% ranking markers at the TDT stage), then the number of tests to be performed is larger in the survival analysis and the overall power might be reduced. More research is needed to establish which thresholds should be used to achieve more powerful designs. The approach used in this study assumes that the TDT
856
T. Moen et al. TABLE 4 Survival analysis results for the resistance allele, hazard ratio, confidence interval of hazard ratio at 5%, LRANK, and experimentwise P-values
Marker
Resistance allele
Hazard ratio
Confidence interval
LRANK
Experimentwise P-value
0.12–0.74 0.11–1.02 0.14–0.83 0.22–1.44 0.09–1.37 0.23–0.54 0.29–3.43
6.037* 5.743* 4.821* 1.307 1.071 0.223 0.000
0.168 0.197 0.312 0.987 0.996 1.000 1.000
0.11–0.56 0.11–0.64 0.14–0.76 0.14–0.85 0.14–0.79 0.16–1.02 0.08–0.87 0.21–1.80 0.27–1.57 0.25–2.31
9.625** 8.724** 5.441* 5.17* 4.950* 4.818* 1.892 1.026 0.810 0.193
0.031 0.046 0.233 0.265 0.293 0.312 0.932 0.997 0.999 1.000
Dam 1 acacaa440 acgcag89 acacta397 aagcta477 acgcag88 acactg369 aggcat346
Band Band Band Band Band Band Band
present present absent present absent present present
0.30 0.33 0.34 0.57 0.36 0.77 1.00
agccta290 aaccac74 aagctt275 aagcta477 acactg289 acactg369 aggctt391 agccta219 acccaa181 acacaa440
Band Band Band Band Band Band Band Band Band Band
present present absent present absent present absent present present absent
0.25 0.27 0.32 0.34 0.34 0.40 0.27 0.62 0.65 0.76
Dam 2
*P ⬍ 0.05; **P ⬍ 0.01.
performed on susceptible fish and the survival analysis used on the whole data set are independent tests. This assumption is not likely to be fully correct, since there will be some dependence between the variables used (affected/resistant and number of days survived). The assumption is, however, supported by the fact that the two variables are different variables and also because the animals tested in the TDT are only a subset of the animals tested in the survival analysis. The significant markers from TDT were tested for departures from Mendelian segregation after incorporating resistant animals. Markers not following Mendelian inheritance were removed from the next testing TABLE 5 tabulated and empirical thresholds at significance levels of 0.005, 0.01, 0.05, and 0.10 after carrying a permutation test with one marker and one million replicates 2
Significance level 0.005 0.010 0.050 0.100
Threshold Empirical
Tabulated
7.10 6.01 3.50 2.46
7.88 6.64 3.84 2.71
stage (survival analysis). Among the markers that were discarded because of non-Mendelian inheritance, several might be segregating anomalously just by chance. Another possible reason for the non-Mendelian segregation is that Atlantic salmon is a partly tetraploid organism (Wright et al. 1983; Allendorf and Thorgaard 1984; Allendorf and Danzmann 1997). As a result of the application of the QTL testing strategy, two putative QTL affecting resistance to ISA were found within one of the full-sib families. A first crude analysis of the segregation of the two QTL showed linkage between them (results not shown). A dense genetic map around this area would help for fine mapping of the putative QTL. The lack of an available genetic map makes it difficult to locate many markers around the two significant markers. One possibility to speed up this process is the construction of a linkage map starting by establishing linkage between each of the two significant AFLP and the rest of the AFLP polymorphisms. In addition, the genotyping of available microsatellites in our material might be very useful to construct a genetic map around this area. The general conclusion of this study is that QTL affecting disease resistance can be detected in species in which genetic maps are not available. This represents a shortcut compared to QTL mapping strategies currently used in terrestrial farm animals. Finally, the multistage QTL testing strategy is potentially more powerful than
A QTL Mapping Strategy
Figure 2.—Kaplan-Meier survival curves for markers aaccac74 and agccta290.
conventional genome-wide scans where thresholds must be set very high to account for the testing of a large number of genetic markers. We are grateful to the personnel of VESO Vikan AkvaVet and AquaGen for the biological material and for the challenge testing. This work has been supported by the Norwegian Research Council with project no. 130162/130 titled “Strategic QTL Research Plan for Disease Resistance in Atlantic Salmon and Cattle.”
LITERATURE CITED Agresti, J. J., S. Seki, A. Cnaani, S. Poompuang, E. M. Hallerman et al., 2000 Breeding new strains of tilapia: development of an artificial center of origin and linkage map based on AFLP and microsatellite loci. Aquaculture 185: 43–56. Allendorf, F. W., and R. G. Danzmann, 1997 Secondary tetrasomic segregation of MDH-B and preferential pairing of homeologues in rainbow trout. Genetics 145: 1083–1092. Allendorf, F. W., and G. H. Thorgaard, 1984 Polyploidy and the evolution of salmonid fishes, pp. 1–53 in The Evolutionary Genetics of Fishes, edited by J. B. Turner. Plenum Press, New York. Altman, D. G., 1991 Practical Statistics for Medical Research. Chapman & Hall, London.
857
Bagley, M. J., S. L. Anderson and B. May, 2001 Choice of methodology for assessing genetic impacts of environmental stressors: polymorphism and reproducibility of RAPD and AFLP fingerprints. Ecotoxicology 10: 239–244. Bouchard, D., K. Brockway, C. Giray, W. Keleher and P. L. Merrill, 2001 First report of infectious salmon anemia (ISA) in the United States. Bull. Eur. Assoc. Fish Pathol. 21: 86–88. Castiglioni, P., P. Ajmonemarsan, R. Vanwijk and M. Motto, 1999 AFLP markers in a molecular linkage map of maize: codominant scoring and linkage group distribution. Theor. Appl. Genet. 99: 425–431. Churchill, G. A., and R. W. Doerge, 1994 Empirical threshold values for quantitative trait mapping. Genetics 138: 963–971. Coimbra, M. R. M., K. Kobayashi, S. Koretsugu, O. Hasegawa, E. O’Hara et al., 2003 A genetic linkage map of the Japanese flounder, Paralichthys olivaceus. Aquaculture 220: 203–218. Evensen, Ø., K. E. Thorud and Y. A. Olsen, 1991 A morphological study of the gross and light microscopic lesions of infectious anaemia in Atlantic salmon (Salmo salar L.). Res. Vet. Sci. 51: 215–222. Falk, K., E. Namork, E. Rimstad, S. Mjaaland and B. H. Dannevig, 1997 Characterization of infectious salmon anaemia virus, an orthomyxo-like virus isolated from Atlantic salmon (Salmo salar L). J. Virol. 71: 9016–9023. Jackson, T. R., M. M. Ferguson, R. G. Danzmann, A. G. Fishback, P. E. Ihssen et al., 1998 Identification of two QTL influencing upper temperature tolerance in three rainbow trout (Oncorhynchus mykiss) half-sib families. Heredity 80: 143–151. Jones, C. J., K. J. Edwards, S. Castaglione, M. O. Winfield, F. Sala et al., 1997 Reproducibility testing of RAPD, AFLP and SSR markers in plants by a network of European laboratories. Mol. Breed. 3: 381–390. Kocher, T. D., W. D. Lee, H. Sobolewska, D. Penman and B. McAndrew, 1998 A genetic linkage map of a cichlid fish, the tilapia. Genetics 148: 1225–1232. Mullins, J. E., D. Groman and D. Wadowska, 1998 Infectious salmon anemia in salt water Atlantic salmon (Salmo salar L.) in New Brunswick, Canada. Bull. Eur. Assoc. Fish Pathol. 18: 110–114. Nichols, K. M., W. P. Young, R. G. Danzmann, B. D. Robison, C. Rexroad et al., 2003 A consolidated linkage map for rainbow trout (Oncorhynchus mykiss). Anim. Genet. 34: 102–115. Nylund, A., A. M. Kvenseth, B. Krossoy and K. Hodneland, 1997 Replication of the infectious salmon anaemia virus (ISAV) in rainbow trout Oncorhynchus mykiss (Walbaum). J. Fish Dis. 20: 275–279. Ozaki, A., T. Sakamoto, S. Khoo, K. Nakamura, M. R. M. Coimbra et al., 2001 Quantitative trait loci (QTLs) associated with resistance/susceptibility to infectious pancreatic necrosis virus (IPNV) in rainbow trout (Oncorhynchus mykiss). Mol. Genet. Genomics 265: 23–31. Piepho, H. P., and G. Koch, 2000 Codominant analysis of banding data from a dominant marker system by normal mixtures. Genetics 155: 1459–1468. Refstie, T., 1990 Application of breeding schemes. Aquaculture 85: 163–169. Rodger, H. D., T. Turnbull, F. Muir, S. Millar and R. H. Richards, 1998 Infectious salmon anemia (ISA) in the United Kingdom. Bull. Eur. Assoc. Fish Pathol. 18: 115–116. Sakamoto, T., R. G. Danzmann, K. Gharbi, P. Howard, A. Ozaki et al., 2000 A microsatellite linkage map of rainbow trout (Oncorhynchus mykiss) characterized by large sex-specific differences in recombination rates. Genetics 155: 1331–1345. Spielman, R. S., R. E. McGinnis and W. J. Ewens, 1993 Transmission test for linkage disequilibrium: the insulin gene region and insulin-dependent diabetes mellitus (IDDM). Am. J. Hum. Genet. 52: 506–516. Thorud, K., 1991 Infectious salmon anemia virus. Ph.D. Thesis, Norwegian College of Veterinary Medicine, Oslo. Thorud, K., and H. O. Djupvik, 1988 Infectious salmon anemia in Atlantic salmon (Salmo salar L.). Bull. Eur. Assoc. Fish Pathol. 8: 109–111. Vos, P., R. Hogers, M. Bleeker, M. Reijans, T. Van De Lee et al.,
858
T. Moen et al.
1995 AFLP: a new technique for DNA fingerprinting. Nucleic Acids Res. 23: 4407–4414. Waldbieser, G. C., B. G. Bosworth, D. J. Nonneman and W. R. Wolters, 2001 A microsatellite-based genetic linkage map for channel catfish, Ictalurus punctatus. Genetics 159: 727–734. Wright, J. E., K. Johnson, A. Hollister and B. May, 1983 Meiotic models to explain classical linkage, pseudolinkage, and chromo-
some pairing in tetraploid derivative salmonid genomes. Isozymes Curr. Top. Biol. Med. Res. 10: 239–260. Young, W. P., P. A. Wheeler, V. H. Coryell, P. Keim and G. H. Thorgaard, 1998 A detailed linkage map of rainbow trout produced using doubled haploids. Genetics 148: 839–850. Communicating editor: G. A. Churchill