10 9
A multivariate Denton method for benchmarking large data sets
Reinier Bikker, Jacco Daalmans and Nino Mushkudiani
The views expressed in this paper are those of the author(s) and do not necessarily reflect the policies of Statistics Netherlands
Discussion paper (10002)
Statistics Netherlands
The Hague/Heerlen, 2010
Explanation of symbols . * ** x – – 0 (0,0) blank 2008–2009 2008/2009 2008/’09 2006/’07–2008/’09
= data not available = provisional figure = revised provisional figure = publication prohibited (confidential figure) = nil or less than half of unit concerned = (between two figures) inclusive = less than half of unit concerned = not applicable = 2008 to 2009 inclusive = average of 2008 up to and including 2009 = crop year, financial year, school year etc. beginning in 2008 and ending in 2009 = crop year, financial year, etc. 2006/’07 to 2008/’09 inclusive
Due to rounding, some totals may not correspond with the sum of the separate figures.
Publisher Statistics Netherlands Henri Faasdreef 312 2492 JP The Hague Prepress Statistics Netherlands - Grafimedia Cover TelDesign, Rotterdam Information Telephone +31 88 570 70 70 Telefax +31 70 337 59 94 Via contact form: www.cbs.nl/information Where to order E-mail:
[email protected] Telefax +31 45 570 62 68 Internet www.cbs.nl
ISSN: 1572-0314
© Statistics Netherlands, The Hague/Heerlen, 2010. Reproduction is permitted. ‘Statistics Netherlands’ must be quoted as source.
6008310002 X-10
A Multivariate Denton method for benchmarking large data sets Reinier Bikker, Jacco Daalmans and Nino Mushkudiani Summary: Benchmarking is the process to achieve mathematical consistency between low-frequency (e.g. annual) and high-frequency (e.g. quarterly) data. Statistics Netherlands is going to apply a new benchmarking method on Dutch national accounts. The new benchmarking method is based on a multivariate Denton method, presented in Bikker and Buijtenhek (2006). In order to incorporate all economic relations into this model, we extended it with new methodological features, such as ratio constraints, soft constraints and inequality constraints. In this paper the new extended multivariate Denton method is presented. Furthermore, the results are described of a simulation experiment on Dutch supply and use tables. The size of these data sets is very large: it involves over 10,000 time series, which are related to each other via constraints. Before applying the benchmark method, the tables were cleaned from a few large discrepancies. The experiment was successful, indicating that the extended Denton method works well in practice on data that do not show large discrepancies. Keywords: Benchmarking, Data reconciliation, Denton method, National accounts
1. Introduction The problem that often arises while compiling national accounts is the inconsistency in the source data. For example quarterly data are usually inconsistent with annual data and economic rules that apply to one time period are violated. Macro-integration is the process for achieving consistency between economic data. The first step of macro-integration consists of correcting errors, in which the large obvious discrepancies are detected and corrected. The second step is a balancing process. In this step the tables are corrected so that the economic rules are being fulfilled. Balancing is also often called reconciliation. The literature on data reconciliation goes back to Stone et al. (1942), who presented a constrained, generalised least squares method. Several other balancing methods are described in Wroe et al. (2004, Annex A).
3
This paper focuses on a special case of the balancing problem, called benchmarking. This is the process to achieve consistency between data that are published at a high frequency and data that are published at a low frequency. Without loss of generality, it is assumed here that the time series are quarterly data and the benchmarks are annual figures. Typically, the annual data sources provide the most reliable information about overall levels and the quarterly data sources provide information about short-term changes. Most of the annual data are fixed due to this reason. The benchmarking methods can be broadly classified into purely numerical methods and model-based methods. Bloem et al. (2001, Chapter VI) and Dagum and Cholette (2006) give a comprehensive overview of methods. For the model-based approach we have regression models, for instance Cholette-Dagum (1994), ARIMA model-based methods proposed by Hillmer and Trabelsi (1987) and state space models defined by Durbin and Quenneville (1997). Closely related to the regression method is the method of Chow and Lin (1971), where the authors choose for the interpolation of time series, i.e. deriving quarterly data from annual data, although this is not a benchmarking method in the strict sense. The Chow and Lin method may suffer from step problems, i.e. large gaps between the fourth quarter of one year and the first quarter of the next year. A classical reference to a numerical method is Denton (1971). The Denton method is a quadratic programming method and was initially proposed for univariate data. The aim of this method is to make the quarterly data coherent with annual totals, while preserving all quarter-to-quarter changes as much as possible. This technique is called the movement preservation principle. Because of this property Denton method avoids the step problem. Di Fonzo and Marini (2003) have extended the Denton method for multivariate data. In addition to temporal alignment, multivariate data often also have to satisfy a set of contemporaneous constraints (i.e. restrictions between different time series in one time-period). Subsequently, Bikker and Buijtenhek (2006) have added reliability weights to the multivariate Denton method. Although it is mentioned by Bloem et al. (2001) that the Denton method is well suited for large scale applications, to the best knowledge of the authors, such applications have not been performed at NSI’s (National Statistical Institutes). The lack of adequate computer technology used to be an obstacle (Nicolardi, 2000). Statistics Netherlands is now implementing an extended version of the multivariate benchmarking method presented in this paper in its production process of national accounts. This application requires software that can cope with large data sets, namely over 10,000 time series. The software is based on a state-of-the-art, commercial quadratic programming (QP) solver. The Bureau of Economic Analysis (BEA) uses similar software for the implementation of a
4
reconciliation method (Chen, 2006), but their method is not aimed at benchmarking. In order to incorporate all economic relations to the model, that are specific for the national accounts, we added new methodological features to the multivariate Denton method of Bikker and Buijtenhek (2006). These involve: soft, ratio and inequality constraints. Magnus et al. (2000) already have incorporated these features, except inequality constraints, into a reconciliation method, which is not directly intended for benchmarking purposes. In the model presented in this paper we include all the rules that are specific for the National Accounts data, since our benchmarking model will be applied to Dutch supply and use tables. A simulation experiment was conducted at Statistics Netherlands on data of Dutch supply and use tables to find out whether all relevant economic constraints can be included in the model. The experiment was successful and as mentioned above Statistics Netherlands is in the process of implementing the method into its production system. Note that a few large discrepancies were removed from the data before applying the benchmarking method. In this paper we describe the extension of the multivariate Denton method and the results of the simulation exercise. This paper is organised as follows. In Section 2 the extended multivariate Denton model is presented. Section 3 deals with the software used to solve the model and describes the results of a simulation experiment. Section 4 concludes and gives an outlook on further research possibilities.
2. The model
2.1 The univariate model In this subsection we discuss the classical Denton method. The aim of this method is to find a benchmarked time series xˆ t , t = 1,…,T, that preserves as much as possible all quarter-to-quarter changes of the original quarterly time series xt , subject to annual benchmarks. Denton proposed several measures to define the quarter-to-quarter changes. We consider the additive first-order function and the proportional first-order function. The additive function keeps additive corrections ( xˆ t – xt ) as constant as possible over all periods. The proportional function is designed to preserve the (proportional) growth rates of xt and therefore keeps the relative corrections ( xˆ t – xt )/ xt as constant as possible over all periods. In mathematical terms: the objective function of the additive Denton model is:
5
T
min ) x
t =2
((xˆt − xt ) − (xˆt −1 − xt −1 ))2
(2.1)
and the objective function of the proportional Denton model is: T
min ) x
t =2
((xˆt
xt ) − ( xˆt −1 xt −1 )) , 2
(2.2)
the proportional model cannot be used if the original time series contains zeroes. Note that it would be more natural to consider the differences between the relative changes of the revised and preliminary series, i.e. to minimise the T
objective function
((xˆt
t =2
xˆt −1 ) − ( xt xt −1 )) . However this nonlinear form is 2
very difficult to handle for large problems, see e.g. Öhlén (2006). Both objective functions are subject to the following constraints t =4 ( a −1)+ 4
xˆ = ya ,
a = 1,…, T / 4,
t t = 4 ( a −1)+1
(2.3)
where a is an index of the year and ya is an annual value. The set of restrictions expresses the alignment of four quarters to annual totals.
2.2 The multivariate case The extension of the univariate Denton model to the multivariate case of Bikker and Buijtenhek (2006) is straightforward. In the extended model weights are introduced, in order to describe the reliability of the time series. The National Accounts uses a wide range of sources. Naturally, different time series are considered more or less reliable, depending on their source. Variances are often used in the literature in order to describe the data reliability. Since in practice it is almost impossible to estimate the variances, we define weights instead. Weights can be viewed as generalisations of variances, i.e. they are defined in such a way that variances can substitute the weights. Analogous to variances, the weights have to be strictly positive and satisfy the property that the higher the value, the more deviation is tolerated. The multivariate, additive model is given by N
T
1
Min xˆ
i =1 t = 2
(w )
N
A 2 it
T
such that i =1 t =1
((xˆit − xit ) − (xˆit −1 − xit −1 ))2
H crit xˆit = brH , r = 1, K, C H
6
(2.4)
(2.5)
where i is the index for the time series, N denotes the number of time series and witA denotes a reliability weight of the i’th time series at quarter t and A stands
for the additive model. The bigger is the values of the time series the higher its weight. How we define the weights will be described in detail in subsection 2.4. In (2.5) r is the index of the restrictions and C H is the number of restrictions. H Further crit and brH are coefficients of the restrictions. Amongst others, the
annual values, ya in (2.3), are included in brH . Here, superscript H stands for ‘hard’, it is used to distinguish the restrictions in (2.5) from the soft restrictions that will be introduced further on in this paper. The set of restrictions in (2.5) may involve both contemporary (i.e. between time series within one time period) and intertemporal (between different time periods, within one time series) restrictions. The extension for the proportional model is similar. In Bikker and Buijtenhek (2006) the proportional and the additive models are combined. The user has to specify beforehand for each time series whether the model is proportional or additive. 2.3 The extended model In this subsection we define the extended multivariate Denton method. The extensions include: soft constraints, fixed quarters, ratio constraints, and inequalities. All of these restrictions are defined specifically for national accounts data. At Statistics Netherlands a lot of subject matter knowledge is used in the reconciliation of national accounts. For instance: for some perishable goods the value of the change of stocks, summed over the four quarters of one year, should not differ much from zero. In order to include such knowledge into the model soft constraints are needed. A set of soft linear constraints is given by T
N
t =1 i =1
S crit xˆit ~ (brS , wrL ), r = 1,K, LS
(2.6)
where LS denotes the total number of linear constraints and brS is a target value. The superscript S denotes that the constraints are soft. Further, wrL is a reliability weight, where the superscript L indicates that the weight belongs to a linear constraint. Similar notation will be used throughout this section. We used this type of constraint to include soft annual totals in the model. The constraints (2.6) are included in the model by adding the following penalization terms to the objective function (2.4): LS
+ r =1
1
(w )
L 2 r
brS
−
T
2
N S crit xˆit
(2.7)
.
t =1 i =1
7
Although the Denton method focuses on the preservation of quarter-to-quarter, changes, in some cases it may be necessary to stick to a quarterly value, for instance if that value is already published. Then we include the following hard restriction in the model:
xˆit = xit .
(2.8)
Here xˆit are the fixed quarters. Likewise, a soft constraint is denoted by;
xˆit ~ ( xit , ( witF ) 2 ).
(2.9)
Soft constraints are incorporated in the model by adding the following term to the objective function (2.4) +
N
T
CitS i =1 t = 2
xˆit − xit witF
2
(2.10)
,
where CitS is an indicator function, that is defined by CitS :=
1
if a soft fixed quarter is defined on xit
0
otherwise.
(2.11)
Note that (2.10) is a special case of (2.7). Another important extension of the model is the ratio constraint. Many economic indicators can be denoted by ratios of national accounts variables. For example subject matter specialists may have prior expectations of the value of the ratio between value added and output of an industry. To describe these types of relations hard and soft ratio constraints are added to the model, that are given by R 2 xˆnt / xˆdt = vndt and xˆnt / xˆdt ~ (vndt , ( wndt ) ),
(2.12)
where xˆnt denotes the numerator time series at quarter t, xˆdt denotes the R denominator time series at quarter t, vndt is some predetermined value and wndt
denotes the weight of a ratio xˆnt / xˆdt . Since we are unable to implement ratio constraints in their original form, we linearise them first. Following the approach of Magnus et al. (2000), the ratios in (2.12) are linearised as R* 2 xˆnt − vndt xˆdt = 0 and xˆnt − vndt xˆdt ~ (0, ( wndt ) ).
(2.13)
Note that the first linearization is exact, but the second one is an approximation, R* which will be discussed in detail in section 2.4. Here, wndt denotes the weight R in (2.33). of a linearised ratio. The expression of it is derived from wndt
Soft linearised ratios are incorporated in the model, by adding the following term to the objective function 8
N
T
xˆnt
S Bndt
+
2
vndt xˆdt R* wndt
n, d 1 t 1
(2.14)
,
S is an indicator function, that is defined by where Bndt
S : Bndt
1
if a soft constraint is defined on the ratio of xnt and xdt
0
otherwise.
(2.15)
Note that, essentially, there is no difference between linear constraints and linearised ratio constraints. The reason for making the distinction in the model, is that for the linearised ratio constraints expressions for weights will be defined in a different way than for the linear constraints. Contrary to the weights of linear constraints, the weights of the linearised ratio constraints depend on the predetermined value, vndt , see subsection 2.4.2. Most economic variables cannot have negative signs. To incorporate this (and other) requirement(s) in the model inequality constraints are needed. A set of inequalities is given by N
T
arit xˆit
r 1,..., I H
zr
(2.16)
i 1 t 1
where IH denotes the number of inequality constraints. If we incorporate in (2.4) the terms defined in (2.7), (2.10) and (2.14), and add the constraints defined in (2.8), (2.13) and (2.16) to (2.5) then the complete, extended model is given by N
T
Min xˆ
xˆit xit
Ait
N
1 S br wrL
N
T
S crit xˆit
S Bndt
i 1 t 1
T
CitS i 1 t 2
T
xˆit xit witF
n,d 1 t 1
1 xˆit witP 1 xit
xˆnt vndt xˆdt R* wndt
xˆit 1 xit 1
2
(2.17)
2
,
N H crit xˆit
such that
t 1 i 1 H Bndt xˆnt
CitH xˆit N
2
T
i 1 t 2 2
T
N
1 Ait
witA 1
i 1 t 2
N
2
xˆit 1 xit 1
brH
vndt xˆdt
0
r 1,..., C H ;
(2.18)
n, d 1,..., N , t 1,..., T ;
(2.19)
xit
0
i 1,..., N , t 1,..., T ;
(2.20)
arit xˆit
zr
r 1,..., I H .
(2.21)
T
i 1 t 1
9
Here Ait is an indicator function, defined as follows: Ait :
1
if the additive model applies to time series i
0
if the proportional model applies to time series i
(2.22)
H S Further, Bndt and CitH are basically defined the same as Bndt and CitS , with
S H and CitH apply to hard constraints, where Bndt and CitS the difference that Bndt
are defined for soft constraints. The five terms in the function (2.17) denote: additive quarterly changes, proportional changes, (soft) linear constraints, (soft) ratio constraints and (soft) fixed quarters, respectively. The constraints (2.18)– (2.21) are: (hard) linear constraints, (hard) ratio constraints, (hard) fixed quarters and inequality constraints, respectively. As in Bikker and Buijtenhek (2006) we determine beforehand which model, additive or proportional, is applied to each time series. For the data we used in the simulation experiment the proportional model is preferred for most of the time-series. There are two exceptions: 1) If one of the quarterly values in absolute terms is less than some prespecified value. Since in our application the preliminary time-series are integer valued, when the initial values are small, relative changes are heavily influenced by the preceding rounding process and therefore it does not make sense to preserve them. Another reason for this exception is that the proportional model cannot be used for time-series that contain preliminary values of zero. 2) If a time-series has both positive and negative values. When the proportional model is used the time-series could be multiplied by some negative number. Thus, all positive numbers become negative and vice versa. In practise this is not the desired outcome. The problem, defined by (2.17)–(2.21) is a standard convex quadratic programming (QP) problem. The problem is well known in the literature, and many efficient solving techniques are available.
2.4 Weights In this subsection we define the weights used in (2.17) – (2.21). In the literature often variances are used instead. As mentioned in section 2.3, weights are used as a generalisation of variances. Therefore our definitions are chosen in such a way that they still remain valid if variances would substitute weights. In the first subsection 2.4.1 below we formulate three properties of the underlying model. The weights should be defined in such a way that these
10
properties remain true. In subsection 2.4.2 we propose expressions for weights that focus on these three properties. 2.4.1 Underlying model properties In the objective function of the aforementioned model several kind of weights are used (weights of additive and proportional changes, soft fixed quarters, soft ratio’s and soft, linear constraints). These weights have to be determined, so that the model meets certain properties, see Öhlén (2006). The first two properties defined here come from the literature, the last one we added ourselves. 1)
Invariance of input data (mentioned by Öhlén, 2006): If all input data are multiplied by the same nonnegative scalar, the outcomes must also be changed by this factor;
2)
Ratio symmetry (mentioned by Magnus and Danilov, 2008): The outcome will not change if a ratio in the benchmarking model is replaced by its reciproke, i.e. if the restriction x / y ~ (r, ( wxR/ y )2) is replaced by y / x ~ (1 / r, ( wyR/ x ) 2 );
3)
Invariance of model choice: For constant time series, i.e. xit = xi, the results of the additive and proportional model should be the same.
Note, that the third property trivially holds true in the univariate case. This property is imposed, for the purpose of combining the proportional and the additive model in a multivariate setting.
2.4.2 Expressions In this subsection expressions will be proposed for the weights of proportional and additive quarterly changes, fixed quarters, linear and ratio constraints. In Appendix A we show that the weights expressions defined in this subsection, satisfy the three properties from subsection 4.2.1. Keeping in mind that the expressions of the weights should be easy to use, we introduced tuning parameters that apply to a group of similar weights. For example these parameters are defined in such a way that all weights that are related to one time series can be adjusted, by changing the value of one parameter only. Finding the most appropriate values of these tuning parameters is a trial and error process that depends on the desired outcome of the model, which may be different from application to application. In our simulation study the weights for each time-series were defined globally by the subject specialist. They attached the weights to groups of time-series based on the reliability of the sources. Each time after we obtained the optimization results, the subject matter specialists viewed the results and tuned the weights. Due to the large
11
number of time-series and restrictions, optimization and tuning had to be performed in several iterations. For proportional quarter-to-quarter changes the squared weights are defined by
(w ) = β P 2 it
where
−2 J i
(2.23)
,
> 1 and J i ∈ Ζ
with J i ≤ K . The reason for choosing the form of
(2.23) is that positive values are guaranteed. In our simulation study K = 3, hence we defined seven levels for the weights. For each time series i the parameter J i is defined beforehand by subject matter specialist. For the time series obtained from the most reliable source J i = 3 and this means that the time series have the smallest weight. The optimal values for and Ji depend on the scaling of the variables in the problem. A computer cannot represent infinitely small differences between numbers. The smallest difference between two numbers that a computer can represent is about 10E-16. This limit implies certain bounds on and Ji.
( )
2
For time series with values in six digits the term witP xit2 in the objective function (2.17) will have more than 12 digits, while other time series may have small values and a small weight, leading to a term in the objective function that has 2-4 digits behind the decimal point. The values for and Ji should be chosen so that the number of significant digits in the values in the objective function in (2.17) does not exceed the maximum capacity of 16 digits. The values for and Ji can easily be determined in a simulation experiment. In our simulation we typically used between 1.5 and 2.0. The meaning of the parameters is as follows: determines the degree of variation of the weights and Ji describes the relative reliabilities of the different time series. These two parameters will appear in all other weights expressions as well. By changing the value of Ji all weights are adjusted that are related to the i’th time series, i.e. the weights of the quarterly changes, fixed quarters, and linear and ratio constraints in which the i’th time series appears. The expression of the weights of the quarterly changes of the additive model is:
(w )
A 2 it
= β − 2 J i xi , 2
(2.24)
where xi =
1 T
T
(2.25)
xit , t =1
which is the average of the absolute values of time series i over all quarters. This average value is replaced by some value close to 0, if it is below some threshold value, since weights cannot have a value of 0.
12
The expression (2.24) resembles expressions that are proposed by Beaulieu and Bartelsman (2004). The most important difference is that their definition 2
involves xit, where xi is used in our definition. Therefore, in our approach all weights of the quarterly changes of one time series are the same. The motivation for this principle is that the reconciliation adjustments of one time series will be as constant as possible over time, just as in the original univariate method of Denton (1971). We propose the following expression for the weights of fixed quarters
(w )
F 2 it
( )
= α F β − 2 Fit β − 2 J i xit2 , 2
(2.26)
The first component at the right-hand side, α F , describes the importance of the weight category “fixed quarter”, in comparison with the other weight categories, e.g. quarterly changes, linear and ratio constraints. By decreasing the value of α F , all fixed quarters are made more important simultaneously. In our experiment the value for α F was 1 and we did not see the necessity of adjusting this value. The second component β −2 Fit describes the relative importance of a specific fixed quarter, compared to all other fixed quarters. Analogous to Ji, it is assumed that Fit is an integer-valued variable, with Fit ≤ 3. The third component β −2 J i stands for the relative reliability of the time series that involves the fixed quarter. Finally, xit2 denotes the square of the target value of the fixed quarter. It is 2
replaced by some value close to 0, if xi is smaller than some prespecified value, because weights cannot be zero. The expression of the weight of linear constraints is
(w ) = (α ) β L 2 r
L 2
− 2 Lr
1
( )
T
N
2 crS t =1 i =1
(c ) β S 2 rit
−2 Ji
2
| xi | ,
(2.27)
where
(c )
S 2 r
=
N i =1
(c ) . S 2 ri
(2.28)
In (2.27) α L denotes the importance of the weight category “linear constraints”, in comparison with the other categories (quarterly changes, fixed quarters and ratio constraints). Note that the meaning of this component is similar to that of α F in (2.26) and here as well the value of α L in our experiment was 1, as was the value of α R introduced below. 13
Further, the parameter Lr describes the relative importance of the specific constraint r compared to the other linear constraints, which is similar to Fit in (2.26). Analogous to Ji and Fit, it is assumed that Lr ∈ Ζ with Lr ≤ 3. The expression (2.27) does not include two components that are similar to the third and fourth component of (2.26). The following term is used instead 1
( )
T
N
2 crS t =1 i =1
(c ) β S 2 rit
−2 J i
2
(2.29)
| xi | ,
i.e. a weighted average of β −2 J i | xi | , where β −2 J i quantifies the relative 2
2
reliability of the i’th time series and | xi | denotes the square of the average, absolute level of that time series. As before, this value is replaced by some value close to zero, if it is below some prespecified threshold value. The average in (2.29) is taken over all times-series that appear in the constraint S r. The weights are the squared coefficients crit of the constraint and the sum of
these coefficients is denoted by c rS , see (2.28). The expression for the weight of a linearised ratio constraint is
(w ) = (α ) β R* 2 rt
R 2
− 2 Rr
2 ~2 β − J β − J vndt xdt , d
n
(2.30)
xdt is defined below in (2.34). In (2.32) the expression (2.30) will be where ~
derived from the weight of a non-linearised ratio, which will be assumed to be
(w ) = (α ) β R 2 rt
R 2
− 2 Rr
2 β − J β − J vndt , d
n
(2.31)
The components of this weight are quite similar to the components that are mentioned before. The first component α R denotes the relative importance of the weight category “ratio”, compared to the other weight categories. The second component Rr describes the relative importance of ratio constraint r, compared to the other ratios. It will be assumed again that Rr is an integer-valued variable, whose values are centered around 0. The third component β − J d β − J n is the geometric mean of β −2 J d and β −2 J n . It stands for the relative reliability of the time series that appear in the denominator and numerator of the ratio constraint. Finally, the fourth 2 component vndt denotes the square of the target value of the ratio.
The relation between (2.30) and (2.31), the weights of a linearised and nonlinear ratio follows from the following
14
xˆnt − vndt xˆ − v xˆ xˆdt = nt R ndt dt . R wrt wrt xˆdt
(2.32)
In the left hand side of (2.32) stands the root of one term of the objective function, corresponding to a non-linearised ratio. The numerator of the right hand side of (2.32) describes a linearised ratio. By definition, the denominator of the right hand side is the weight of the linearised ratio. Thus, it follows that
wrtR* = wrtR xˆdt .
(2.33)
The expression (2.33) cannot be used in practice, because xˆdt denotes a variable, whose value is not known prior to the benchmarking. Therefore we replace xˆdt in (2.33) by ~ xdt =
2 1 vndt xnt , x + dt 2 2 1 + vndt 1 + vndt vndt
(2.34)
a weighted average of xdt and xnt vndt , as proposed by Magnus and Danilov (2008).
2.5 Example Let us consider a benchmarking problem, consisting of 12 quarters and two time series x1 and x2. Suppose initially, each quarterly value is 10 and the annual benchmarks are available for both time series. These are 50, 75 and 95 for the three consecutive years. These annual figures are the same for both time series. Now assume that the first annual alignment is binding, whereas the second and the third are not. This example is not very realistic, we intentionally choose for large discrepancies between the quarterly and annual data in order to illustrate more vividly how the benchmarking model works. Furthermore, there is one soft ratio constraint, defined by xˆ1t / xˆ2t ≈ 1.1
for t = 1,…,12.
(2.35)
and the proportional model will be used for both time series. Note that the soft, ratio constraint is inconsistent with the annual figures of both time series. The relative values of the weights of both model components determine their influence on the model outcome. The parameters of the weights are:
( )
1, α L = 2, Cr = 1, giving wrL
( )
9.502 and wrR*
2
2
( )
= 2, Ji = 0 (for all i and t), giving witP
2
=
= 100, α R = 1, Rr = 1 (for all r), giving ~ x2 =
= 27.31.
15
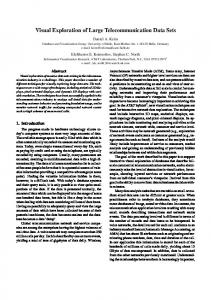
The results of the benchmarking method, depicted in figure 1, are two time series, whose values increase gradually over time. This increase is due to the connection to the annual benchmarks. Further note as a result of the ratio from the fifth quarter onwards xˆ1t increases more rapidly than xˆ2t . During the first four quarters, the influence of the ratio constraint is negligible, since the quarters of both time series have to strictly add up to the same annual values. In the second and third year the annual alignment is soft, and therefore the ratio constraint is more important than for the first year.
26 24 22 20 18 16 14 12 Time series 1 Time series 2
10 1
2
3
4
5
6
7
8
9
10
11
12
Figure 1. The benchmarked time series
Table 1 shows that the reconciled annual figures of the second and third year closely approximate their target values. Table 1. Annual figures (reconciled); Ji = 0 Year 1
Year 2
Year 3
Time Series 1 Time Series 2
50.00 50.00
77.16 72.32
97.61 91.42
Time Series 1 / Time Series 2
1.000
1.067
1.068
Suppose we raise the value of J1 from 0 to 1, and J2 is left untouched. As a consequence, time series 1 becomes more important compared to time series 2, amongst others, the annual alignment of time series 1 becomes more tight. Table 2 indeed shows that the reconciled, annual figures of time series 1 approximate their target values more closely, compared to Table 1, while the opposite holds true for the second time series.
16
Table 2. Annual figures (reconciled), J1 = 1 Year 1
Year 2
Year 3
Time Series 1 Time Series 2
50.00 50.00
75.81 70.72
95.88 89.37
Time Series 1 / Time Series 2
1.000
1.072
1.073
Furthermore, the ratio constraint becomes somewhat more important, compared to the case of the initial model parameters, since the weights of the ratio constraints are positively correlated to the average value of J1 and J2. This can be seen by comparing Table 2 with Table 1. The benchmarked value of the ratio approximates its target values of 1.1, more closely in table 2. For instance in the third year the ratio between the annual values of time series 1 and time series 2, is 1.068 in Table 1 and 1.073 in Table 2.
3. The application of the model
3.1 Software In order to be useful for practical implementation at Statistics Netherlands, the benchmarking software should be able to cope with very large data sets. Recently Eurostat developed ECOTRIM (Barcellan, 2004), a software tool which supplies several univariate and multivariate benchmarking and temporal disaggregation techniques, including the multivariate Denton method proposed by Di Fonzo and Marini (2003). Although ECOTRIM is a useful tool, it does not satisfy the requirements imposed by Statistics Netherlands for benchmarking national account data. The reasons for this are that ECOTRIM is not designed for dealing with thousands of time series, it does not include features like weights, ratio’s, soft constraints, and the possibility to combine the proportional and additive methods of benchmarking into one model. Statistics Netherlands has built a prototype of benchmarking software, using CPLEX (ILOG, 2008) as solver. This state-of-the-art, commercial optimization solver is able to cope with very large data sets. A benchmarking problem with 13.790 time series, each consisting of up to 3 annual, and 12 quarterly values, was translated into a quadratic optimization problem with approximately 160,000 free variables and 75,000 constraints. By using CPLEX on a PC with 2.00 GHZ, Xeon E5335 with 1024 MB Ram, the optimal solution was found in 45 seconds. However, in order to conduct the intended benchmarking of Dutch supply and use tables, an optimization problem should be solved, with approximately 500,000 free variables, 120,000 equality constraints, and about 300,000 inequalities for ensuring non-negativity. We also performed successful tests with the simulated data of these large sizes. However, to save time, the
17
constraints we used in these tests were slightly different than the ones of the supply and use tables. But we do not expect that these differences matter much. 3.2 A first simulation experiment A simulation experiment was conducted on Dutch supply and use tables of 2004-2006. The aim of the experiment was to find out whether all requirements of Statistics Netherlands can be incorporated in the model. There was no intention to obtain results that fully satisfy all economic relations. Thus, we did not use exactly the same data as in the reconciliation process of Statistics Netherlands, and we did not incorporate all relations among the variables of the model. For some classes of similar constraints we only worked out examples. An important feature of the supply and use tables is that they involve fixed price data and current price data. Both kinds of data were used in the experiment. By definition, ratios of current price values and fixed price values are price changes. The initial values of these price changes had to be preserved as much as possible. The initial model parameters (like weights and the choice whether a proportional or additive or fixed model should be applied to some time series) were determined by national account department. Parts of the supply and use tables were aggregated, to keep the model as small as possible. As stated before, this model still involves 13.790 time series. The outcomes of the model were reviewed by subject matter specialists. Their comments were translated into changes of the model set up, for instance different weights, other and / or more constraints. The results of this experiment are very good. All remarks of subject-matter specialists could be properly translated into changes of the model set-up. However, this was not always straightforward. The method proposed in this paper only allows for simple ratio constraints (like A / B v ), it is not possible to incorporate more complicated constraints, like A / B C / D or AB v, for instance the change of the trade margins should be approximately equal to the change of consumption. Therefore some ad-hoc solutions had to be implemented to include all relevant economic relations in the model. For instance: the preservation of the initial values of the ratio between trade margins and consumption for each quarter. Although only the most important economic relations were incorporated in the model, most of the outcomes closely resemble the published figures of the supply and use table: the difference was smaller than 0.3%-point for most of the main economic indicators. An explanation for this good result is that the initial discrepancies of most constraints were small. As the benchmark process starts with compiled systems of national accounts, there were no violations of the constraints within the quarters and years. The only discrepancies were between quarterly and annual
18
figures, but these were mainly small. However, in some exceptional cases the initial discrepancies of the constraints were large. The information on how to deal with these inconsistencies are not included in the model. Since large initial discrepancies in the data are rare, and the desired solution is different for each problem, it is not feasible to adapt the model for each case, beforehand. Instead, large discrepancies will be detected and reconciled by hand, before the Denton method is applied.
4. Conclusion Statistics Netherlands is planning to implement a multivariate Denton method in its production process for benchmarking national accounts data. The method that is intended to use was originally proposed by Bikker and Buijtenhek (2006). However to satisfy all requirements imposed by Statistics Netherlands this method had to be extended with ratio constraints, soft constraints, inequality constraints and fixed quarters. The extended method is formulated as an easily understandable quadratic programming problem. To apply this method to Dutch national accounts it is crucial that very large data sets can be handled, i.e. over 100,000 variables. Examples of such largescale applications of integration methods in the literature are rare. A simulation exercise, by using a state-of-the-art optimization solver like CPLEX showed that this is feasible. A simulation experiment was conducted to test whether it is possible to incorporate the constraints of the Dutch supply and use tables in the proposed model. Before applying the benchmark method, the tables were cleaned from a few large discrepancies that cannot be solved appropriately by using a mathematical model. The results were positive: comments of national account experts on the first results could be adequately translated into changes of the model. Also, the comparison of the results with published figures of Dutch national account does not show much (unexplainable) deviation. In 2009 final tests were carried out to prove that the intended benchmark process will lead to results that are fully acceptable for subject-matter specialists. Moreover simulation experiments are conducted on other parts of the national accounts than the supply and use tables, such as the sector accounts and the labour accounts. In the long term Statistics Netherlands is planning to integrate the benchmarking process of these accounts. Several methodological questions about the current Denton model are open for further research. These are: - Deeper understanding of the relations between expressions of the weights and the properties of the model;
19
- Rounding: the results of the benchmarking model have to be rounded to integer values. Currently, the rounding process is conducted after the benchmarking process. Both processes may be combined; - Non-linear constraints: An extension of the methodology for more complicated non-linear constraints (for instance A / B C / D or AB v) might improve the practical ability of the model.
Appendix A Proof of the properties of the model In Section 2.4 three desired properties of a benchmarking model are given. Here, we show that the model indeed satisfies the properties 1) invariance of input data, 2) symmetry of ratios and 3) invariance of model choice.
Invariance of input data Invariance of input data means that the multiplication of all input data by the same nonnegative scalar, leads to outcomes that are changed by the same factor. The model we propose satisfies this property, since multiplying each of the variables xit, xˆ it , brH , brS and z by a nonnegative scalar does not change the objective function and the constraints of the model. For instance for the part of the objective function that describes the additive mutations, it holds true that: N
T
(λxˆ it
β − 2 J i λx i2
i =1 t = 2 N
T
− λxˆ it −1 ) − (λxit − λx it −1 )
(xˆ it
− xˆ it −1 ) − (xit − xit −1 )
i =1 t = 2
2
=
(A.1)
2
.
β − 2 J i xi2
The reader can easily work out that the other parts of the model also satisfy this property.
Symmetry of ratios Symmetry of ratios means that it does not matter for the results whether a ratio is defined by xˆn / xˆd ≈ v,
(A.2)
or by its reciproke xˆd / xˆn ≈ 1 / v.
(A.3)
For convenience, some of the subscripts of xˆn , xˆ d and v are omitted. The corresponding terms in the objective function are:
20
xˆ n
xˆd
where
2
vxˆ d ~ vxd
and
2
1 xˆn v 1~ xn v
(A.5)
,
R 2
2
(A.4)
Jd
2 Rr
Jn
.
The property of symmetry is satisfied if (A.4) and (A.5) are the same. Below it will be shown that this holds true. Analogous to the definition (2.34) of ~ x d in (A.4), the definition of ~ x n in (A.5) is
~ xn
1 1 1 2 v
xn
1 v 2 vx , 1 d 1 2 v
(A.6)
The definition (A.6) is obtained from (2.34) by interchanging xn and xd. and replacing v by 1 / v, Note that ~ xn
v2 v
2
1
xn
1 v
2
1
vxd
v~ xd
(A.7)
By using this result, it follows that 1 xˆ d xˆ n v 1~ xn v
2
xˆ d
1 xˆ n v ~ xd
2
xˆn
vxˆ d ~ vxd
2
,
(A.8)
or equivalently that (A.4) is the same as (A.5), which finishes the proof that the symmetry of ratio property is fulfilled.
Invariance of model choice The invariance of model choice property means that the results of the additive model and the proportional model are the same for constant time series. Consider some time series i and suppose that its initial quarterly values are constant, i.e. xit = xi for all t, then one component of the objective function of the additive model can be rewritten by
21
(xˆit − xˆit −1 ) − (xit − xit −1 ) witA
2
=
xˆit xˆit −1 − xit xit −1
witA xit
2
,
(A.9)
and one component of the objective function of the proportional model is 2
xˆit xˆit −1 witP − xit xit −1
(A.10)
,
The invariance of model choice property is fulfilled, if (A.9) and (A.10) are the same. That is, if:
(w ) = (w P 2 it
A it
) ( 2
)
2
/ xit = witA / xi .
(A.11)
Since the expressions of the weights (2.23) and (2.24) meet (A.11), the model proposed in this paper satisfies the invariance of model choice property.
References Barcellan, R. (1994), ECOTRIM: a Program for Temporal Disaggregation of Time Series, Paper presented at the joint INSEE and Eurostat Quarterly National Accounts Workshop in Paris on December 5th and 6th, 1994. Beaulieu, J.J. and E.J. Bartelsman (2004), Integrating Expenditure and Income Data: What to Do with the Statistical Discrepancy? Finance and Economics Discussion Series 2004-39, Board of Governors of the Federal Reserve System (U.S.). Bikker, R.P. and S. Buijtenhek (2006), Alignment of Quarterly Sector Accounts to Annual Data, CBS Voorburg, http://www.cbs.nl/NR/rdonlyres/D918B487-45C7-4C3C-ACD0-oE1C86E6CAFA/0/Benchmarking_QSA.pdf Bloem A.M., R.J. Dippelsman and N.O. Maehle (2001), Quarterly National Accounts, Manual–Concepts, Data Sources and Compilation, IMF, Washington, D.C. Chen, W. (2006), Balanced System of Industry Accounts for the U.S. and Structural Distribution of Statistical Discrepancy, Paper presented at the NBER-CRIW Summer workshop, July 17 – 19 2006, Cambridge. Chow, G.C. and Lin, A.L. (1971), Best linear unbiased interpolation, distribution and extrapolation of time series by related series, The Review of Economics and Statistics, 53, 372-375. Cholette, P.A. and E.B. Dagum (1994), Benchmarking time series with autocorrelated survey errors. International Statistical Review, 62, 365377
22
Dagum E.B. and P.A. Cholette (2006), Benchmarking, Temporal Distribution and Reconciliation Methods for Time Series, Springer, New York. Denton F.T. (1971), Adjustment of monthly or quarterly series to annual totals: An Approach based on quadratic minimization, Journal of the American Statistical Association, 66 (333), 99-102. Di Fonzo, T. en M. Marini (2003), Benchmarking systems of seasonally adjusted time series according to Denton’s movement preservation principle. University of Padova, Working Paper 2003.09 http://www.oecd.org/dataoecd/59/19/21778574.pdf. Durbin, J. and B. Quenneville (1997). Benchmarking by state space models. International Statistical Review, 65, 23-48. Hillmer S. C. and A. Trabelsi (1987), Benchmarking of economic time series, Journal of the American Statistical Association, 82, 1064 – 1071. ILOG S.A., CPLEX 11.0 Reference manual and User’s Manual, 2008. Magnus, J.R., J.W. van Tongeren and A.F. de Vos, (2000), National Accounts Estimation Using Indicators Analysis, Review of Income and Wealth (46), pp. 329-350. Magnus, J.R. and D. Danilov, (2008), On the estimation of a large sparse Bayesian system: The Snaer program, Computational Statistics & Data Analysis, 52, pp. 4203-4224. Nicolardi, V., (2000), Balancing Large Accounting Systems: An Application to the 1992 Italian I-O Table, paper presented at the 13th International Conference on Input-Output Techniques, University of Macerata, Italy. Öhlén, S. (2006), Benchmarking and Seasonal Adjusment – A study of Swedish GDP – Statistics Sweden Stone, J.R.N., D.G. Champerowne and J.E. Meade, (1942), The Precision of National Income Estimates, Reviews of Economic Studies, vol. 9, pp. 111-135. Wroe, D., P. Kenny, U. Rizki and I. Weerakkody, (1998), Reliability and quality indicators for National Accounts Aggregates. ONS (London).
23