The Artificial Life and Adaptive Robotics Laboratory ALAR Technical Report Series
NCMAA: a Network Centric Multi-Agent Architecture for Modelling Complex Adaptive Systems Ang Yang, Neville J. Curtis, Hussein A. Abbass, Ruhul Sarker TR-ALAR-200605012
The Artificial Life and Adaptive Robotics Laboratory School of Information Technology and Electrical Engineering University of New South Wales Northcott Drive, Campbell, Canberra, ACT 2600 Australia Tel: +62 2 6268 8158 Fax:+61 2 6268 8581
NCMAA: a Network Centric Multi-Agent Architecture for Modelling Complex Adaptive Systems Ang Yang Defence and Security Applications Research Centre (DSA) University of New South Wales, Australian Defence Force Academy Canberra, ACT 2600, Australia. Email:
[email protected]
Neville J. Curtis Land Operation Division Defence Science & Technology Organisation Department of Defence Edinburgh, SA 5111, Australia Email:
[email protected]
Hussein A. Abbass, Ruhul Sarker Defence and Security Applications Research Centre (DSA) University of New South Wales, Australian Defence Force Academy Canberra, ACT 2600, Australia. Email:{h.abbass,r.sarker}@adfa.edu.au Abstract Complex adaptive systems (CAS) is the study of many nonlinearly interacting components, where the interaction is governed by simple rules, while the overall behavior of the system exhibits certain levels of complexity. Due to the high degree of nonlinear interactions between components within a CAS, agent based modelling has been widely adopted in the study of CAS. Existing agent based models fall into one of two categories, either a cognitive agent system, the scalability of which is fairly low because of the computational cost involved in inferencing on the agent level, or a reactive agent system, which scales well but understanding the system behavior has to be done off line. In addition, for both systems it is very hard to study the role of each interaction in the system. In this paper, we propose a novel Network Centric Multi-Agent Architecture (NCMAA), which is based purely on network theory, scales well, and provides a real-time reasoning engine. The advantages of the NCMAA are demonstrated by a real multi-agent distillation combat system, the version II of the Warfare Intelligent System for Dynamic Optimization of Missions (WISDOM), which is designed and developed on the NCMAA.
I. I NTRODUCTION Complex adaptive systems (CAS) is the study of many nonlinearly interacting components, where the interaction is governed by simple rules while the overall behavior of the system exhibits certain level of complexity. The research area encompasses many sub-fields such as adaptation: the study of how systems response to changes in the environment [1]–[4]; network theory: the study of how the network topology and properties influence the behavior that the network exhibits [5]–[8]; and emergence: the study of how global phenomena arise from the lower level interaction of the components [9]–[12]. All the discoveries in complex system theory are finding their ways to practitioners and real life applications. Due to the difficulty faced by pure analytical methods in analyzing the high degree of nonlinear interactions between components within a CAS, agent based modelling has been widely adopted to model, simulate and study CAS. However some limitations of existing multi-agent simulations have recently been identified, as follows.
It is hard to validate these systems because they are representation free [13]. • Reasoning during the simulation becomes difficult with increasing numbers of entities [13]. Cognitive agent systems [14]–[18] are able to reason about the actions taken by each entity in the system but unable to scale up to include many agents or account for the high degree of nonlinearity that is featured in most real life problems. On the other hand, pure reactive agent systems [19]–[21] can scale up well but it is hard to understand the behaviour exhibited by the system or validate it because there is no reasoning. • Ambiguity between agent-centric or organizational-centric [22] methods. Existing multi-agent systems (MAS) either focus on the model of individual agents with limited support on the interactions between agents such as GAIA [23], or concentrate on the model of the agent society by limiting the autonomous behaviors of a single agent, such as SODA [24] and ISLANDER [25]. • Lack of an explicit and auditable model of interaction. Existing systems always combine the entities (agents) and their interactions (relationships) in a single model. There is no distinction between the social value of an entity generated by its interactions with other entities, and the individual value generated by its own properties and capabilities [22]. It is important to have an explicit model of interaction to understand the group behaviors of agents. In order to address these problems, we propose a novel Network Centric Multi-Agent Architecture (NCMAA) in that it maps perceived reality to high resolution in the simulation while is still able to reason about the actions and the emergent behaviors in the system. The system provides a powerful real-time reasoning engine, which is built on network theory and causal models. It helps users to understand the dynamics and outcomes of the simulation by conducting inductive reasoning during the simulation. The method is based on sequential construction of the different elements into a useable model. The rest of the paper is organized as follows. The following section is a discussion on what kind of properties of a MAS are required to model and study CAS. Then three typical agent architectures are briefly reviewed and examined with the essential properties of MAS mentioned in this section. After that, the NCMAA is described in details, which includes three sections: the description of the NCMAA, the embedded real time reasoning engine and its developing procedure, followed by an implementation applied to study warfare, the version II of a promising multi-agent combat system called WISDOM (WISDOM–II). Conclusions are finally drawn. •
II. M ULTI - AGENT SYSTEMS FOR CAS MAS is the natural platform for studying CAS. The constituent parts are modelled as agents with a set of predefined characteristics. These agents adapt, evolve and co-evolve with their environment [26], [27]. By modelling an individual constituent of a CAS as an agent, we are able to simulate a real world system by an artificial world populated by interacting processes. It is particularly effective to represent the real world systems which are composed of a number of nonlinear interacting parts that have a large space of complex decisions and/or behaviors to choose from such as those situations in combat [28]. Therefore a good MAS should be able to model each property of a CAS, and at least have the following characteristics: 1) High scalability: Usually a CAS consists of many agents interacting with each other. For example, colonies are made of ants and brains are made of neurons. This normally requires agents to be designed on simple principles. 2) Heterogeneity: obviously a CAS is composed of a number of heterogeneous constituent, e.g. ecosystems. The diversity is essential to maintain an ecosystem. 3) Explicit model of interaction: within a CAS, the constituent parts interact with each other nonlinearly. The global behaviors emerge from these interactions. An explicit model of interaction could help us to study the role of each type of interactions within a CAS. 4) Reasoning on emergent behaviors: the aim of the study of a CAS is to understand when, why and how the emergent behaviors occur, and how they link to the simple local rules applied to each individual agent. 5) Rationality: the agent needs to take actions rationally in order to achieve its goals. 6) Adaptivity: the system should be able to improve its performance over time. For example, for a living organism, it may learn from experience and modify its behavior based on its perception of its environment.
7) Sociality: the overall pattern of a CAS is based on interactions among a group of agents. Therefore an organisation model is required. 8) Credibility: the overall MAS should be transparent in its construction and demonstrably “fit for purpose” in its applicability to understanding and design of a CAS. Currently most existing agent based models fall into one of two distinct schools [19], [21], [29]–[33], either a cognitive agent system or a reactive agent system. A. Cognitive agent architecture The cognitive agent can be seen as a knowledge based system, which includes all the necessary data and knowledge to make plans, to collect necessary resources, to respond to its environment and to interact with other agents by cooperating, communicating and negotiating in order to achieve its goals. Usually the cognitive agent is intentional, which means all actions are taken in order to achieve its goals; is rational, which means the actions it takes always follow a principle of rationality based on its goals; and has a representation, usually a logical representation of its environment, which is used to conduct reasoning. With its internal representation and reasoning mechanisms, the cognitive agent may function independently of other agents and fulfil relatively complicated tasks individually. These features make it more flexible in terms of its behaviors. Since it conducts reasoning based on its internal representation of the world, the cognitive agent is able to memorize and analyze its situations. Therefore the cognitive agent may predict the possible outcomes of its actions and then make plans for achieving its goals [30]. A typical example of the cognitive agent architecture is BDI (Belief-Desire-Intention) architecture [19]–[21], [31], [34]. The BDI architecture is established on the concept of practical reasoning, which includes two processes: deciding on what the agent needs to achieve and deciding on how to achieve it. Each agent has three key internal models: belief, desire and intention. The belief of an agent represents its knowledge of its environment and itself. As the environment changes, the agent attempts to accumulate experiences, checks the consistency of its beliefs with the accumulated experiences, and modifies its beliefs accordingly. Based on its current beliefs, the agent generates a number of options and selects one of them as its goal or desire. The agent then chooses one of the many possible paths to reach its goal or satisfy its desire. The path chosen by an agent represents its intention. The Procedural Reasoning System (PRS) [35], [36] is developed on the BDI architecture. PRS consists of four components connected by an interpreter which directs the process of acting, sensing and reasoning. The first component is the database of beliefs or facts about the world. It consists of the knowledge of the environment and the internal states of the agent. The second component is a set of desires, goals or tasks. It is represented as a series of behaviors the system might execute. The third component is a set of plans. They are pre-defined procedures to express the actions and test to achieve the goals or to react to stimulations. It also defines the way on how to manipulate the belief database to generate the next action or perhaps to produce new knowledge. The last component is a sequence of intentions. It specifies the current operating procedure and the series of procedures will be operated one after another. Through such architecture, PRS could conduct meta-level reasoning, e.g. how to select procedures from a set of procedures. BDI provides human-like reasoning processes. First it decides what to achieve, then selects a way from possible options and finally takes an action to achieve it. It is intuitive and easy to understand. However, to obtain a logical representation of a problem, two main issues arise [19], [32]: how to transfer a real world problem to a logical description and how to represent information of real world entities and processes in a logical format. Since any action is selected through a series of reasoning on the sophisticated representation about the world, scalability is an issue when working with BDI. In addition, Ramamohanarao [37] argued that current BDI models lack concurrent control, recoverability, and exception handling mechanisms. B. Reactive agent architecture The reactive school advocates that to exhibit the intelligent behaviors of a system does not require each agent within the system to be intelligent individually, i.e to have a representation about the world and a reasoning mechanism [30], [38]. The intelligence can be generated by the interactions between agents, and between agents and their environment where they are situated. The intelligent behaviors may emerge from a set of simple local
rules [39]–[41]. The reactive agent is directed either by its internal drives, such as the motivation mechanism which force it to accomplish some tasks (e.g. maintaining its energy level), or external stimulations based on which a set of rules the agent uses to make decisions. Unlike BDI agents, reactive agents do not have any representation of their environment and any reasoning mechanism. Instead they take actions based on stimulus received from the environment or other agents. Reactive agents do not make any plans, they make decisions according to the limited information available to each of them and the current status of their environment. Although each individual reactive agent is not intelligent as the cognitive agent, the power of reactive agents comes from their capacity to form a group and the capacity for adaption and evolution which emerges from their interactions. The intelligence in the reactive agent architecture is exhibited at the group level rather than the individual level, e.g. swarm intelligence of an ant colony. The reactive agent architecture is simple, economic, and robust, and can scale up well because there is no representation about the whole world and reasoning engine. The intelligence comes from a population of agents which allow the reactive agent architecture to exhibit high fault tolerance. In addition, since its action is selected purely based on sensing, the reactive agent reacts fast to changes in the environment. This feature makes the system agile. Furthermore, any action is taken based on current information because there is no need to store information. Thus, there is no problem associated with knowledge fusion. However, the lack of memory may make the reactive agent very hard to improve its performance over time [21], [31]. Without planing and inference mechanisms, the reactive agent does not necessarily reason about its actions and it is hard to understand the relationship among local behaviors, environment and global emerged behaviors [31]. Because they act upon the local information accessible to each of them, they may act unpredictably and sometimes the system can exhibit unstable behaviors [21]. Finally, the mechanism of selecting actions in the reactive agent architecture is predesigned by the developer. This limits the complexity of the problems which can be addressed by these systems [32]. The typical example of the reactive agent architecture is the subsumption agent architecture [42]. The subsumption architecture, proposed in 1986 by Brooks [42], breaks an agent into vertical modules, each of which is responsible for a limited type of behaviors. Each module is computationally simple and independent, and consists only of finite state machines. A finite state machine explicitly specifies the states the module can be in and also defines the output states that can be reached from a given state and the input to the machine. The modules function in parallel. The interaction between the modules are predefined, fixed and effected through a dominance relationship. If two modules are in conflict, the result from the dominated module will be ignored. Although they are extremely simple and without any explicit reasoning, the resulting systems still exhibit the intelligence and ability to accomplish the complicated tasks. Another example of the reactive agent architecture is Reynolds’s Boids model [43], a very famous artificial life model, which attempts to model flocking behavior in nature. There are only three very simple “steering rules” to control the behaviors of the agent (called boids) in the Boids model. • Separation: maintain certain distance with other local boids; • Alignment: move towards the average position of the local boids; • Cohesion: try to match velocity with the local boids. Although these three rules are very simple, the interactions between simple behaviors of individuals do produce complex organized group behavior, a believable flocking behavior. The model also demonstrates the unique property of complex systems that a complex system behavior can emerge from a set of local simple rules. C. Hybrid (layer) agent architecture Due to the limitations of both architectures, for most real world problems neither purely cognitive architecture nor purely reactive agent architecture is appropriate. Therefore, many researchers have been trying to develop a hybrid strategy, where a reactive system is designed with a cognitive planner. Usually, a hybrid architecture consist of two components: a cognitive part, containing a symbolic world model and reasoning engine, which develops plans and makes decisions; and a reactive part, which is able to react to stimulations from the environment [19]. Typically, hybrid systems are implemented with two or three layers in a hierarchy [19], [32]. The top layer is a traditional constructive planner and deals with the information at the high level of abstraction. It manipulates or generates the representation about the world, makes long term plans or deal with issues, such as cooperation,
TABLE I C OMPARISON AMONG AGENT ARCHITECTURES Essential characteristics Scalability Heterogeneity Explicit model of interaction Reasoning on emergent behaviors Reasoning on agent level Rationality Adaptivity Sociality
Cognitive low yes no no yes yes yes no
Reactive high yes no no no no yes no
Hybrid high yes no no yes yes yes no
NCMAA high yes yes yes no yes yes yes
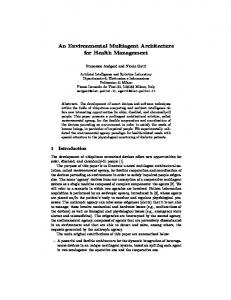
coordination and negotiation. It does not act directly on the behavior primitives. The bottom layer is a reactive actuator, which makes decisions directly based on its raw sensor inputs and a set of predefined rules. The middle layer has a kind of implicit knowledge, predefined plan fragments. It selects plans based on the current situation rather than make plans [32]. The example of hybrid architecture is 3T system [44], which includes three layers from bottom to top: skill manager, sequencer and planner. The bottom layer of skill managers is the reactive layer in the system, which includes a set of situated skills. Each skill is specified by the input, output, and when and how it functions. The role of reactive layer is to control real-time behavior. The task of the sequencer is to coordinate the skills and configure the skills for the current situation. The role of the sequencer is to control the order of real-time behaviors. The planner is the cognitive layer in the system, which makes plans at the highest level of abstraction. It searches a space of predefined plans and try to decompose a highly abstract goal into more detailed subgoals by using preconditions and effects. Although planning based on searching has been proven to be an unrealistic model of intelligence [45], 3T has been successfully used on numerous robots from academic mobile robot to robotic arms to deal with hazardous substances [32]. The multi-layer architecture has shown its capability for dealing with complex problems in real environments [32]. However it still has some problems such as how to optimize the planning mechanism for the top layer, and how to handle the interaction between layers, e.g. how to manipulate and exchange information between layers. Table I is a comparison among existing agent architectures and NCMAA based on the essential characteristics of a good MAS for CAS. All of existing three agent architectures have a limited capability to study the role of each interaction and to understand emergent behaviors and patterns. However, the proposed multi-agent architecture, NCMAA, could address these drawbacks. The architecture capitalizes on the large literature existing in the area of network theory. III. NCMAA: A NETWORK – CENTRIC MULTI – AGENT ARCHITECTURE The proposed NCMAA architecture is largely based on network theory. The system is designed on the concept of networks, where each operational entity in the system is either a network or a part of a network. The engine of the simulation is also designed around the concept of networks. Figure 1 depicts a coarse-grained view of the system. Each type of relationship between the agents forms a network. We distinguish between the static network, where the topology does not change during the course of the simulation, and a dynamic network, where the topology changes. The former can be the network of families, while the latter can be the communication network. It is important to emphasize that the definition of static or dynamic may vary from one application to another. The decisions of which actions should be taken by the agents are completely constrained by the state of networks and environment. The actions taken by the agents may trigger a change in agents’ states, environmental states, or simply the simulation clock advances. These triggers affect the dynamic relationships and the cycle continues. One needs to go through two stages to design a system based on the NCMAA: developing a causal network among concepts, and designing the finite state machine which will control the simulation oracle. In the NCMAA, a concept means a type of relationship between agents. The causal network is a directed graph of concepts defining the interdependency of concepts in the concept space. It provides the basis for establishing
Static Relationship
Dynamic Relationship
Form
Affect
Agents
Environment
Form
Feedback
Constrain
Relationships
Network
Constrain
Fig. 1.
Agent Actions
A coarse-grained view of the NCMAA
a meta-level reasoning system. A causal network usually has sources and sinks (showing the boundaries of the system being analyzed). The finite state machine is a collection of states, each representing the state of a network in the system. The finite state machine represents the sequence of executing each network in the system and the control of the system clock. The overall architecture of the NCMMA is a two–layer architecture (see Figure 2). In the top conceptual layer, the causal network defines the different types of relationships among agents in the system and how one type of relationship influences other types. The bottom implementation layer defines the instances of each concept defined in the causal network. For example, communication may appear as a node in the causal network. At the lower level, there can be many instances of communication such as p2p, broadcasting, etc. An agent can use both P2P and broadcasting to communicate with other agents. So each agent may participate in the different networks and play different roles in the system. Cb C
a
Cd
C
c
C
e
Conceptual layer
A type of relationship/concept
Cc1
Ca1
C b1
1
Ce
Agent
Cd1 Cc2
Cd2 Implementation layer
Fig. 2.
Ce 2
Instances of relationships
The two-layer architecture in the NCMAA
Each agent in the NCMAA is modelled by a series of states, triggers, actions and consequence. An agent state is defined by a series of properties which are problem specific. If an agent is in a certain state, the trigger is activated and an action is taken by the agent. It may lead to its own state changed, other agents’ states changed
or environmental states changed. Different actions may result in different consequences. Figure 3 shows a generic finite state machine for a network. Each network state includes agents’ states and environmental states. At time t, an agent selects and executes an action which causes a transition from one or more of the network states to another. A set of actions excuted by agents
S00t
New network state
...
Start
Sijt
t
S0nt
n2 Actio
Action3t
S10t
Actio nk- t 1 Ac tio nk t
S1nt
...
1 tion Ac t
...
Network state including agent state i and environment state j
... Smnt
System Clock (t=t+1)
END
Fig. 3.
Generic finite state machine in the NCMAA
The simulation engine in the NCMAA is depicted in Figure 4. First the system is initialized and the clock is set to zero. The initialization triggers some networks, agents sense their environment, recognize their internal states, and acts to cause a change in the system. The simulation cycles continue till termination occurs. The system terminates if either the maximum number of simulation time steps is reached or a pre-specified condition is satisfied. IV. C AUSAL M ODEL AND N ETWORK BASED ANALYSIS AND REASONING A. Causal model Causal knowledge is widely used to predict future events, to interpret the occurrence of present events, and to achieve objectives by taking actions. To obtain correct causal knowledge is not an easy task, e.g. how to distinguish the causal relations from spurious relations. Recent researches [46]–[48] show that causal-model theory [49] is a very complete approach to deal with this kind of problems. Causality is characterized by its structure and strength [50]. A causal structure concerns the qualitative causal relationships between two events while causal strength concerns the quantitative aspect of the causal relations. Conceptually the structure is more basic than the strength. One must know the existence of a link before estimating the strength of it. Otherwise, one may make wrong predictions, understandings and decisions. This is the reason why the NCMAA requires to build a causal structure (causal network) first based on prior domain knowledge about the causal status of relationships, which forms the direction of the causal arrow within causal models and then a series of covariation information is collected to estimate the strength of each causal relation [51]. The way of covariation measures are computed and interpreted is totally based on the causal structure. Formally a causal structure [49] of a set of variables V is a directed acyclic graph (DAG) where each vertex is corresponding to a distinct variables in V , and each link represents a direct functional relationship between two variables. It can also be represented by a set of structure equations: Ii = fi (Pi , ²i ),
i = 1, ..., n,
(1)
Start
Clock
Networka
Networkb
......
Networkc
Networkx
Networky
......
Networkz
Action
NetworkA
NetworkB
......
NetworkC
NetworkX
NetworkY
......
NetworkZ
end?
No
Yes
END
Fig. 4.
The simulation engine in the NCMAA
where Pi stands for the set of interactions judged to be immediate causes of Ii and the ²i represent errors due to some omitted factors. Equation 1 is a nonlinear formation of the linear structural equation models (SEM), a dominated tool used for causal analysis in economics and social sciences [49]. A causal model is defined as a pair of < D, ΦD > where D is a causal structure in the model and ΦD is a set of parameters compatible with D. The parameters ΦD develop a function of the equations defined in Equation 1 to each Ii ∈ V and a probability measure P (²i ) to each ²i . In the NCMAA, the causal network representing the causal structure is a DAG of a set of interactions (relationships) between agents. Each node in the causal network represents a type of interaction while each link represents how each type of interaction is influenced by any other type of interactions. After having the causal network which forms the top layer in the NCMAA, a series of statistical analysis could be conducted to collect covariation information from the bottom layer in the NCMAA to estimate the strength of each causal relationship. B. The Theoretical Framework 1) Granger causality: Granger causality was introduced by Granger [52] in 1969. It is a technique for determining causal relationships between variables and built on the assumption that the information for the prediction of the value of a variable is embedded only in the time series of the causal variables and itself. A time series xt grangercauses another time series yt if the future values of yt can be predicted by the values of xt . The idea is that the cause must appear before the effect is materialized. Thus if xt causes yt , then the values of xt must be helpful for forecasting the values of yt . Formally, Let xt and yt be two stationary processes, and E(yt+1 |Φt ) be the optimal (minimal mean squared error) predictor of the process yt . Then xt causes yt if E(yt+1 |(xt ∪ yt )) 6= E(yt+1 |xt )
and xt causes yt instantaneously if E(yt+1 |(xt+1 ∪ yt )) 6= E(yt+1 |xt+1 )
In practice, if the prediction error of the values of yt is reduced by including measurements of xt in the regression model, then xt is said to be able to causally influence yt . The standard Granger causality test usually involves a regression test as in Equation 2. yt =
k X i=1
αi yt−i +
k X
βj xt−j + Ut
(2)
j=1
Equation 2 suggests that the value of y at time t is a function of the past values of yt itself as well as of xt . Generally, if xt Granger causes yt , then any changes happening in yt should be after some changes occurring in xt . Therefore, if the prediction of yt can be significantly improved through a regression of yt on other variables, including its own past values and the past or lagged values of yt , then we can say that xt Granger causes yt . The tests of Granger-causality can also be based on a vector autoregressive model, a multivariate MA (Moving Average) representation or a regression of yt on xt ∪ yt . Please see Hamilton [53] for a review of such tests. Since Granger causality is based on correlation rather than causation, Granger causality can be led to a spurious correlation. However in the NCMAA, time series and correlation analysis are not conducted in an ad hoc manner. Instead such kind of analysis is totally based on pre-developed causal network. Therefore it may easily avoid spurious correlations and find the real causal relationships between variables. The Granger causality test has been widely used in different research fields, such as defence [54]–[56] and economics [57]. 2) Path analysis: Path analysis [58] is an extension of the regression model, used to validate the causal relationships between two or more variables. The model is usually presented as a graph where arrows indicate causal relations pointing from cause to effect. A regression is conducted between each dependent variable and its causes in the model. That is, the regression is done between every pair of variables which are connected by an arrow. The regression weights or path coefficient indicates the degree of the effect of a variable assumed to be a cause on another variable assumed to be an effect. Normally there are four steps for path analysis. 1) build a causal model (hypothesis) that all variables are causally connected. Variables that have no explicit causes are called exogenous variables while variables caused by other variables are called endogenous variables in the model. 2) select measures of these variables and translate the causal relationships to a series of structured equations. 3) calculate statistics, e.g. the path coefficient, to show the strength of relationship between each pair of causal variable and effect variable in the causal model; 4) interpret statistics to see if they support or repute the assumption in the causal model. The path coefficient used in the path analysis is a standardized regression coefficient, which represents the direct effect of an exogenous variable on an endogenous variable in the path model. Thus when there are two or more endogenous variables in the path model, the path coefficients are partial regression coefficients which measure the extent of effect of one variable on another in the path model. If in a path model, a variable is dependent only on a single exogenous variable, the path coefficient in this special case is a zero-order correlation coefficient. 3) Root cause analysis: Root cause analysis (RCA) [59], [60] is a methodology for discovering the underlying important reasons for performance problems. It is designed to help identify what, how and why an event occurred. Only when the underlying reasons why an event or failure happened are determined, the workable corrective countermeasures can then be established to prevent that event or failure from occurring again. RCA attempts to dig below the symptoms, and investigates the fundamental, underlying reasons (root causes) leading to the undesired consequences while troubleshooting and problem solving try to find immediate solutions to resolve the user visible symptoms. RCA traces the cause and effect trail from the end effect back to the root causes. To solve a problem, the best option is to kill its causes at the root. Rooney and Heuvel [60] proposed four steps to conduct RCA: 1) Data collection: all necessary data of describing the failure or event has to be collected; 2) Causal factor charting: It is a sequence diagram showing all direct and indirect the events leading to an occurrence and can be represented as a causal model discussed above; 3) Root cause identification: this is the key process in RCA. Based on the causal model or the causal factor charting, some analysis techniques, such as a decision diagram called the Root Cause Map, Granger causality test and correlation analysis, can be employed to identify the root causes.
4) Recommendation generation and implementation: the countermeasures are produced to prevent the failure from occurring again. Normally the root cause analysts do not implement these recommendations. Although it is often used to identify the causes of a problem or failure, it by no means can not be used to find the underlying reasons of an event if the event is seen as an undesired behavior. RCA provides critical information on what to change and how to change it. Therefore RCA may help improve the system performance and also may help attack the system. Currently it is widely used in manufacturing, construction, healthcare, transportation, chemical, networking, software engineering and power generation [61]–[73]. C. Network Based Analysis and Reasoning Dynamics and patterns of a complex network determine many features of complex systems. Analysis of these network measures may help analysts to understand how global organization and behavior emerges from local interactions, and then to plan or manipulate the behaviors emerging from the networks. There are various statistical or other analysis which can be applied to these network measures, such as time series analysis. The reasoning engine in the NCMAA operates on this analysis. The state xi of a system is often defined as follows [74]: xi+1 ≡ F (xi , i, ²i )
(3)
where the map F depends on the time index i and a sequence of independent random variables ²i . Under most circumstances, the evolution of x is Markovian [74], i.e the future state is totally depend on the current state and the earlier state is irrelevant. However, normally it is almost impossible to directly observe the state x. Instead what we can observe is a measure of y , which is generally a noisy, nonlinear function of the state x [74]: yi = f (xi , φi )
(4)
where φi is a sequence of measurement of noise. Unfortunately we usually do not know the observation function f and the state-dynamics function F . The goal of time series analysis is to make a reasonable guess about these functions so as to predict and better understand the evolution process of the state. Since raw time series data (y ) often contain noise and other obscuring factors, a common approach adopted to gain better understanding of the dynamics involving in the raw time series data is to extract features which fall into two categories - the time-domain which capture temporal properties and the frequency domain which capture the spectral properties [74]. Typically no single measure can fully describes a time-series. Therefore a set of measures are usually adopted. In order to conduct real-time analysis and reasoning during the simulation, we need to stream the data of network measures, performance measures or any other effect measures and feed them into a windowing engine which in turn produces a series of data frames with different window sizes. Analysis can then be done within a single data frame or between data frames. • Mean • Median • Mode • Variance • Correlation including auto-correlation • Linear distance • Auto-correlation distance D. Network theory Since each node in the causal network is a type of interaction between agents which is represented as a network or a set of networks at the bottom layer in the NCMAA, we may analyze these networks at the bottom layer by means of network theory to characterize or qualify each node. Network analysis techniques have been widely adopted to capture the dynamics, mechanism and patterns of complex systems across many disciplines of social science, economics, defence, biology and ecology. Network theory focuses on the relationships, structural or relational processes among social actors. It provides a number of network measures to characterize the structure or the
pattern of complex networks [5]–[8]. The following are three basic network measures to capture the structural characteristics of a network. • Average path length or mean geodesic distance: which can be used to evaluate the overall navigability of a network; • Degree or degree distribution: which can be used to estimate the connectivity of a network; • Clustering coefficient: which can be used to evaluate the transitivity of a network For other network measures, please refer to Wasserman et al. [5], Albert et al. [6] and Newman [7]. V. S YSTEM DEVELOPING PROCEDURE In practice, of course, the NCMAA is an architecture that allows and indeed encourages flexibility in the way in which the system is modelled and implemented. Implicit in this is the notion that any system description should balance, or at least acknowledge, the competing paradigms of “correctness” and “usefulness”. “Correctness” - based on an ontological premise of “the system is” is likely to produce overly complicated descriptions of systems that are not properly understood. This will especially be the case where humans are involved as in the military example given in this paper. The usual adage of the Operations Researcher (OR) then comes into play - we need “usefulness” through reasonable epistemological abstraction of how we see the system. Thus we should always consider that we are using NCMAA to learn about systems not for absolute truth. We propose a four phase, 12 step (see Figure 5) procedure to achieve this. After each phase or step, the developer may need to review current design and perhaps go back to a previous step again. System planning and specification phase Step 1: Determine requirements, goals and abstraction level Step 2: Specify system scope
System analysis phase Step 3: Analyze entity and process Step 4: Identify causal relationship
System design and modelling phase Step 5: Build causal network Step 6: Model agents and environment Step 7: Develop finite state machine Step 8: Identify interaction between networks Step 9: Develop network based analysis and reasoning engine Step 10: Design other features required, e.g. visualization
System implementation and testing phase Step 11: System implementation Step 12: Component and system testing
Fig. 5.
Generic procedures for developing a new application based on the NCMAA
A. System planning and specification phase (step 1 – 2) In the first phase the developer needs to establish a high-level view of the intended system which includes the goals, the level of abstraction and the requirements of the end-user. Then the developer needs to specify what kind of problem the system will deal with and the boundary of the problem. This is very much a creative phase and as such needs to be transparent to show the reasoning behind the formulation of the issues. In Operations Research terms, this phase relates to the formulation aspects of Ackoff “problems” or “messes” [75], [76]. Unlike “puzzles” that are usually unambiguous with clear objective functions, “problems” and “messes” tend to have degrees of
freedom in how they are approached. Thus the emphasis is on agreement with potential stakeholders on the validity of the model. There is a range of problem structuring methodologies that could be used in this phase (see [77]), and these are sometimes referred to as “soft OR” given that there are usually degrees of freedom available in how any problem may be tackled. As a simple list this formulation phase should include the context, an understanding of the processes involved in the system under study, the dynamic interactions, auditable option identification and viable measures [77]. Success in this phase requires both domain expertise in the processes involved and in the methods of formulation of the issues. B. System analysis phase (step 3 – 4) In this phase, the developer examines the system under study to derive an analytic formulation of the constituent processes. Thus models of the sequences of actions in the various processes are discovered, the entities involved and the data that describe their operation, the “concepts” (do P, by means of Q to achieve R [78]) of each action and the cause-and-effect relationship between the processes. Finally based on its goals and requirements in the previous phase, the scope of the system needs to be specified. That means to identify which problems can be addressed in the system. Again domain expertise and skills in soft OR need to be involved in this phase. A critical step to include is the notion that the analytical description still retains enough credibility as a system when the different processes are linked in a synthetic manner. In this phase, the developer analyzes the intended system to know how it runs, to determine the entities and processes involved, and to identify the concepts and the cause-and-effect relationship among them. Finally based on its goals and requirements in the previous phase, the scope of the system need to be specified. That means to identify which problems are to be addressed in the system. Both the previous phase and this phase need domain expert involved. C. System design and modelling phase (step 5 – 10) The next phase involves putting flesh on the abstract ideas determined in the previous two phases. This is very much an engineering activity and comprises an agent model, an environment model, a network model and a reasoning model for each process and the overall interactions. A first cut verification examination needs to be done at this phase - does the coding adequately represent what occurs in the system [79]? If difficulties in representation occur, then it might be appropriate to return to phase 2 to determine what can be investigated. D. System implementation and testing phase (step 11 – 12) At this phase, the developer adopts a proper programming language and software engineering techniques to implement the system. Although an object-orientation language is not required, it is preferable by its nature. According to the results from the design, the developer needs to identify classes including attributes, methods, events and exception handling, components and subsystems. Three major aspects are very crucial and needed to be well addressed: control structure, algorithm and data structure [80]. Another important task in this phase is to test the system. The testing procedure includes validation and a detailed verification process. Verification is the process of determining whether a model is accurately implemented according to the system description and specifications [79]. Validation is the process of determining whether the model is accurately representing the real world from the perspective of the end-user of the model [79]. There exists a number of models for validation and verification [79], [81]–[84]. One example is the model proposed by Sargent [82]. Sargent’s approach consists of four components (see figure 6): conceptual model validity, which is integrated into the system planning and specification phase, system analysis phase and system design and modelling phase, computerized model verification, which is integrated into the system implementation step, operational validity, which is integrated into the system testing step, and data validity, which is used for all phases. VI. WISDOM–II: A MULTI - AGENT SIMULATION SYSTEM FOR WARFARE Since no single test can be conducted to completely verify a multi-agent architecture [85], a real multi-agent system, WISDOM–II, the version II of the Warfare Intelligent System for Dynamical Optimization of Missions [13], [86], [87], is developed and used to demonstrate the usage and advantages of the NCMAA.
Computerized Model
Te sti n
Operational validity
g
Problem Domain
Data Validity
Implementation
Planning, analysis, design
Conceptual model validity
Conceptual Model
Computerized model verification
Fig. 6.
Sargent’s validation and verification approach [82]
Based on interpreting warfare as a complex adaptive system [27], [28], [88]–[90], a number of reactive agent based distillation systems have been developed. These include the Irreducible Semi-Autonomous Adaptive Combat (ISAAC) [28], [88] and the Enhanced ISAAC Neural Simulation Toolkit (EINSTein) [28], [90] from the US Marine Corps Combat Development Command, the Map Aware Non-uniform Automata (MANA) [27], [91]–[93] from New Zealand’s Defence Technology Agency, BactoWars [94] from the Defence Science and Technology Organisation (DSTO), Australia, the Conceptual Research Oriented Combat Agent Distillation Implemented in the Littoral Environment (CROCADILE) [95] and the Warfare Intelligent System for Dynamic Optimization of Missions (WISDOM) (version I) developed at the University of New South Wales at the Australian Defence Force Academy (UNSW@ADFA) [87]. These systems facilitate the analysis and understanding of land combat. They offer an opportunity to exhibit the behaviours that we would intuitively expect in the battle field. Through the use of these abstractions, people are able to gain understanding of the dynamics of battle, the effect of changes (both in fundamental properties such as effective range and in BDI terms) and the in tactics (leading to concepts) such as information collection versus engagement [100]. From an analysts point of view they allow rapid examination of a very large environmental space leading to identification of high and low points and areas of instability. However, all these combat systems are based on the reactive agent architecture and lack reasoning. Accordingly, we developed WISDOM–II [13] based on the NCMAA. A. System development Step 1: Determine system goals, requirements and abstraction level a) The goals: WISDOM-II attempts to be a decision making aid for defence analysts to explore a large parameter space, to conduct scenario analysis and planning, and to answer “what if” questions that allow investigation of concepts and development of capability options in a short period of time. Like other existing combat distillation systems, WISDOM-II is a complement to the very high-detailed simulation systems, which do not allow for the examination of a very large mount of possibilities and outcomes because of their very high fidelity. b) The requirements: In order to achieve its goals, WISDOM-II should: • represent the system under study in a credible and useful manner; • be able to rapidly modify entity characteristics and behaviors: this may allow defence analysts to study the effect of the characteristics of entities on the force performance and allow different options to be examined; • be able to capture emergent behaviors: the process in combat should be driven by a set of simple rules and some “surprises” may come out from them. Then defence analysts may backtrack to see how these new behaviors emerge; • be able to interpret the simulation outcomes; • be able to generate data based on meaningful metrics for military analysis;
amenable to rapid, repeatable concept exploration; • be simple to use; and • be extendable to a range of scenarios. c) The level of abstraction: Since WISDOM-II is an exploration tool for concepts, doctrine, and capability requirements in military operations, it has to be a high abstract conceptual model of combat. Like existing ABDs, WISDOM-II is a low fidelity, effect-based simulation system, which only models the essential conceptual entities and processes without touching on any detailed physics of combat. The outcomes of the simulations may guide further analysis with other high fidelity models. •
Step 2: Specify system scope There are three levels of military operations: strategic, operational and tactical [96]. • Strategic level: Activities at this level usually include the development of national and multinational military objectives, and development of global plans or theater war plans to achieve these objectives; • Operational level: Activities at this level connect tactics and strategy by developing operational objectives needed to accomplish the strategic objectives. The logistic and administrative support are at this level. • Tactical level: Activities at this level attempt to win a small-scale conflict by focusing on the ordered arrangement and maneuver of combat elements. WISDOM-II mainly explores the problem space at the tactical level. Each simulated team/force in the system has a predefined goal and tries to achieve it. WISDOM-II is designed for land combat because of its complex environment, although abstract aircrafts and maritime vessels can be modelled in the system. Since it is a conceptual model, there is no physics modelled in the system and use 2-D environment without elevation input. Step 3: Analyze entity and process In traditional analysis of combat, normally there are two forces playing against each other. In our model of the system we propose that for each side there is a dominant command and control (C2) structure that uses vision and communication networks that create a situation awareness network, that may in turn direct the engagement network. Figure 8 depicts the C2 hierarchy in WISDOM-II. Each force may have several teams, each of which may include several groups. Each group may have a number of agents with different characteristics. We first introduce heterogeneous agents at the group level in WISDOM-II. Each team has a mission to achieve. The high level commander may send commands to a low level combatant based on its situation awareness and the mission of that combatant. Each agent will follow OODA (Observe-Orient-Decide-Act) loop model introduced by Coram [97]. • Observe: Scan the environment and collect information from it, including communicating with other agents. In WISDOM-II, each agent has sensors and communication channels it can use. At each time step, the agent scans the environment and communicate with other agents from same team. The details of the sensor and communication model will be discussed later. • Orient: Build up its situation awareness based on information collected. As more information is collected, the agent modifies its situation awareness. This is the process to transfer data into information and then into knowledge. In WISDOM-II at each time step, each agent fuses the information via sensor and communication with the old situation awareness and construct its new situation awareness. WISDOM-II firstly introduces the situation awareness at the agent level. • Decide: Consider options and select actions. For a combatant, it needs to decide whether it needs to fire at its enemy, which enemy it will fire at and which direction it will move to. For a commander, it needs to make plans to achieve the mission and send commands to the low level agents. WISDOM-II adopts a heuristic model to make firing decisions. The enemy with short distance has high probability to be fired at. Two decision making mechanisms [13] are used in WISDOM-II to make plans for commanders and movement decisions for combatants. • Act: Execute the chosen actions. The position of agents and status of networks are updated to reflect the results of actions.
The simulation runs as depicted in Figure 7. The system first initializes agents, networks and environment based on the scenario definition XML input file. Then the agents scan their environment and the system updates the vision network. Based on the vision network and C2 network, the agents communicate with all possible friends and the communication networks are updated. The updated vision and communication network then construct the new situation awareness network. After that, the agents make decisions, e.g. fire at their enemy, move to new place or stay at current place, according to their missions and situation awareness. Finally the system updates the C2 network since the agent may die. Initializing agents, networks and environment
Agent scanning environment
Updating the communication Network
Agent communicating with friends
Updating vision network
Updating the s ituation Awareness Network
Go to Hospital
Treated in Hospital
Start
Yes No
Yes Has hospital?
Wounded?
Recovered?
No
No
Yes
Yes Firing?
Back to field
Updating agent health
No No Agent die? Yes
Remove dead agents
Moving?
No
Yes
Remove collision
Collision?
No
Updating agent position
Updating the command & Control network
No Finish? Yes END.
Fig. 7.
The simulation process
Of course in modern conflict there may well be other players present. For instance civilians or aid agencies (that may be termed “white”) may be involved. Additionally, coalition forces may become prevalent with different shades of “blue” present in the play-box. Step 4: Identify causal relationships Obviously the C2 process is the core in any combat. It is perhaps pertinent to note that this may not be the same as formal structure (“wiring diagram”) but the process model is the preferred approach. It determines which agents can and do communicate with each other. We assume that two agents from the same team can communicate if they can see each other. Both vision and communication construct the situation awareness. Based on their situation awareness and the objective of their missions, the agents decide on what to do in terms of movement, information collection, resupply or engagement. d) The Command and Control (C2) network: It defines the command and control hierarchy within one force. Since the commands can only be sent from the agents at the higher level to the agents at the lower level, the C2 network is a directed graph. Commander
............
Team Leader
Swarm Leader
Combatant
Fig. 8.
The command and control hierarchy in WISDOM-II
e) The vision network: If agent A can see agent B , then there is a link from Agent A to Agent B . The vision network is also a directed graph. f) The communication network: These communication networks could carry two types of information: situation information and commands. In a traditional force, the situation information typically flows from an agent to other agents in the communication channel, from the swarm leader to the team leader and from the team leader to the commander. In a networked force, the situation information flows directly from the agent to its commander. In both the traditional force and the networked force, a common operating picture (COP) is developed at the headquarter based on a fusion of the collected information. Based on the COP the commander makes decisions for each group in the battlefield and sends commands to the team leader, then the team leader sends commands to the swarm leaders. However, in a networked force, all agents in the battlefield can access the COP through the communication channel. Therefore each agent has a global view of the battlefield while in a traditional force, each agent only has its own local view of the battlefield. Since we use network to model communication, it is easy for WISDOM-II to support various types of communications: Point to Point directly (P2Pdirect), Point to Point indirectly (P2Pindirect) and Broadcast (BC). Because the information flows from source to sink, the communication network is obviously a directed graph. g) The situation awareness network: It defines current knowledge about the friends and enemies through vision and communication. We fuse the information collected by vision and communication and then develop this network. Since both vision and communication are direction dependent, the information fusion network is a directed graph too.
h) The engagement network: It defines the agents being fired at based on the firing agent’s current knowledge about its enemies and friends. This network is also a directed graph. Agents may die through firing, therefore the engagement network cause changes in the C2 network in the next time step. Step 5: Build causal network From the above analysis, five concepts (relationships) have been extracted: command and control, vision, communication, situation awareness and engagement. Based on their causal relationships, the causal network, the top layer in the NCMAA is depicted in figure 9.
Command & Control Network
Vision Network
Communication Network
Situation Awareness Network
Engagement Network
Fig. 9.
The causal network for WISDOM-II
Step 6: Model agents and environment Four types of agents are supported in WISDOM-II: combatant agent, swarm leader, team leader and commander. Both team leader and commander are virtual agents which exist in the force headquarters. They only have one capability: communication. Basically each combatant agent and swarm leader has five characteristic groups: health, vision, communication, movement and engagement. The health defines the level of energy for an agent. With user defined wounded threshold and immobile threshold, each agent may have four health status: healthy, wounded, immobile, and dead (figure 10). If an agent is wounded, it can go back to its team’s hospital for treatment [13]. This feature is first introduced in WISDOM-II to model recovery. (Wounded]
(Immobile] Dead
Immobile threshold
Fig. 10.
(Healthy]
Wounded threshold
Full health
Agent health status
Each combatant agent has its own sensor which is defined by the sensor range and detection. The detection defines what kind of agents can be detected by using this sensor. If the detection of agent A is equal to or larger than the invisibility of agent B and Agent B is within Agent A’s sensor range, then agent A may detect agent B . The value of detection should be between (0, 1], with 1 representing able to detect all. Combatant agents can communicate with other agents linked directly to them through the communication network. This communication occurs through a communication channel, which is modelled by the noise level, reliability, latency and communication range. The agent may only communicate with the agents within the range of that communication channel. We also adopted a probabilistic model to implement the noise level and reliability of a communication channel. Each communication channel has two probabilities corresponding to the noise level and
reliability. At each time step the message can only be transferred from one agent to another agent. The message will permanently be lost if it is older than a number of time steps predefined by the user. The movement of an agent is determined by its speed and personality. WISDOM-II supports four kinds of speeds: still, low speed, medium speed and high speed. Agents with high speed can move one cell per time step. The low speed is one third of the high speed while the medium speed is half of the high speed. The movement algorithm is based on the tactical decision making and strategic decision making mechanism. The strategic decision making mechanism provides a guide to each group at the macro level while the tactical decision making mechanism is based on the agent personality to determine which cell the agent should move to. For the details of the movement algorithm, please refer to Yang et al [13]. Engagement in WISDOM-II is determined by what kind of weapon the agent uses. The weapon is defined by the weapon power, fire range and damage radius. Based on the damage radius, two types of weapons are supported in WISDOM: point weapon, the damage radius of which is zero, and explosive weapon, the damage radius of which is larger than zero. WISDOM-II also supports direct and indirect fire. The indirect fire can fly over obstacles. Status of each combatant agent and swarm leader are defined by their health level and position. There are four actions available to each combatant and swarm leader. 1) scanning the environment, which may change the status of vision, communication and situation awareness network; 2) communicating, which may change the status of the communication and situation awareness network; 3) movement, which may change the status of the vision network, the communication network, the situation awareness network, and the position status of agents; 4) firing, which may change the status of the engagement network, the C2 network, and the health status of agents. There are two decision making mechanisms: tactical, which is used for each combatant and swarm leader to decide which direction it should move to, and strategic, which is used for the commander to make plans for each group [13]. WISDOM-II adopts 2-dimension environment and supports impassable objects. Agents cannot see or travel through impassable blocks. With the indirect weapon, the agent can shoot its enemies over them. Step 7: Develop finite state machine Each of the conceptual networks may have one or more instances defined for the blue and/or red agents. There are seven instances of networks defined in WISDOM-II (see Figure 11). Since different forces have different C2 structures and communication can only occur within the same force, there are two instances of the C2 network and two instances of the communication network, one for the blue force and one for the red force, while there is only one instance for each other network in WISDOM–II. The state of each network is determine by the state of agents within the network and the network structure. The structure of both blue and red C2 network is changed only when some agents die and are removed from the network. The movement action may influence the state of vision and communication network. In turn it will change the state of the situation awareness network. Obviously, the firing action influences the state of the engagement network. Step 8: Identify interaction between networks Based on the causal network, these instance networks with their interactions make up the bottom layer of the NCMAA (figure 11). This is the basis of Granger causality for conducting the network based causal reasoning using path analysis and root cause analysis in WISDOM-II. Step 9: Develop network based analysis and reasoning engine Recently the defence analysts have realized that network analysis [98]–[100] and causal model (influence diagram) [101] are two valuable tools in military analysis. The properties of the networks, such as communication network,
Blue C2 Network
Red C2 Network
Vision Network
Blue Communication Network
Red Communication Network
Situation Awareness Network
Engagement Network
Fig. 11.
The bottom layer of the NCMAA in WISDOM-II
and command and control network, may largely affect the outcome of military operations. This has attracted attention from researchers and military analysts. For example, Dekker analysed the effect of network topology on the military performance [98], classified the architecture of network centric warfare based on network measures [102] and evaluated the robustness of military critical infrastructure networks [99]. Xu [100], [103] applied network theory into analysis of terrorism. The real-time reasoning engine in WISDOM–II is based on the properties of the networks in military operations, through a series of causal reasoning, time series analysis on these network, military performance measures to allow defence analysts to understand the dynamics and capture the embedded patterns during the simulation. The architecture of the NCMAA facilitates real-time reasoning during the simulation as follows: • The first step is to establish a causal network as the basis for cause-and-effect relationships. We use a domain expert to establish this causal network (see figure 9); • Second, some performance measures, such as casuality, loss exchange ratio, etc, and all meaningful network measures, which can be interpreted in the military domain, e.g. the average shortest path length of the C2 network can be interpreted as a measure of the speed of command, are calculated at each simulation time step, and streamed and fed into a set of moving windows with different user predefined size; • Then we conduct correlation analysis among these windowed time series data based on the causal network; • Finally a natural language processing center interprets these results and presents them in a natural language format which may be easily understood by the user. If we imagine that the simulation is at time step t, a window of length w is established to extract the time series between t − w and t. The network and performance measures are calculated. Examples of these measures include: the damage (casualty) of the blue and red force, and average degree, average shortest path length and the clustering coefficient of each C2 network, communication network, vision network and engagement network, over time. Within a window W , the correlation coefficient is calculated between all possible influenced time series according to the cause-and-effect relationships defined by the causal network (figure 9), e.g. calculate the correlation coefficient between the average degree of the communication network and the force casualty. The information is then filtered using a thresholding mechanism. Those measures above a certain threshold predefined by the user are sent to the natural language engine. The natural language engine is responsible for forming sentences written in plain English to explain the dynamics of the simulation to the user. Figure 12 and 13 are two examples of the correlation analysis between the force damage and the structure of the network. Figure 12 is the correlation coefficient between the red damage and the blue communication network measures over time while Figure 13 is the correlation coefficient between the blue damage and the red communication network measures. Both examples use the window size of 5 and the threshold of 0.5. At the points above 0.5, we may think that the communication activity is probably the key reason leading to the damage of their enemy during the last 5 time steps. Therefore based on the correlation coefficient, the nature language processing center may present its interpretation to the user as: “The damage of the red force during time steps 53 to 58 is probably caused by the communication activities within the blue team”. Following are some examples of interpretation in natural language.
1
0.5
0.5
Correlation Coefficient
Correlation Coefficient
1
0
−0.5
0
−0.5
Average degree
Average degree
Avearge path length −1 25
30
35
40
Avearge path length 45
50
55
60
−1 25
65
Time step
Fig. 12. The correlation coefficient between the red damage and the blue communication network measures.
30
35
40
45
50
55
60
65
Time step
Fig. 13. The correlation coefficient between the blue damage and the red communication network measures.
1) 2) 3) 4) 5)
The red team caused more damage to the blue team. The damage ratio is 1:2. With no loss, the blue team causes damage of 16 health points to the red force. An order has been sent to the leader of group j in the blue team to move toward (35, 25). The agents in the blue team are coordinating their firing to achieve maximum damage in the red team. An average damage of 4 occurred in the red team over the last 5 time steps is properly caused by the activities in the communication network of the blue team and the blue force’s situation awareness of enemy on force level. The first two sentences explain what is happening on the battlefield to users. The third sentence allows for the prediction of system behaviors. The group will move to that position after this time step because it receives the order from its commander. The 4th sentence shows how it happens. In order to maximize the red damage, the blue agents coordinate their firing. The last sentence explains why it happens. The reason of the red damage is because of both improved situation awareness and effective communication of the blue agents in the last 5 time steps. Step 10: Design other features required, e.g. visualization One drawback of existing agent based warfare simulation systems is that they only provide limited information to the analysts during the simulations [13]. WISDOM–II fills this gap. Beside visualizing the information of each single agent, WISDOM–II also visualizes each network and all possible network measures spatially and temporally. By spatially visualizing each network, WISDOM–II provides a graphic view for each type of interactions between agents. It offers a window for the user to know what kind of interaction occurs between agents and to identify the role of each interaction during the simulations. By temporally visualizing the network measures, WISDOM–II presents a time series dynamics of each interaction with the system. It may help analysts to predict and analyze the outcome of the simulated war. Temporally and spatially visualizing each network and its measures makes it possible to validate and verify the system itself. If something happens, it will immediately be reflected on the visualization. The developer or the user can then identify and capture it quickly. Figure 14 presents two examples of spatial visualization of the communication and vision network. Assume the communication network is initialized as a complete network, i.e. every agent connects to each of the others. If there is no link between some agents, the user may easily identify there is something wrong. Figure 15 are some examples of temporal visualizations of network measures, force performance measures and the spatial entropy, which is a measure of the degree of clustering of a force on the battlefield [104]. With these graphs, the analysts may easily capture the dynamics of the communication and vision
Fig. 14.
Examples of spatial visualizations
network, and the force performance during the simulation. Before the time step of 43, the changing trend of both blue and red communication network is similar. The changing trend of the force damage for both teams is also similar. However, the average degree of the blue communication network is higher than that of the red communication network. It may be the reason that the red damage is slightly higher than the blue damage. After that, the average degree of the red communication network decreases faster than that of the blue communication network while the red damage increases faster than the blue damage. Combining with the dynamics of the vision network, we may conclude that the high damage of the red force is because of no effective communication. With the average degree of the vision network decreasing, the blue team takes advantage of its communication network to retrieve more information about its environment and enemy. Therefore it has low damage. If inspecting the time series of the spatial entropy, we may find that the spatial entropy of the blue team is higher than that of the red team from time step 18. It implies that spreading a force is better than clustering it in this scenario. Finally combining with the real-time reasoning component described in the following subsection, the analysts may gain deeper understanding of what happens in each time step during the simulation and how the simulation is progressing. Step 11-12: System implementation and testing WISDOM-II is implemented in C++ with two run modes: command line and window version. We follow the validation and verification approach proposed by Sargent [82] and integrate it to the whole development procedure. The following is some examples of validation and verification techniques [82] used in WISDOM-II: • Animation: Through the visualization component, we graphically display the system operational behaviors over time, e.g. the structure of networks and the position of agents (Figure 14). By such a way, we verify that the programming is correct and the system does what we expect. • Comparison to other models: We conducted a comparison study between WISDOM-II and MANA. Table II shows the loss exchange ratio over 500 runs between MANA and WISDOM-II in two simple scenarios, coded in a similar way [105]. Through comparison, we ensure that the model is consistent with other models. TABLE II T HE LOSS EXCHANGE RATIO OVER 500 RUNS BETWEEN MANA AND WISDOM-II (α = 0.05) Traditional Force MANA WISDOM-II 0.95 ± 0.33 1.07 ± 0.47 •
Networked Force MANA WISDOM-II 0.93 ± 0.30 1.07 ± 0.40
Event validity: Compare occurrences of events between simulation system and real system. For example, the
Fig. 15.
•
•
Examples of temporal visualizations
indirect weapon may shoot hostile agents behind an impassable block. We ran a large number of simulations. The direct weapon can never shoot enemies behind an impassable block while the indirect weapon can. Extreme condition tests: The system should be able to deal with any extreme and unlikely combination of levels of factors in the system; e.g., if the speed of an agent is zero, it should not move. We ran a number of simulations, in which the speed of some agents is set to zero, some set to high speed while some set to low speed. The results showed that the agent with the speed of zero always stay in the original place. The agents with high speed always move faster than those with low speed. Operational graphics: Graphically display the values of various performance measures during the simulation, e.g. the combat entropy, force damage and casualty (Figure 15).
B. Scenario analysis 1) Scenario setup : A scenario is built to exemplify the usage of WISDOM–II. In order to identify the role of force size, engagement and communication in military operations in different environments, two types of environments are defined in Figure 16. Environment a (on left) represents an open environment without any obstacles while environment b (right figure) represents an environment with organized obstacles. Each environment is a 30x30 grid. For each environment, the red force with fixed capabilities plays against the blue force with different capabilities. Based on the blue force’s configurations, there are two scenarios in Table III. In this paper, a platform centric force means that each agent may communicate with any other agents if they are within each other’s communication range while network centric force means that each agent can only send information to the force headquarter and then the common operating picture (COP) developed by the force headquarter is sent back to each agent in the battlefield. Building the COP is a process of fusing all information received from all agents. We would like to see its effect on
Fig. 16.
The two different environments.
the interaction between fire range (engagement) and communication (correctness of information). Obviously, agents can get good information by having better sensors. In theory this is possible, in practice it is not since agents have limited capacity and we cannot overload a soldier, for example, with all possible sensors and machines. Also, as the COP is built centrally, information fusion is done once at the headquarter then it gets sent to the individual agents. This is more efficient than requesting each agent to fuse a huge amount of information if we equip that agent with excellent communication to all other agents. TABLE III S CENARIO SETUP Scenario BNC-RPC BPC-RPC
Blue Force Network Centric Platform Centric
Red Force Platform Centric Platform Centric
The red force is platform centric with force size of 50 agents. The blue force is platform centric or network centric with force size ranging from 10 to 50 in an interval of 10. Both red and blue communication range is 2. The red loss probability is 0 while the blue loss probability is ranging from 0 to 100 present with an interval of 10 present. The red firing range is 2 while the blue fire range is ranging from 1 to 10 with an interval of 1. Both the blue and red force use direct weapon. Both red and blue vision range is 2. The loss probability is the probability that messages are lost in a communication channel. For both blue and red agents, they will lose mobility after 5 hits and die after 6 hits. 2) Result and analysis: For each setup, we run the simulation 100 times with different random seeds and use the average loss exchange ratio to measure the performance of the blue force. The loss exchange ratio during the simulation is calculated as in Equation 5. P Red Casualty P R= (5) Blue Casualty Figures 17 and 18 depict the average loss exchange ratio for the scenario BPC-RPC and the scenario BNC-RPC with different force size in different environments respectively. A number of observations can be made from these figures. By inspecting environment a, when we have more agents, e.g. 50, even if we have high loss probability, e.g. eighty percent, network centric force is superior as long as we have long firing range weapon. However when we have less agents, e.g. 10, the network centric blue force requires both long firing range and low loss probability to outperform the platform centric blue force. For small number of agents, it is important to communicate effectively and efficiently to gather sufficient information about their enemy and the environment. Otherwise, they cannot take
Fig. 17. Environment a: The average loss exchange ratio for Scenario BPC-RPC (left side) and the Scenario BPC-RPC (right side) with different force size.
advantage of a weapon with a long fire range because they do not know where their enemy is. The effectiveness of communication is important in network centric force. One can see that the advantages of network centric rises as the probability of message losses in the communication channels decreases. The advantages of network centric also diminishes when the environment is full of obstacles. Naturally, maneuvers in environment b is more difficult than environment a. The obstacles make it hard to take advantage of the information superiority because a direct weapon cannot reach the enemy through obstacles i.e the fire range is not very relevant. In addition, it seems that when there are less obstacles, the network centric setup seems to outperform the platform centric setup. As such, when forces are deployed in an open field environment, network centric force is advantageous. The results mainly show that a long range fire is useless if we do not have information about the enemy beyond vision range. This finding is very consistent with what Bowley et al. found [106]. Certainly, one can use better sensors. But, this also means that one needs to synthesize and fuse the information gleaned from these sensors. As such, it is more efficient to build the common operating picture centrally. The results also demonstrate that building the common operating picture centrally can have a negative side effect if the communication channel has a significant amount of noise. Overall, these findings are logical and are known, but what is interesting here is that an abstract agent based simulation was able to show that. VII. C ONCLUSIONS Multi-agent simulations are widely used to model and study CAS. The challenging questions include: if we need to achieve a certain behavior on the global level, which network structure we should use? how does the network
Fig. 18. Environment b: The average loss exchange ratio for Scenario BPC-RPC (left side) and the Scenario BPC-RPC (right side) with different force size.
structure affect the dynamics of activities within a system? how can we use the network structure to understand the system’s behavior? how can we model the interaction between different networks? Answering the previous questions may deepen our understanding of the dynamics of a CAS. Although it is almost impossible to provide an analytical mathematical model for every relationship between each component in the system and the overall behavior because of the high degree of nonlinearity, what has been overlooked in the literature is the fact that reasoning does not need to be on the level of the components and there is no evidence whatsoever that reasoning cannot be done on the level of the structure (i.e. the network) instead. Despite that many agent systems can be imagined as being operating on the concept of networks, designing and implementing the system on the concept of network is a more powerful approach. Our proposed agent architecture provides for the first time a new type of reasoning in CAS. The network based architecture facilitates a structural reasoning, creates a new angle to gain insight into a complex system and easily solve the limitations associated with current agent based simulation. We used the architecture to study warfare simulations and we have shown that the new system provides a substantial analytical tool. ACKNOWLEDGMENTS This work is supported by the University of New South Wales grant PS04411 and the Australian Research Council (ARC) Centre on Complex Systems grant number CEO0348249. The authors would like to thank Dr. Michael Barlow for his insightful comments.
R EFERENCES [1] Holland, J.H.: Adaptation in Natural and Artificial Systems: An Introductory Analysis with Applications to Biology, Control, and Artificial Intelligence. The MIT Press, Cambridge, MA (1992) [2] Holland, J.H.: Hidden Order: How Adaptation Builds Complexity (Helix Books). Addison Wesley Publishing Company, New York (1996) [3] Flake, G.W.: The Computational Beauty of Nature: Computer Explorations of Fractals, Chaos, Complex Systems, and Adaptation. The MIT Press, Cambridge, MA (1998) [4] Levin, S.A.: Ecosystems and the biosphere as complex adaptive systems. Ecosystems 1 (1998) 431 – 436 [5] Wasserman, S., Faust, K.: Social Network Analysis: Methods and Applications. Cambridge University Press, Cambridge, UK (1994) [6] Albert, R., Barab´asi, A.: Statistical mechanics of complex networks. Reviews of Modern Physics 74 (2002) 47–97 [7] Newman, M.E.J.: The structure and function of complex networks. SIAM Review 45 (2003) 167–256 [8] Dorogovtsev, S.N., Mendes, J.F.F.: Evolution of networks. Advances in Physics 51 (2002) 1079–1187 [9] Waldrop, M.: Complexity: The Emerging Science at the Edge of Order and Chaos. Simon and Schuster, New York (1992) [10] Holland, J.H.: Emergence: From Chaos to Order. Addison-Wesley Longman Publishing Co., Inc., Boston, MA, USA (1998) [11] Johnson, S.: Emergence: The Connected Lives of Ants, Brains, Cities, and Software. Scribner, New York (2001) [12] Strogatz, S.: Sync: The Emerging Science of Spontaneous Order. Hyperion Press, New York (2003) [13] Yang, A., Abbass, H.A., Sarker, R.: WISDOM-II: A network centric model for warfare. In: Ninth International Conference on Knowledge-Based Intelligent Information & Engineering Systems (KES 2005), LNCS 3683, Melbourne, Australia (2005) [14] Barringer, H., Fisher, M., Gabbay, D., Gough, G., Owens, R.: METATEM: A framework for programming in temporal logic. In: REX Workshop on Stepwise Refinement of Distributed Systems: Models, Formalisms, Correctness (LNCS Volume 430), Berlin, Germany, Springer-Verlag (1989) 94 – 129 [15] Rao, A.S., Georgeff, M.P.: Modeling rational agents within a BDI-architecture. In Fikes, R., Sandewall, E., eds.: Proceedings of Knowledge Representation and Reasoning (KR&R-91), San Mateo, CA, Morgan Kaufmann Publishers (1991) 473 – 484 [16] Fisher, M.: A survey of concurrent metatem - the language and its applications. In Gabbay, D.M., Ohlbach, H.J., eds.: Temporal Logic Proceedings of the First International Conference (LNAI 827), Berlin, Germany, Springer-Verlag (1994) 480–505 [17] Rao, A.S.: Decision procedures for propositional linear-time belief-desire-intention logics. In Wooldridge, M., Muller, J.P., Tambe, M., eds.: Intelligent Agents II (LNAI 1037). Springer-Verlag, Berlin, Germany (1996) 33 – 48 [18] Lesperance, Y., Levesque, H.J., Lin, F., Marcu, D., Reiter, R., Scherl, R.B.: Foundations of a logical approach to agent programming. In Wooldridge, M., Muller, J.P., Tambe, M., eds.: Intelligent Agents II (LNAI 1037). Springer-Verlag, Berlin, Germany (1996) 331–346 [19] Wooldridge, M.J., Jennings, N.R.: Intelligent agents: Theory and practice. Knowledge Engineering Review 10 (1995) 115–152 [20] Nwana, H.S.: Software agents: An overview. Knowledge Engineering Review 11 (1996) 205–244 [21] Sycara, K.P.: Multiagent systems. AI Magazine 19 (1998) 79–92 [22] V´azquez-Salceda, J., Dignum, V., Dignum, F.: Organizing multiagent systems. Autonomous Agents and Multi-Agent Systems 11 (2005) 307–360 [23] Wooldridge, M.J., Jennings, N.R., Kinny, D.: The gaia methodology for agent- oriented analysis and design. Autonomous Agents and Multi-Agent Systems 3 (2000) 285–312 [24] Omicini, A.: Soda: Societies and infrastructures in the analysis and design of agent-based systems. In Ciancarini, P., Wooldridge, M., eds.: Agent-Oriented Software Engineering. Volume 1957 of LNAI. Springer-Verlag (2001) 185–193 [25] Esteva, M., Padget, J.A., Sierra, C.: Formalizing a language for institutions and norms. In: ATAL ’01: Revised Papers from the 8th International Workshop on Intelligent Agents VIII. Volume 2333 of LNAI., London, UK, Springer-Verlag (2002) 348–366 [26] Schmitt, J.F.: Complexity, global politics, and national security. In Alberts, D.S., Czerwinski, T.J., eds.: Command and (Out of) Control: The Military Implications of Complexity Theory. National Defense University, Washington, DC (1997) 99–111 [27] Lauren, M.K.: Modelling combat using fractals and the statistics of scaling systems. Military Operations research 5 (2000) 47–58 [28] Ilachinski, A.: Irreducible semi-autonomous adaptive combat (ISAAC): An artificial life approach to land combat. Military Operations Research 5 (2000) 29–46 [29] Huhns, M.N., Singh, M.P.: Cognitive agents. IEEE Internet Computing 2 (1998) 87–89 [30] Ferber, J.: Multiagent Systems: An Introduction to Distributed Artificial Intelligence. Addison Wesley, Edinburgh (1999) [31] Wooldridge, M.J.: 1: Intelligent agents. In Weiss, G., ed.: Multiagent Systems: A Modern Approach to Distributed Artificial Intelligence. The MIT Press (1999) 3–44 [32] Bryson, J.: Cross-paradigm analysis of autonomous agent architecture. Journal of Experimental and Theoretical Artificial Intelligence 12 (2000) 165–189 [33] Dastani, M.M., Torre, L.: A classification of cognitive agents. In: Proceedings of the 24th Annual Meeting of the Cognitive Science Society (Cogsci’02), Washington DC, USA (2002) 256–261 [34] Rao, A.S., Georgeff, M.P.: BDI agents: From theory to practice. In: Proceedings of the 1st International Conference on Multi-Agent Systems, San Francisco, USA (1995) 312–319 [35] Georgeff, M.P., Lansky, A.L.: Reactive reasoning and planning. In: Proceedings of the Sixth National Conference on Artificial Intelligence (AAAI-87), Seattle, WA (1987) 677682 [36] d0 Inverno, M., Kinny, D., Luck, M., Wooldridge, M.J.: A formal specification of dmars. In Singh, M.P., Rao, A.S., Wooldridge, M.J., eds.: Intelligent Agents IV: Proceedings of the Fourth International Workshop on Agent Theories, Architectures, and Languages, LNAI 1365, Springer-Verlag (1997) 155–176 [37] Ramamohanarao, K., Bailey, J., Busetta, P.: Transaction oriented computational models for multi-agent systems. In: Proceedings of the 13th International Conference on Tools with Artificial Intelligence, Dallas, Texas, USA (2001) 11–17
[38] Nolfi, S.: Power and the limits of reactive agents. Neurocomputing 42 (2002) 119–145 [39] Brooks, R.A.: Elephants don’t play chess. Robotics and Autonomous Systems 6 (1990) 3–15 [40] Brooks, R.A.: Intelligence without reason. In J., M., R., R., eds.: Proceedings of the 12th International Joint Conference on Artificial Intelligence (IJCAI-91). Morgan Kaufmann publishers Inc.: San Mateo, CA, USA, Sydney, Australia (1991) 569–595 [41] Brooks, R.A.: Intelligence without representation. Artifical Intelligence 47 (1991) 139–159 [42] Brooks, R.A.: A robust layered control system for a mobile robot. IEEE Journal of Robotics and Automation 2 (1986) 14–23 [43] Reynolds, C.W.: Flocks, herds, and schools: A distributed behavioral model. Computer Graphics 21 (1987) 25–34 access to http://www.red3d.com/cwr/papers/1987/SIGGRAPH87.pdf on 12 January 2006. [44] Bonasso, R.P., Firby, R.J., Gat, E., Kortenkamp, D., Miller, D.P., Slack, M.G.: Experiences with an architecture for intelligent, reactive agents. Journal of Experimental & Theoretical Artificial Intelligence 9 (1997) 237–256 [45] Chapman, D.: Planning for conjunctive goals. Artificial Intelligence 32 (1987) 333378 [46] Waldmann, M.R., Holyoak, K.J.: Predictive and diagnostic learning within causal models: Asymmetries in cue competition. Journal of Experimental Psychology: General 121 (1992) 222236 [47] Waldmann, M.R.: Competition among causes but not effects in predictive and diagnostic learning. Journal of Experimental Psychology: Learning, Memory, and Cognition 26 (2000) 5376 [48] Waldmann, M.R.: Predictive versus diagnostic causal learning: Evidence from an overshadowing paradigm. Psychological Bulletin and Review 8 (2001) 600608 [49] Pearl, J.: Causality: Models, Reasoning and Inference. Cambridge University Press, New York (2000) [50] Lagnado, D.A., Waldmann, M.R., Hagmayer, Y., Sloman, S.A.: Beyond covariation: Cues to causal structure. In Gopnik, A., Schulz, L., eds.: Causal learning: Psychology, Philosophy, and Computation. Oxford University Press, Oxford (2006) in press. [51] Waldmann, M.R.: Knowledge-based causal induction. In Shanks, D.R., Holyoak, K.J., Medin, D.L., eds.: The Psychology of Learning and Motivation. Volume 34. Academic Press, Diego, CA (1996) 47–88 [52] Granger, C.W.J.: Investigating causal relations by econometric models and cross-spectral methods. Econometrica 37 (1969) 424–438 [53] Hamilton, J.D.: Time Series Analysis. Princeton University Press, Princeton, NJ (1994) [54] Dunne, P., Vougas, V.: Military spending and economic growth in South Africa: A causal analysis. Journal of Conflict Resolution 43 (1999) 521–537 [55] Dunne, P., Nikolaidou, E., Vougas, V.: Defence spending and economic growth: A causal analysis for Greece and Turkey. Defence and Peace Economics 12 (2001) 5–26 [56] Kollias, C., Manolas, G., Paleologou, S.: Defence expenditure and economic growth in the European union: A causality analysis. Journal of Policy Modeling 26 (2004) 553569 [57] Hiemstra, C., Jones, J.D.: Testing for linear and nonlinear granger causality in the stock price- volume relation. The Journal of Finance 49 (1994) 1639–1664 [58] Harris, R.J.: A Primer of Multivariate Statistics. 3rd edition edn. Lawrence Erlbaum Assoc Inc., Mahwah, NJ (2001) [59] Nelms, C.R.: Root cause analysis - not what you might think. http://www.maintenanceworld.com/root-cause-analys.htm (2003) Access on March 8, 2006. [60] Rooney, J.J., Heuvel, L.V.: Root cause analysis for beginners. Quality Progress - (2004) 45–53 http://www.asq.org/pub/qualityprogress/past/0704/index.html. [61] DOE: Root cause analysis guidance document. DOE Guideline DOE-NE-STD-1004-92, Office of Nuclear Energy, U.S. Department of Energy, Washington, D.C. (1992) [62] Tuli, R.W., Apostolakis, G.E.: Incorporating organizational issues into root-cause analysis. Process Safety and Environmental Protection 74 (1996) 3–16 [63] Fernandes, C.M.B., Walker, R., Price, A., Marsden, J., Haley, L.: Root cause analysis of laboratory delays to an emergency department. Journal of Emergency Medicine 5 (15) 735–739 [64] Handley, C.C.: Quality improvement through root cause analysis. Hospital Materiel Management Quarterly 21 (2000) 74–8 [65] Leszak, M., Perry, D.E., Stoll, D.: A case study in root cause defect analysis. In: ICSE ’00: Proceedings of the 22nd International Conference on Software Engineering, New York, NY, USA, ACM Press (2000) 428–437 [66] Rex, J.H., Turnbull, J.E., Allen, S.J., Voorde, K.V., Luther, K.: Systematic root cause analysis of adverse drug events in a tertiary referral hospital. Joint Commission Journal on Quality and Patient Safety 26 (2000) 563–575 [67] Boyer, M.M.: Root cause analysis in perinatal care: Health care professionals creating safer health care systems. Journal of Perinatal & Neonatal Nursing 15 (2001) 40–54 [68] Burroughs, T.E., Cira, J.C., Chartock, P., Davies, A.R., Dunagan, W.C.: Using root cause analysis to address patient satisfaction and other improvement opportunities. Joint Commission Journal on Quality and Patient Safety 26 (2000) 439–449 [69] Thornhill, N.F., Shah, S.L., Huang, B.: Detection of distributed oscillations and root-cause diagnosis. In: Proceeding of CHEMFAS 4, Jejudo(Chejudo) Island, Korea (2001) 167–172 [70] Carlson, J.S., S¨oderberg, R.: Assembly root cause analysis: A way to reduce dimensional variation in assembled products. International Journal of Flexible Manufacturing Systems 15 (2003) 113–150 [71] Julisch, K.: Clustering intrusion detection alarms to support root cause analysis. ACM Transactions on Information and System Security 6 (2003) 443–471 [72] Zhang, K., Yen, A., Zhao, X.L., Massey, D., Wu, S.F., Zhang, L.X.: On detection of anomalous routing dynamics in BGP. In Mitrou, N., Kontovasilis, K., Rouskas, G.N., Iliadis, I., Merakos, L., eds.: Proceedings of Third International IFIP-TC6 Networking Conference, LNCS3042, Athens, Greece (2004) 259–270
[73] Siekkinen, M., Urvoy-Keller, G., Biersack, E.W., En-Najjary, T.: Root cause analysis for long-lived TCP connections. In: CoNEXT ’05: Proceedings of the 2005 ACM Conference on Emerging Network Experiment and Technology, New York, NY, USA, ACM Press (2005) 200–210 [74] Shalizi, C.R.: Methods and techniques of complex systems science: An overview. In Deisboeck, T.S., Kresh, J.Y., Kepler, T.B., eds.: Complex Systems Science in Biomedicine. Kluwer Academic, New York (2004) [75] Ackoff, R.L.: The future of operational research is past. Journal of the Operational Research Society 30 (1979) 93–104 [76] Ackoff, R.L.: Resurrecting the future of operational research. Journal of the Operational Research Society 30 (1979) 189–199 [77] Curtis, N.J., Dortmans, P.J., Ciuk, J.: doing the right problem versus doing the problem right: Problem structuring within a land force environment. Journal of the Operational Research Society 1 (2005) – advance online publication,. [78] Dortmans, P.J., Curtis, N.J., Tri, N.: An analytical approach for constructing and measuring concepts. Journal of the Operational Research Society 1 (2005) – Advance online publication. [79] Caughlin, D.: An integrated approach to verification, validation, and accredition of models and simulation. In Joines, J.A., Barton, R.R., Kang, K., Fishwick, P.A., eds.: Proceedings of the 2000 Winter Simulation Conference, Orlando, FL, USA (2000) 872–881 [80] Pfleeger, S.L.: Software Engineering: Theory and Practice. Prentice-Hall, Inc., Upper Saddle River, NJ, USA (1998) [81] Balci, O.: Validation, verification, and testing techniques throughout the life cycle of a simulation study. In Tew, J.D., Manivannan, S., Sadowski, D.A., Seila, A.F., eds.: Proceedings of the 1994 Winter Simulation Conference, Lake Buena Vista, FL, USA (1994) 215–220 [82] Sargent, R.G.: Validation and verification of simulation models. In Farrington, P.A., Nembhard, H.B., Sturrock, D.T., Evans, G.W., eds.: Proceedings of the 1999 Winter Simulation Conference, Phoenix, AZ, USA (1999) 39–48 [83] Coylea, G., Exelby, D.: The validation of commercial system dynamics models. System Dynamics Review 16 (2000) 27–41 [84] Walton, G.H., Patton, R.M., Parsons, D.J.: Usage testing of military simulation systems. In Peters, B.A., Smith, J.S., Medeiros, D.J., Rohrer, M.W., eds.: Proceedings of the 2001 Winter Simulation Conference, Arlington, VA, USA (2001) 771–779 [85] Graham, J.R., Decker, K.S., Mersic, M.: DECAF - a flexible multi agent system architecture. Autonomous Agents and Multi-Agent Systems 7 (2003) 7–27 [86] Yang, A., Abbass, H.A., Sarker, R.: Characterizing warfare in red teaming. IEEE Transactions on Systems, Man, Cybernetics, Part B: Cybernetics 36 (2006) 268–285 [87] Yang, A., Abbass, H.A., Sarker, R.: Landscape dynamics in multi-agent simulation combat systems. In: Proceedings of 17th Joint Australian Conference on Artificial Intelligence, LNAI 3339, Cairns, Australia, Springer-Verlag (2004) [88] Ilachinski, A.: Irreducible semi-autonomous adaptive combat (ISAAC): An artificial life approach to land combat. Research Memorandum CRM 97-61, Center for Naval Analyses, Alexandria (1997) [89] Scherrer, J.H.: Risks and vulnerabilities of network-centric forces: Insights from the science of complexity. Newport r.i., Naval War College (2003) [90] Ilachinski, A.: Artificial War: Multiagent-Based Simulation of Combat. World Scientific Publishing Company, Singapore (2004) [91] Lauren, M.K., Stephen, R.T.: MANA: Map-aware non-uniform automata. a new zealand approach to scenario modelling. Journal of Battlefield Technology 5 (2002) 27–31 [92] Galligan, D., Lauren, M.: Operational aspects of imaging radar system in maritime reconnaissance aircraft. Journal of Battlefield Technology 6 (2003) 29–32 [93] Galligan, D.P.: Modelling shared siturational awareness using the MANA model. Journal of Battlefield Technology 7 (2004) 35–40 [94] White, G.: The mathematical agent - a complex adaptive system representation in bactowars. In: First Workshop on Complex Adaptive Systems for Defence, Adelaide, Australia (2004) [95] Barlow, M., Easton, A.: CROCADILE - an open, extensible agent-based distillation engine. Information & Security 8 (2002) 17–51 [96] DOD: Department of defense dictionary of military and associated terms. http://www.dtic.mil/doctrine/jel/doddict/ (2005) Access on Sept. 6, 2005. [97] Coram, R.: Boyd: The Fighter Pilot Who Changed the Art of War. Little, Brown, U.S.A. (2002) [98] Dekker, A.H.: Network topology and military performance. In Zerger, A., Argent, R.M., eds.: MODSIM 2005 International Congress on Modelling and Simulation, Modelling and Simulation Society of Australia and New Zealand, Melborune, Australia (2005) 2174–2180 [99] Dekker, A.H.: Simulating network robustness for critical infrastructure networks. In Estivill-Castro, V., ed.: Twenty-Eighth Australasian Computer Science Conference (ACSC2005). Volume 38 of CRPIT., Newcastle, Australia, ACS (2005) 59–68 [100] Xu, J., Chen, H.: Criminal network analysis and visualization. Communications of the ACM (CACM) 48 (2005) 100–107 [101] Curtis, N.J., Dortmans, P.J.: A dynamic conceptual model to explore technology-based perturbations to a complex system: the land force. Asia-Pacific Journal of Operational Research 21 (2004) 463–485 [102] Dekker, A.H.: A taxonomy of network centric warfare architectures. In: SETE 2005 Systems Engineering / Test and Evaluation Conference, Brisbane, Australia (2005) [103] Xu, J., Chen, H.: Crimenet explorer: A framework for criminal network knowledge discovery. ACM Transactions on Information Systems (TOIS) 23 (2005) 201–226 [104] Ilachinski, A.: Enhanced isaac neural simulation toolkit (EINSTein), an artificial-life laboratory for exploring self-organized emergence in land combat. Beta-Test User’s Guide CIM 610.10, Center for Naval Analyses (1999) [105] Yang, A., Abbass, H.A., Sarker, R.: A comparison study of WISDOM and MANA in a networked environment. Technical Report TR-ALAR-200512001, University of New South Wales, ADFA, Canberra, Australia (2005) [106] Bowley, D.K., Castles, T.D., Ryan, A.: Attrition and suppression: Defining the nature of close combat. Technical Report DSTO-TR1638, DSTO, Australia (2004)