A Network of Networks Approach to Interconnected Power Grids Paul Schultz1,2 ,∗ Frank Hellmann1 , Jobst Heitzig1 , and J¨ urgen Kurths1,2,3,4 1
arXiv:1701.06968v1 [physics.soc-ph] 31 Dec 2016
2
Potsdam Institute for Climate Impact Research, P.O. Box 60 12 03, 14412 Potsdam, Germany Department of Physics, Humboldt University of Berlin, Newtonstr. 15, 12489 Berlin, Germany 3 Institute for Complex Systems and Mathematical Biology, University of Aberdeen, Aberdeen AB24 3UE, United Kingdom 4 Department of Control Theory, Nizhny Novgorod State University, Gagarin Avenue 23, 606950 Nizhny Novgorod, Russia
We present two different approaches to model power grids as interconnected networks of networks. Both models are derived from a model for spatially embedded mono-layer networks and are generalised to handle an arbitrary number of network layers. The two approaches are distinguished by their use case. The static glue stick construction model yields a multi-layer network from a predefined layer interconnection scheme, i.e. different layers are attached with transformer edges. It is especially suited to construct multi-layer power grids with a specified number of nodes in and transformers between layers. We contrast it with a genuine growth model which we label interconnected layer growth model.
INTRODUCTION
The power grid has been described as the most complex machine ever built. It consists of millions of individual machines that interact through a hierarchical multi-layer network that scales from single buildings to continents. Currently most studies of the power grid focus on a particular layer. This was possible as in the past, very welldefined roles have been assigned to different layers, being still evident in their names. The transmission layer would transmit energy from big centralised producers to centres of consumption and demand, balancing the overall energy budget. The distribution network would then distribute that energy to the individual consumers through a further hierarchy of voltage levels. This clear assignment of particular functions to voltage level increasingly no longer reflects the real structure of the power grid. As a consequence of, for instance, consumers operating solar home systems and smaller wind parks being connected at mid-voltage levels, distribution grids need to collect as well as aggregate energy. In the future, micro grids will try to achieve a more local balance of production and consumption, while also providing cross layer stability services that were not needed or possible previously. So far distribution grids have been seen mostly as passive consumers of stability from the top down. Frequency stability was entirely in the remit of the transmission grid operators, while voltage stability in the two grid layers was considered a separate issue. With distributed generation capacity in the distribution grids, a novel topic in power grid design is how stability services can be aggregated from the distribution grid into the transmission grid [1, 2]. This includes, for instance, the provision of reactive power as well as virtual swing mass to the transmission grid. The grid topology plays a large role in whether the distributed ancillary services can be provided to the transmission grid. Few systematic results on
this influence exist so far, so it is necessary to consider the impact on a case by case basis. In the study of individual network layers it has been increasingly understood that it is necessary to study the properties of power grids not just for individual benchmark models but also for ensembles of plausible topologies. In this respect, the DENA “Verteilnetzstudie” [3] used several representative ensembles of distribution grids and work on the dynamic stability of transmission systems has recently been advanced considerably by the availability of random network models that capture many typical properties of transmission systems [4, 5]. These random networks allow us to have sufficient statistics to identify particular topological features that can have a very large influence on non-linear dynamical properties like basin stability and survivability [6– 10], but also resilience against cascading failures caused by single disruptive events [11–14]. In this paper we introduce a random network algorithm that generalises this approach and captures the hierarchical multi-layer nature of a combined distribution and transmission grid. We contrast and compare two different mechanisms by which we can arrive at such a network, static construction (top-down or bottom-up) or concurrent growth. Both of these algorithms have different applications. The static construction approach is able to model the power grids of existing industrialised countries that are introducing renewables now as well as networks that are now coming into existence in the developing world, and that are renewable and micro grid driven from the start. The growth algorithm, however, does not rely on input from real power grids like, e.g. the ratio of intra- vs. inter-layer links for pairs of network layers. It rather produces multi-layer networks from heuristic assumptions on the growth process. We are going to present an in-depth study of network characteristics for both models in comparison in a forthcoming paper. We will begin by discussing important properties of
2 power grids at various network layers, focusing on the distinction between high and very high voltage levels that are typically meshed and mid and low voltage levels, that are typically operated as tree networks. We will then discuss two network construction algorithms that define a multi-layer power grid in detail and present a selection of network characteristics from an ensemble analysis.
MULTI-LAYER NETWORKS
An emerging field of research is the analysis of interactions between more than one interconnected network, so-called networks of networks [15–18]. Large developed power grids in are themselves networks of networks since they are typically composed of transmission grids interconnecting various regional distribution grids. In this regard, we can classify power grids as interconnected or interacting networks [15, 17, 19–21]. Among the literature on the network structure of isolated network layers, transmission grids are treated most prominently (e.g. [4, 5, 22, 23]) in contrast to distribution grids are only rarely studied (e.g. [24]). A review on the research about transmission network topologies is contained in [4, 25]. There exist growth models for networks of networks generalising preferential attachment [26], however they are so far restricted to multiplex networks with one-to-one relations between nodes in adjacent layers or do not consider a spatial embedding [27– 29]. The design of growth mechanisms for spatially embedded networks focuses on two central problems, namely a) the probability of a new node to appear at a certain position and b) the probability for a new edge to be added. These ingredients, growth and preferential attachment have already been identified to be responsible for the emergence of scale-invariant connectivity distributions as an indicator for hierarchical organisation in complex networks [26]. The first problem is typically addressed by assuming a spatial probability distribution of nodes [4], which can also be derived from existing network data [5]. New edges, however, are typically determined by special preferential attachment mechanisms [19] where the linkage probability is a function of a distance measure between nodes [4] and various further properties. In [19] a two-layer growth model is proposed, where supply and demand ratings of nodes are taken into account and interlayer edges are only added for high-degree nodes.
Definitions
Let us define an undirected network G = (V, E), where the node set V and edge set E comprise the busses and branches of a power grid respectively. Note that G can alternatively be defined as a weighted network
G = (V, E, W ) with edge weights W containing line admittances. We assume there exist two functions lev(v) and lev(e) that encode which level 1 . . . L each node v ∈ V and edge e ∈ E belongs to. The level of an edge will always be the minimum of the two levels of its end nodes. A layer G` is defined as the subnetwork of G induced by the sets of nodes v and edges e with lev(v) = ` or lev(e) = `,respectively. G` typically consists of several connected components, i.e. separate regional grids. Note that V is the disjoint union of all V ` . We denote with G`c = (Vc` , Ec` ) the “cumulative” subgraph of G formed by all nodes and edges of level ` or higher, i.e., with lev(v) ≥ ` or lev(e) ≥ `. Then, the pair ({G` }` , {E `k }`,k ) of layer subgraphs G` and layer interconnections E `k = {e = (v 0 , v 00 ) ∈ E|v 0 ∈ V ` ∧ v 00 ∈ V k } is called a multi-layer network. The network G is embedded in an external space – here we use the square [−1, 1]2 – such that each node has a location x(v) ∈ [−1, 1]2 . We denote by d2 (v, v 0 ) = ||x(v) − x(v 0 )||2 the spatial (Euclidean) distance between the locations of v and v 0 Note that all inter-layer edges E `k connect nodes at the same coordinates, i.e. they correspond to transformers modelled as internal edges between busses at different voltage levels. By identifying these nodes and dropping all inter-layer edges, we can define a spatial projection ˜ ` G` in analogy to projection networks network P(G) = ⊕ ˜ is the disjoint graph of multiplex networks [17]. Here, ⊕ union followed by identifying nodes with identical coordinates.
REVIEW OF NETWORK TOPOLOGIES
Power grids have been historically built in several network layers, each of which being characterised by a different voltage level. There are extra-high (>110 kV, EHV), high (36-110 kV, HV), medium (1-36 kV, MV) and low voltage (≤1 kV, LV) networks, being interconnected by transformer substations. The extra-high voltage layers are referred to as transmission grids whereas the other layers are considered as distribution grids. Power grids are built in a hierarchical structure in the sense that the coupling scheme is designed for topdown power-flows, i.e. from production centres in highvoltage network layers to consumers attached to lowvoltage grids. This is mirrored in a hierarchical control scheme, where the global balancing of production and consumption is mainly done on transmission grid level. Historically, power systems were local small-scale LV (MV) networks [30, 31], mainly in urbanised areas. For instance, the Pearl Street Station in New York City (1882), one of the first power stations, served a radius of less then 1 km. They have been constructed in proximity of load centres to minimise line losses, subsequently
3 the LV (MV) network capacity improvement has mainly been driven by the amount of load. Failures of islanded power plants, fluctuating demand and extreme weather situations posed large risks to these local distribution networks, while increased line loadings necessitated higher voltage ratings. Consequently, they have been interconnected using an overlay HV network [32, p.3], e.g. the UK supergrid built in the 1950’s. EHV superseded HV in this role and HV networks are primarily used as distribution grids [32, p.148]. Transmission grids made it possible to globally balance production and consumption as well as to include large-scale power plants into the grid which couldn’t be built close to load centres anymore. Low voltage networks grow radially from single nodes in the medium voltage network proportional to the local load development. As the average load density in cities can exceed 100 M W/km2 in contrast to 10 kW/km2 in rural areas, there are difference between urban/rural LV grids [32, p.194ff.], e.g. urban grids tend to be interconnected due to their proximity. In general, they are operated as radial networks (open loops) [32, p.192], i.e. with a single in-feed node from MV, where the length of an LV line is usually limited to 500m or less [32, p.12]. Medium voltage grids are (as well) operated as radial networks (open loops) [32, p.17] as meshed configurations are more complex to control [32, p.176]. In urban areas, an MV grid follows the road network, typically as underground cables [32, p.181]. Hence, their network evolution in urban areas probably correlates with road networks [33]. In principle, local LV networks could be directly coupled to the HV layer without the need of intermediate MV grids. Still, MV grids remain because they have considerably less construction costs and are more suitable for industrial consumers [32, p.166]. Extra-high and High voltage networks consist of longrange connections with high capacity, typically built as a meshed grid [32, p.15]. Both HV and EHV usually fulfil the so-called N − 1-criterion [32, p.7] which means that they are required to be resilient towards the failure of a single component. As a simplifying assumption, we are going to consider three different network layers in the following: • low (LV), very local distribution networks • middle (MV and HV), the actual distribution backbone in an area • high (EHV), connecting different areas over long distances This choice is a trade-off between the observed functional roles or design principles of network layers in power grids and the modelling complexity needed to reproduce important features. Our model presented in the following are, however, not restricted and naturally work for the general case of an arbitrary number of network layers.
Note that the classification of HV grids is somewhat ambiguous. On the one hand, their functional role relates them to MV grids, while on the other hand, their rather meshed structure is more similar to EHV grids. We use the categorisation given above, however, this distinction might differ strongly across real power grids and should be evaluated on a case-by-case basis.
MODEL DESCRIPTION Recapitulating the Mono-layer Model [4]
In a previously published random growth model [4] for synthetic infrastructure networks, we describe a heuristic growth process to create statistically suitable network topologies. It has been especially tuned to high-voltage transmission networks and consists of two growth phases which we are going to recapitulate in the following. For details of the implementation, we refer to [4]. In the first phase (initialisation), an initial number of nodes n0 is connected using a minimum spanning tree, minimising the overall edge length. Furthermore, a number of additional edges m = n0 (1 − s)(p + q) are chosen to connect the node pairs for which a cost function f (v, v 0 ) =
(dG (v, v 0 ) + 1)r d2 (x(v), x(v 0 ))
(1)
is maximal. By dG (v, v 0 ) we denote the minimum length of any path from v to v 0 in the network G. Here, a control parameter r determines the value of additional redundancy for adding a new edge i–j between two nodes at positions x(v) and x(v 0 ). The second phase (growth) consecutively adds new nodes to the existing network using an attachment rule that can be adjusted with three parameters p, q and s. They correspond to a probability p of connecting a new node with a second (redundant) edge, a probability q of reinforcing the network by connecting a pair of existing nodes and a probability s to split an existing edge by adding the new node inbetween. In summary, a set of five independent parameters {n0 , p, q, r, s} along with the desired network size n fully determines the model output. Additionally, the network characteristics also depend on the choice of node locations. They can be drawn at random from a given spatial distribution, determined from data, or both. For instance, a Gaussian mixture model has been applied to locational data from US power grids [5] to obtain node location densities. We propose two different extensions of this base model. On the one hand, we consider a static construction by ’gluing’ together network layers according to a specified layer interconnection structure. The inter-layer networks are derived from the base model with individually ad-
4 justed parameters. On the other hand, we allow the parallel growth of network layers at a different rate. In this way, we obtain a multi-layer network without predefined layer interconnections.
Static Glue Stick Construction (GSC )
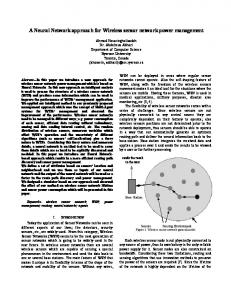
If network parameters are initially known (node positions, branching values etc.), the base model can be used to construct G from its layers G` respectively each layer G` from a set of connected components Ci` using an individual set of base model parameters {n` , n`0 , p` , q ` , r` , s` }. Here, we are going to assume homogeneous model parameters for all components of a layer ` but in general it might be useful to consider certain parameter distributions. Different layers are connected via transformers which are represented as internal edges between a highvoltage and low-voltage bus. The GSC model can be set up as a bottom-up algorithm starting from the lowest layer and consecutively adding higher ones or reversed (top-down), depending on the model scenario. The resulting multi-layer networks, however, do not differ qualitatively. Fig. 1(a) pictures the output of this algorithm using the parameters n = (10, 15, 12), n0 = (8, 14, 11), p = (.2, .1, 0), q = (.3, 0, 0), r = (.33, .33, .33), s = (.1, .1, .1). Node colour corresponds to the different network layers, whereas edge colours differentiate between inter- and intra-layer edges. While the Ghigh consists of a single connected component, Gmiddle and Glow consist of 6 respectively 85 components. In Fig. 1(b), we further show the corresponding spatial projection network.
Interconnected Layer Growth (ILG )
We now present a more generic network generation algorithm that is relatively simple but still quite flexible and may be used to generate synthetic infrastructure networks representing power grids, transportation networks, or communication networks in which nodes and edges may reside on any number of levels. It is basically a multi-layer version of the algorithm described at the beginning of this section [4] with some small changes in the trade-off function used for the placement of redundant edges (now using spatial length weighted network distance and introducing preference for target nodes in more densely populated areas). The algorithm forms an undirected network G = (V, E) along with node locations x(v) ∈ [−1, 1]2 for each v ∈ V , We denote by dG`c (v, v 0 ) the minimum weighted length of any path from v to v 0 in G`c where an edge from v 00 to v 000 has weight d2 (v 00 , v 000 ). In addition, we define a
“node density” measure by putting X d2 (v, v 0 )−2 , d(v) =
(2)
lev(v) v 0 ∈Vc \{v}
which will be used as a simple proxy for the “user population” per area “around” x(v). Note that we restrict the sum to nodes of at least the same level as v. In this way, the construction of each level will be independent of the lower levels, which we consider a useful property since it allows one to use our model with different values of L and get similar topologies for the highest level(s) no matter how many lower levels one chooses to model in addition. To govern the placement of redundant edges, we define a “trade-off” function `
f ` (v, v 0 ) =
`
(dG`c (v, v 0 ) + d2 (v, v 0 ))r d(v 0 )u . d2 (v, v 0 )
(3)
The idea is that building a redundant edge from v to v 0 has costs proportional to spatial length d2 (v, v 0 ) and benefits resulting from (i) forming a redundant cycle of length dG`c (v, v 0 ) + d2 (v, v 0 ) and (ii) simplifying access from v to a “user population” proportional to d(v 0 ). The trade-off function thus values the prospective line by combining the two types of benefits into a Cobb-Douglas type ”utility” assessment (dG`c (v, v 0 ) + d2 (v, v 0 ))r d(v 0 )u , and then computing utility per unit cost. In this, r` , u` ≥ 0 are parameters governing the importance of the bene` fits. Our usage of d(v 0 )u was inspired by a similar term used in [5] for calculating line placement probabilities, which was however based on a different definition of density that was less fast to calculate and update during network growth. To place a new node v into some level `, the algorithm will make use of the following “placement step” (P) Draw y uniformly at random from the square [−1, 1]2 , draw v 0 uniformly at random from Vc` \{v}. Then either put x(v) = α` y + (1 − α` )x(v 0 ) (with probability γ ` ) or put x(v) = β ` y + (1 − β ` )x(v 0 ) (with probability 1 − γ ` ). Now, for each phase φ = 1 . . . L, the algorithm performs the following steps: • Introduction and initialisation of a new level ` = φ: I1 Add n`0 many nodes vi` to V , with lev(vi` ) = ` and random locations x(vi` ) as follows. I1.1 Draw x(v1` ) uniformly at random from the square [−1, 1]2 . I1.2 For i = 2 . . . n`0 , perform step (P) for node v = vi` . I2 Find the minimum spanning tree (w.r.t. Euclidean distance) of these n`0 many locations and add all its edges e to E, putting lev(e) = `.
5
(a)
(b)
FIG. 1: (a) Schematic representation of a multi-layer network G created with the GSC algorithm. It consists of three layers (i.e. high/middle/low) which are interconnected by transformers, here visualised as vertical (orange) edges. The layers are separated according to their voltage rating. The model parameters are listed in the text. (b) Spatial projection network P(G) of the multi-layer network depicted in (a). I3 Add m = bn`0 (1−s` )(p` +q ` )c many redundant edges to level ` as follows. For a = 1 . . . m, draw a v ∈ V ` uniformly at random, find that v 0 ∈ V ` \ {v} that has no edge to v yet for which f ` (v, v 0 ) is maximal, add a new edge e from v to v 0 to E, and put lev(e) = `. I4 If ` > 1, connect the previous level to the new one by finding the node v ∈ V `−1 that minimises d2 (v1` , v), adding a new edge e from v1` to v to E, and putting lev(e) = ` − 1. • Simultaneous growth of all already existing levels ` = 1 . . . φ. For each ` = 1 . . . φ, let U ` be a set of n`φ many new nodes v to be added with lev(v) = `, and let U be the union of all these U ` . For each v ∈ U , drawn uniformly at random without replacement, do the following: G0 Add v to V and let ` = lev(v). With probabilities 1 − s` and s` , perform either steps G1—G4 or step G5 below, respectively. G1 Perform step (P) to determine x(v). G2 Find that node v 0 ∈ Vc` \{v} for which d2 (v, v 0 ) is minimal, add a new edge e from v to v 0 to E, and put lev(e) = `. G3 Draw a number k ≥ 0 from the geometric distribution with mean p` and repeat the following k times: find that node v 0 ∈ Vc` \ {v} that has no edge to v yet for which f ` (v, v 0 ) is maximal, add a new edge e from v to v 0 to E, and put lev(e) = `.
G4 Draw a number k ≥ 0 from the geometric distribution with mean q ` and repeat the following k times: draw a node v 00 ∈ V ` uniformly at random, find that node v 0 ∈ Vc` \ {v 00 } that has no edge to v 00 yet for which f ` (v 00 , v 0 ) is maximal, add a new edge e from v 00 to v 0 to E, and put lev(e) = `. G5 Select an edge e ∈ E ` uniformly at random, let v 0 , v 00 be its end nodes, draw a ∈ [0, 1] uniformly at random, let x(v) = ax(v 0 ) + (1 − a)x(v 00 ), remove e from E and add two new edges e0 , e00 with lev(e0 ) = lev(e00 ) = ` to E, one from v 0 to v, the other from v to v 00 . The parameters are the following: • L ≥ 1: number of levels. • n`0 ≥ 1: number of initial nodes of level ` at its introduction. • n`φ ≥ 0: number of additional nodes of level ` grown in phase φ ≥ `. • α` , β ` , γ ` ∈ [0, 1]: node location distribution parameters governing the amount of spatial clustering. • p` : expected number of redundant edges each new node gets immediately. • q ` : expected number of additional redundant edges added to random nodes at each growth step.
6 • r` , u` ≥ 0: importance of redundant edge benefits. • s` : rate of edge splittings. Fig. 2 shows an example with L = 3 and a total of 50,000 nodes, generated in under one hour on an Intel i7-6600U CPU with under one GB of memory usage. For an efficient implementation of the algorithm, one can keep in memory a list of node densities d(v) for just those v ∈ V with lev(v) ≥the minimal ` for which u` > 0. Then d(v) with lev(v) = ` is easily updated whenever a node v 0 with lev(v) ≥ ` is added by simply adding d2 (v, v 0 )−2 to d(v). Storing a full spatial distance matrix can be avoided by using efficient spatial data structures such as R+ -trees. If p, q are relatively small (as in power grids), f needs to be evaluated rarely, thus storing and updating a full network distance matrix would be inefficient. Hence, the algorithm can also be implemented efficiently with low memory requirements. ENSEMBLE NETWORK CHARACTERISTICS
In the following section, we give an impression of network characteristic for multi-layer power grids created with both models. A number of different network metrics has been proposed to characterise power grids (e.g. [4, 5]. Commonly used are degree and edge length distributions. We consider an ensemble of 50 multi-layer networks with L = 3 layers, constructed with each model. The GSC model parameters are n = (10, 15, 12), n0 = (8, 14, 11), p = (.2, .1, 0), q = (.3, 0, 0), r = (.33, .33, .33), s = (.1, .1, .1). This choice results in a total number of 1690 nodes. The ILG parameters are chosen to be α` ≡ .05, β ` ≡ .5, ` γ ≡ .5, nφ = (985, 5, 10) n0 = (2, 5, 10) p = (.3, .1, 0), q = (.075, .075, 0), r = (1.5, .75, 0), u = (.1, .05, 0), s = (0, .05, .2). This choice results in a total number of 1000 nodes. In Fig. 3(a) and (b), it can be seen that both models yield networks with roughly geometric degree distributions of P(G). This result shows that higher-level nodes tend to have larger degrees. Interestingly, for our choice of parameters, we observe gaps in the distribution. This is a result of the projection where nodes v, v 0 with the same coordinates are identified as a new node v 00 whose degree becomes k(v 00 ) = k(v) + k(v 0 ) − 2. Plotting node density vs. degree of the network (Fig. 4) by level, shows a slight positive correlation for the higherdegree nodes, slightly similar to what was reported in [5]. (Some noise was added to degrees to get a better view of the distribution. The logarithmic edge length distribution is depicted in Fig. 5. The GSC model yields a two-sided approximately exponential distribution and shows a strong separation
of scales between the layers compared to ILG networks. For the large network depicted in Fig. 2, we find a twosided approximately exponential distribution with slopes of roughly 0.9 (left) and −1.8 (right), very similar to what was reported in [5] for the real-world North-American and Mexican power grid, where the slopes are just a little lower (roughly 0.7 and −1.6).
ACKNOWLEDGEMENT
The authors acknowledge gratefully the support of BMBF, CoNDyNet, FK. 03SF0472A.
∗
[email protected] [1] Sabine Auer, Florian Steinke, Wang Chunsen, Andrei Szabo, Rudolf Sollacher, and Siemens Corporate Technology. Can Distribution Grids Significantly Contribute to Transmission Grids’ Voltage Management? submitted, 2016. [2] F. Marten, K. Diwold, L. Lower, L.M. Faiella, P. Hochloff, L.H. Hansen, and M. Braun. Analysis of a reactive power exchange between distribution and transmission grids. Intelligent Energy Syst. (IWES), 2013 IEEE International Workshop on, pages 52–57, 2013. [3] DENA. Ausbau- und Innovationsbedarf der Stromverteilnetze in Deutschland bis 2030. 2012. [4] Paul Schultz, Jobst Heitzig, and J¨ urgen Kurths. A random growth model for power grids and other spatially embedded infrastructure networks. EPJ Special Topics, 223(12):2593–2610, September 2014. [5] Saleh Soltan and Gil Zussman. Generation of Synthetic Spatially Embedded Power Grid Networks. arXiv preprint, pages 1–10, August 2015. [6] Peter J Menck, Jobst Heitzig, Norbert Marwan, and J¨ urgen Kurths. How basin stability complements the linear-stability paradigm. Nat. Phys., 9(2):89–92, 2013. [7] Peter J Menck, Jobst Heitzig, J¨ urgen Kurths, and Hans Joachim Schellnhuber. How Dead Ends Undermine Power Grid Stability. Nat. Commun., 5:3969, 2014. [8] Paul Schultz, Jobst Heitzig, and J¨ urgen Kurths. Detours around basin stability in power networks. New J. Phys., 16:125001, 2014. [9] Anton Plietzsch, Paul Schultz, Jobst Heitzig, and J¨ urgen Kurths. Local vs global redundancy. tradeoffs between resilience against cascading failures and frequency stability. 2015. [10] Jan Nitzbon, Paul Schultz, Jobst Heitzig, J¨ urgen Kurths, and Frank Hellmann. Deciphering the imprint of topology on nonlinear dynamical network stability. arXiv preprint, dec 2016. [11] Sergey V Buldyrev, Roni Parshani, Gerald Paul, H Eugene Stanley, and Shlomo Havlin. Catastrophic cascade of failures in interdependent networks. Nature, 464 (7291):1025–1028, April 2010. [12] Jia Shao, Sergey V. Buldyrev, Shlomo Havlin, and H. Eugene Stanley. Cascade of failures in coupled network systems with multiple support-dependence relations. Phys. Rev. E, 83(3):036116, mar 2011.
7
FIG. 2: Example of a three-level network with 50,000 nodes and moderate spatial clustering, grown in three phases: (i) a minimal spanning tree (MST) of 500 nodes in the lower level (grey); (ii) a MST of 250 nodes in the middle level (blue); (iii) a MST of 100 nodes in the upper level (red), followed by growing and connecting 250 red, 2400 blue and 46,500 grey nodes. Pictured is the spatial projection network P(G). The lower level contains no redundant edges and is thus a union of disjoint trees connected to the higher levels. Further parameters (see text): α` ≡ .05, β ` ≡ .5, γ ` ≡ .5, p = (.3, .1, 0), q = (.075, .075, 0), r = (1.5, .75, 0), u = (.1, .05, 0), s = (0, .05, .2).
[13] Charles D. Brummitt, Raissa M. D’Souza, and E. A. Leicht. Suppressing cascades of load in interdependent networks. Proc. Natl. Acad. Sci. U.S.A., 109(12):E680–9, March 2012.
[14] Jichang Zhao, Daqing Li, Hillel Sanhedrai, Reuven Cohen, and Shlomo Havlin. Spatio-temporal propagation of cascading overload failures in spatially embedded networks. Nat. Commun., 7:10094, January 2016.
8
105
level
low middle high
104 103
105
level
low middle high
104 103
102
(a)
degree
9.0
8.0
7.0
10.0
degree
6.0
5.0
4.0
3.0
101
2.0
1.0 2.0 3.0 4.0 5.0 6.0 7.0 8.0 9.0 10.0 11.0 12.0 13.0 14.0 15.0 16.0
100
1.0
102
101
(b)
FIG. 3: Degree distribution by level from ensembles of 50 multi-layer power grids created with (a) the GSC (b) the ILG model.
(a)
(b)
FIG. 4: Logarithmic edge length distribution by level from ensembles of 50 multi-layer power grids created with the (a) GSC (b) ILG model.
9 [15] Jianxi Gao, Sergey V. Buldyrev, H. Eugene Stanley, and Shlomo Havlin. Networks formed from interdependent networks. Nat. Phys., 8(1):40–48, December 2011. [16] Amir Bashan, Yehiel Berezin, Sergey V Buldyrev, and Shlomo Havlin. The extreme vulnerability of interdependent spatially embedded networks. Nat. Phys., 9(10): 667–672, August 2013. [17] S. Boccaletti, G. Bianconi, R. Criado, C.I. del Genio, J. G´ omez-Garde˜ nes, M. Romance, I. Sendi˜ na-Nadal, Z. Wang, and M. Zanin. The structure and dynamics of multilayer networks. Phys. Rep., 544(1):1–122, November 2014. [18] Manlio De Domenico, Clara Granell, Mason A. Porter, and Alex Arenas. The physics of multilayer networks. pages 1–22, April 2016. [19] Leonardo Due˜ nas-osorio, James I Craig, and Barry J Goodno. Probabilistic response of interdependent infrastructure networks. Network, pages 28–30, 2004. [20] J. F. Donges, H. C H Schultz, N. Marwan, Y. Zou, and J. Kurths. Investigating the topology of interacting networks: Theory and application to coupled climate subnetworks. EPJ B, 84(4):635–651, 2011. [21] P. Van Mieghem. Interconnectivity structure of a general interdependent network. Phys. Rev. E, 93(4):042305, 2016. [22] Mart´ı Rosas-Casals, Sergi Valverde, and Ricard V. Sol´e. Topological vulnerability of the European power grid under errors and attacks. InterNatl. J. (Wash.) of Bifurcation and Chaos, 17(07):2465–2475, July 2007. [23] Mart´ı Rosas-Casals. Topological complexity of the electricity transmission network. Implications in the sustain-
[24]
[25]
[26] [27]
[28]
[29]
[30] [31] [32]
[33]
ability paradigm. PhD thesis, Universitat Polit`ecnica de Catalunya, 2009. Giuliano Andrea Pagani and Marco Aiello. Towards decentralization: A topological investigation of the medium and low voltage grids. IEEE Transactions on Smart Grid, 2(3):538–547, sep 2011. Giuliano Andrea Pagani and Marco Aiello. The Power Grid as a complex network: A survey. Physica A, 392: 2688–2700, 2013. Albert-L´ aszl´ o Barab´ asi and Reka Albert. Emergence of scaling in random networks. science, 286(5439):11, 1999. Regino Criado, Julio Flores, Alejandro Garc´ıa del Amo, Jes´ us G´ omez-Garde˜ nes, and Miguel Romance. A mathematical model for networks with structures in the mesoscale. International Journal of Computer Mathematics, 89(3):291–309, feb 2012. V. Nicosia, G. Bianconi, V. Latora, and M. Barthelemy. Growing multiplex networks. Physical Review Letters, 111(5):1–5, 2013. Peng Wang, Garry Robins, Philippa Pattison, and Emmanuel Lazega. Exponential random graph models for multilevel networks. Social Networks, 35(1):96–115, jan 2013. 50Hertz. Beginn der elektrifizierung in deutschland. BURN. The electricity grid: A history. online. Erkki Lakervi and Edward J Holmes. Electricity distribution network design. Number 21 in IEEE Power Series. IET, 2nd edition, 1995. Emanuele Strano, Vincenzo Nicosia, Vito Latora, Sergio Porta, and Marc Barth´elemy. Elementary processes governing the evolution of road networks. Sci. Rep., 2:1–8, March 2012.
10
105
105
level
low middle high
104 103
level
low middle high
104 103
102
(a)
5.82
5.19
log 10 edge length
4.57
3.94
3.32
2.69
2.06
1.44
101
0.81
4.09
3.64
log 10 edge length
3.2
2.76
2.31
1.87
1.43
0.98
0.54
0.09
100
0.18
102
101
(b)
FIG. 5: Logarithmic edge length distribution by level from ensembles of 50 multi-layer power grids created with the (a) GSC (b) ILG model.