A Network-Oriented Modeling Approach to Voting Behavior During the 2016 US Presidential Election Linford Goedschalk, Jan Treur, Roos Verwolf Behavioural Informatics Group, Vrije Universiteit Amsterdam
[email protected],
[email protected],
[email protected]
Abstract. In this paper a network-oriented computational model is presented for voting intentions over time specifically for the race between Donald Trump and Hillary Clinton in the 2016 US presidential election. The focus was on the role of social and mass communication media and the statements made by Donald Trump or Hillary Clinton during their speeches. The aim was to investigate the influence on the voting intentions and the final voting. Sentiment analysis was performed to check whether the statements were high or low in language intensity. Simulation experiments using parameter tuning were compared to real world data (3 election polls until the 8th of November).
1. Introduction The United States presidential election of 2016 was a much-debated subject. On November 8 Americans elected, in contrast to what was expected, Donald Trump as the 45th president of the United States. Such processes and the role of social and mass communication media are more and more investigated; see, for example, (Ahmadian, Azarshahi, and Paulhus, 2017; Conway, Kenski, and Wang, 2013; Conway, Kenski, and Wang, 2015; Jungherr, 2016; Lilleker and Jackson, 2011; Towner and Dulio, 2012). In particular, statements in speeches of Donald Trump or other candidates can have an influence on the voting behaviour of the American citizens. For example, PoliZette states that (based on the LA Times/USC daily tracking poll) Trump jumped 10 points with black voters after his Milwaukee speech on the 16th of August 1 . In this speech, Trump said: “I am asking for the vote of every African-American citizen struggling in our country today who wants a different future”. Presidential candidates use different language intensity in different situations and the effects of these depend on each other (Clementson, Pascual-Ferra, & Beatty, 2016). During times of economic hardships, people consider a presidential candidate trust-worthier and more presidentiality when he uses high intensity language and during stable economic times, the use
1
https://www.lifezette.com/polizette/milwaukee-trump- jumps-10-points-black-voters/
adfa, p. 1, 2011. © Springer-Verlag Berlin Heidelberg 2017
of low intensity language will make the candidate seem trust-worthier and more presidential. Language intensity depends on directness toward the audience and emotionalism of word choice. High intensity language is personalized, specific, assertive and explicitly directed at the audience and low intensity language uses indirect messages that are more ambiguous, unclear and imprecise. A paper by Iyengar and Simon discusses the resonance model, which considers the relationship between the message content (of a presidential campaign) and the receivers’ predispositions (Iyengar & Simon, 2000). A predisposition is for example party identification. In this model it is the interaction between the content of a message and the predisposition that controls the reinforcement or ‘polarization’ effect. Intense partisans will not need a lot of reinforcement, will resist messages that are counter attitudinal and accept consonant messages. Less-intense partisans however will move the most between parties during campaigns. The voters’ partisanship extends beyond the mere fact that Republicans will be more responsive to the Republican candidate and vice-versa. Voters also acquire beliefs about the groups served by the political parties and the issues or problems on which they will deliver. The goal of this paper is to present an agent-based computational model to simulate voting intentions over time. It takes into account agents representing persons from different ethnic groups and different mental states within these agents. The computational model was designed by a Network-Oriented Modelling approach based on temporal-causal networks; (Treur, 2016a). This is a generic and declarative dynamic AI modelling approach based on networks of causal relations (e.g., Kuipers, 1984; Pearl, 2000), that incorporates a continuous time dimension to model dynamics, as also advocated in (Port and van Gelder, 1995). The model was related to poll data of the 2016 US presidential election, specifically the race between Donald Trump and Hillary Clinton, and the influence of statements made by Donald Trump or Hillary Clinton during their speeches. Sentiment analysis was performed to check whether the statements were high or low in language intensity.
2. Domain Knowledge: Polls and Speeches The speeches of Donald Trump and Hillary Clinton have influenced the opinion people have about these candidates. In a speech, a candidate is able to use high or low intensity language. Depending on the use of language and on their economic situation people consider a candidate as more or less trustworthy and presidential. In this research multiple speeches where analyzed with the use of an online sentiment analyzer tool2. The tool computes a score that reflects the overall sentiment, tone or emotional feeling of the speech given as input. The score ranges from -100 to +100 where -100 indicates a very negative or serious tone and +100 indicates a very positive of enthusiastic tone. For now it is assumed that this score reflects the language intensity that is used by the candidate. Three polls conducted by McClatchy-Marist where used to check the voting be-
2
http://www.danielsoper.com/sentimentanalysis/
havior at different times, see the Appendix for the polls. The answers (in percentages) on the question “If November’s presidential election were held today, whom would you support if the candidates are:” were used to see whom people would vote for. The possible answers were: “Hillary Clinton, the Democrat”, “Donald Trump, the Republican”, “Gary Johnson, the Libertarian”, “Jill Stein, of the Green Party”, “Other”, “Undecided”. The first poll of 1132 was con- ducted from the first of August through August the third. The interviews were performed by phone. The second poll consisted out of 1298 adults and was conducted from September 15th through September 20th. The third and last poll consisted out of 1587 adults and was conducted from Novem- ber 1st through November 3rd. Eighteen speeches were analyzed: three for every candidate in the time period before a conducted poll. The first speech on the 22nd of June given by Donald Trump had a sentiment score of 14 (the overall sentiment or tone of the speech was somewhat positive/enthusiastic), for the transcript of the speeches, see appendix. The second speech on the 21st of July had a sentiment score of 9.4 (the overall sentiment or tone of the speech was essentially neutral). The third speech on the 27th of July had a sentiment score of -32.2 (the overall sentiment or tone of the speech was some- what negative/serious). The speeches given by Hillary Clinton on the 7th of June and the 18th and 28th of July had scores of -4.2, -7.9, -8.8 which means that the overall sentiment or tone for all of these speeches was essentially neutral. The first speech given by Trump during the time period after the first poll and before the second poll, the 18th of August, had a sentiment score of 14.2 (the overall sentiment or tone of the speech was somewhat positive/enthusiastic). The second and third speech on the 31st of August and the 15th of September had a score of -8.2 and -7.3: the overall sentiment or tone of the speech was essentially neutral. For Clinton in the same time period all three speeches were essentially neutral with score of -8.9, -7.0, and -6.9. The first speech given by Trump during the last period, after the second poll and before the third, the 2nd of October, had a sentiment score of 66.8 (the overall sentiment or tone of this speech was quite positive/enthusiastic). The second and third speech on the 13th of October and the 22nd had a score of -8.7 and -6.9 (the overall sentiment or tone of these speeches were essentially neutral). The three speeches given by Clinton during the third period on the 3rd, the 11th and the 26th of October had scores of -8.8, 2.9, and 8.9 (the overall sentiment or tone of the speeches were essentially neutral). The polls will serve as empirical data to check in how far the model is a good representation of the voting behavior.
3.
The Designed Temporal-Causal Network Model
Temporal-causal network models can be represented at two levels: by a conceptual representation and by a numerical representation. These model representations can be used to display graphical network pictures, but also for numerical simulation. Furthermore, they can be analyzed mathematically and validated by comparing their simulation results to empirical data. Moreover, they usually include a number of parameters for domain, person, or social context-specific characteristics. To estimate values for such parameters, parameter tuning methods are available. A conceptual representation of a temporal-causal network model in the first place
involves representing in a declarative manner (agent) states and connections between them that represent (causal) impacts of states on each other, as assumed to hold for the application domain addressed. The states are assumed to have (activation) levels that vary over time. Three main elements in the Network-Oriented Modelling approach based on temporal-causal networks, and which constitute a conceptual representation of a temporal-causal network model are the following (see Treur, 2016a) or (Treur, 2016b): Connection weight X,Y Each connection from a state X to a state Y has a connection weight value X,Y representing the strength of the connection. Combination function cY(..) For each state a combination function cY(..) is used to combine the causal impacts of other states on state Y. Speed factor Y For each state Y a speed factor Y is used to represent how fast a state is changing upon causal impact. Combination functions in general are similar to the functions used in a static manner in the (deterministic) Structural Causal Model perspective described, for example, in (Wright, 1921; Pearl, 2000), but in the Network-Oriented Modelling approach described here they are used in a dynamic manner, as will be pointed out below briefly. A conceptual representation of temporal-causal network model can be transformed in a systematic or even automated manner into a numerical representation of the model as follows (Treur, 2016a): at each time point t each state Y has a real number value Y(t) in [0, 1] at each time point t each state X connected to state Y has an impact on Y defined as impactX,Y(t) = X,Y X(t) where X,Y is the connection weight The aggregated impact of multiple states Xi on Y at t is determined by: aggimpactY(t) = cY(impactX1,Y(t), …, impactXk,Y(t)) = cY(X1,YX1(t), …, Xk,YXk(t)) where Xi are the states with connections to state Y The effect of aggimpactY(t) on Y is exerted over time gradually: Y(t+t) = Y(t) + Y [aggimpactY(t) - Y(t)] t or dY(t)/dt = Y [aggimpactY(t) - Y(t)] Thus, the following difference and differential equation for Y are obtained: Y(t+t) = Y(t) + Y [cY(X1,YX1(t), …, Xk,YXk(t)) - Y(t)] t dY(t)/dt = Y [cY(X1,YX1(t), …, Xk,YXk(t)) - Y(t)] An example of a combination function cY(V1, …, Vk) is the scaled sum function (with scaling factor > 0): ssum(V1, …, Vk) = (V1 + … + Vk)/ Another example is the advanced logistic sum function (with , ≥ 0 steepness and threshold values): +..+Vk -) alogistic,(V1, …, Vk) = [(1/(1+e - (V1 ) - (1/(1+e))] (1+e -) Based on what has been gathered from the literature discussed above, an agent-based temporal-causal network model has been designed featuring for each agent the following mental states: • Statement made (Clinton/Trump) • Predisposition (Clinton/Trump)
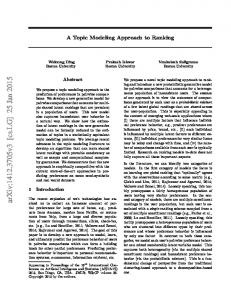
• Emotion level • Level of education • Economic status • Interpretation of the statement (Clinton/Trump) • Intention to vote (Clinton/Trump) • Vote (Clinton/Trump) The conceptual representation of the model is depicted in Figure 1.
Figure 1: Overview of the conceptual representation of the model Within the agents the different mental states are connected according to some intraagent network, which models the agent’s mental (cognitive and affective) processes; see the connections with each of the boxes in Fig. 1. The agents are assumed to belong to certain ethnic groups. Within these groups many connections occur, whereas between different ethnic groups there are less connections. These ethnic groups have been selected based on groups that were specified in the McClatchy-Marist poll: White, African American, Latino. Ethnic groups can differ on all states described above. The predisposition of African Americans towards Trump is probably different
from the predisposition of whites. There can be contagion between groups when a person of one group has a connection (bridge) with a person from an different ethnic group. Due to Matlab restrictions (that was used for implementing the model) only a divide between whites and non-whites was made. The African Americans and Latinos were considered as one group due to these limitations. As each agent involves 11 mental states, the total amount of variables to keep track of rapidly increases. The connections between different agents are a basis for contagion between these agents. This takes place simultaneously for different mental states: emotions, intentions, and predispositions (see the inter-agent connections in Fig. 1). The model features two input states that represent the statements made by the candidates. The language intensity score that is obtained through sentiment analysis will serve as the value for these states. Over time statements will be made and thus the model will see a spike in values for these states as a value is only ascribed to the state on the point in time that the candidate gave a speech. For the other points in time the value of the input states will simply be 0, and so it is assumed there is basically no other information for the voters to base their decision on in terms of statements of the candidates themselves. The value of these states ranges from 0 to 1 and is determined by dividing the language intensity score by 100. These statements can be interpreted by the voters in different ways. This interpretation is based on different factors depending on person-specific characteristics, and forms one of the core concepts of the model of every specific agent. The emotion level, predisposition for a certain candidate, level of education, economic status, and intention to vote for a certain candidate all influence the interpretation. The value of this state ranges from 0 to 1 and the updates for this value uses the advanced logistic combination function. This way, whenever a certain threshold is reached, the value of this state switches between a low value (value below threshold, negative interpretation of the statement) or high value (value above threshold, positive interpretation of the statement). The interpretation of the statement of a certain candidate influences the intention of voters to vote for that candidate. A more negative interpretation of the statement will result in a decreased intention to vote for the corresponding candidate. The level of education, economic status and emotional level are all properties of the voter that influence the way they interpret statements made by the candidates. Safe for the latter one, the value of these states are constant. The level of education and economic status will influence the interpretation of the statement in a negative way. The higher the value for these states, the lower the value of the interpretation. This comes from the understanding that these kinds of people are less likely to take politicians at face value and seek more argumentation before being convinced by them. The emotion level of a person influences the interpretation of the statement in a positive way based on the belief that a positive emotional state will allow for people to accept what others say more quickly. Predisposition, just like emotion, education and economic status, influences the interpretation of the statement. A high predisposition towards one of the candidates will positively influence the interpretation a voter has of statements that were made by that candidate. The intention to vote influences the actual voting for a candidate. In this process a voting intention for one candidate can suppress the voting for the other candidate. It also influences the predisposition for a candidate under the assumption that if someone intends to vote for a candidate they also like the candidate more. Therefore there is a
two-way interaction between these two states. The intention to vote for one candidate has a inhibiting effect on the intention to vote for the other candidate. Like the other states in the model the values for the actual vote states range from 0 to 1. There are three possible outcomes for each person in terms of how they vote. Whenever one of the states has a high value this means that the agent voted for the corresponding candidate. Whenever both states have high values this indicates that the agent would like to vote for both candidates. This is obviously not possible and thus interpreted as the agent being unable to decide between them. Low values for both states indicates that the agent does not intend to vote at all. This resembles the options that were presented during the polls of the presidential elections as well. The notations of the states in the numerical representation of the network model slightly differ from the one used in Fig. 1. Table 1 displays the states in the numerical representation. The notation Statei , ..., Statek indicates that the state of the current agent is used together with that same state from other agents that have a relation with the current agent. Table 1: State
Numerical representation of states Numerical representation
Statement (Clinton, Trump) Predisposition (Clinton, Trump) Interpretation of statement (Clinton, Trump) Emotion Level of education Economic status Intention to vote (Clinton, Trump) Vote (Clinton, Trump)
StatC, StatT PreC, PreT InpC, InpT Emotion Education Economic InvC, InvT VoteC, VoteT
Examples of numerical representations, of the interpretation of a statement (Clinton, Trump) and the emotion state within one agent: InpC(t + ∆t) = InpC(t) +
ηInpC [ alogistic(ωStatC,InpC StatC(t), ωEmotion,InpC Emotion(t), ωEducation,InpC Education(t), ωEconomic, InpC Economic(t), ωPreC, InpC PreC(t)) − InpC (t)] ∆t Emotion(t + ∆t) = Emotion(t) + ηEmotion [alogistic(ωEmotion1 Emotion1(t), ..., ωEmotionk Emotionk(t)) − Emotion(t)] ∆t
The other numerical representations are similar, given the conceptual representation of the network model.
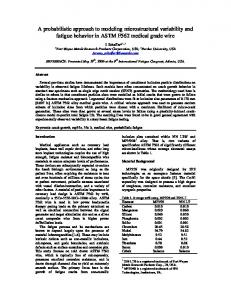
5. Simulation Experiments The model was tested by a simulation experiment. A scenario was simulated in which two groups (whites and non-whites), each of 4 agents reacted to the statements made by Hillary Clinton and Donald Trump. The two groups were only connected to each other through a ‘bridge’ between agent 4 and 5; see Fig. 2. The initial values for the interpretation of statements and the vote states have been set to 0. It is assumed that no statements prior to the simulation are being interpreted and that people have not yet decided on who to vote. The initial values for the other states were randomly chosen since in reality people would differ from each other as well and in this current scenar-
io the connection between agents is already manipulated. Manipulating initial values of other states as well to, for example, have a group of Clinton supporters and a group of Trump supporters would introduce an extra independent variable. The speed factor values were all 0.5 except for the voting states for Trump or Clinton. Actually voting is a slower process so the chosen value was 0.2. For the initial values of all states, see the Appendix. The combination functions were all advanced logistic, except for emotion. This was a scaled sum of all the connections with the other persons in the model (for all persons 4, except for person X4 and X5 who also had a connection with each other; they had a scaled sum of 5).
Fig. 2: The two groups of agents in the scenario 5.1 Results of the Simulation Experiment Fig. 3 (a) to (l) shows the simulation results after parameter tuning was performed on the speed factors of the states. In this figure, the Economics and Education states (a) and (b) are constant since it is assumed these do not change in 155 days. Emotion (f), which is a contagion state, seems to converge to a low value. This might be explained by the emotion state being influenced by the emotion of others and the majority of agents starting with low emotional states. The Predisposition Clinton and Trump (c) and (d) converge to 1, Predisposition Trump converges faster than Predisposition Clinton. This indicates that eventually all agents will like both candidates but the likeability for increases more rapidly. Interpretation of the statements that Trump made are quite different from the interpretation of the statements Clinton made (g) and (h). The interpretation of speeches varies and the predisposition and emotion of a person influences this interpretation together with the two constant states. This fluctuation is likely the result of the varying language intensity of the statements made by both candidates. It is interesting to see that Hillary Clinton only has statements with a negative language intensity score yet still, there are several agents who almost always interpret her statements as positive or negative. Two Agents change their overall opinion of the statements from negative to positive but in two very different ways. This behaviour can be attributed to the different speed factors that the two agents ended up having after parameter tuning. For the interpretation of statements made by Donald Trump we see that one person changed their interpretation of his statements from positive to negative, which is one less person that switched than for Hillary Clinton. This might be due to the fact that predisposition for him is high early on in the simulation. The intention to vote (i) and (j) for all 8 persons converges over time to 1 for both Clinton and Trump. That means that they would all have the intention to vote for Clinton and Trump. However, looking at the votes in the end, only one person votes for
Trump (X3) and no one for Clinton (k) and (l). This means that in this simulation almost every agent decided not to cast a vote at all. Something that is very remarkable about these results is that there is no noticeable reaction to the second last statement of Donald Trump that has a relatively high language intensity score. It is unclear what causes this lack of reaction.
(a) Economics
(b) Education
(c) Predisposition Clinton
(d) Predisposition Trump
(e) Statements
(f) Emotion
(g) Interpretation Clinton
(h) Interpretation Trump
(i) Intention to vote Clinton
(j) Intention to vote Trump
(k) Voting Clinton
(l) Voting Trump
Figure 3: Simulation results
6.
Verification of the Network Model by Mathematical Analysis
To verify the model, a mathematical analysis of stationary points of the network model was done. A state Y has a stationary point at some point in time t if dY(t)/dt = 0. An equilibrium occurs at when there is no change for all states. For the dynamics of any model described by a temporal-cauasal network from the specific the differential or difference equations it can be analysed that state Y has a stationary point at t if and
only if (see also (Treur, 2016c) or (Treur, 2016a, Ch 12)): cY(X1,YX1(t), …, Xk,YXk(t)) = Y(t) where X1 , ..., Xk are the states with connections to state Y. The current model doesn’t come into a equilibrium where there is no change for all states. However, there are states that have a stationary point. For example, the state Emotion which is modeled by a scaled sum combination function. The equation expressing that the state Emotion for X1 is stationary at time t = 155 is: (X1,Y X1(155) + … + Xk,Y Xk(155))/4 = Y(155) The left hand side is: (1∗ 0.2290559+1∗ 0.1751461+1∗0.246681258+1∗ 0.222314)/4 = 0.21829931 The value of Emotion for X1 at time t = 155 is 0.2290559, so the equation holds with accuracy < 10-2 . The stationary point equations for X2 , X3 , X6 , X7 , X8 are similar to the equation above. The connection between X4 and X5 forms a bridge which means that the scale factor here is 5 instead of 4. From the checks on stationary points explained above that have been performed in this way, it was found that they succeed, which contributes evidence that the model was implemented in a correct manner.
7. Parameter Tuning and Validation Parameter tuning was performed using the optimizer tool in Matlab 3. The tool offers parameter tuning through simulated annealing. Using this tool the speed factors of the 90 states that have been used were analysed. In addition to the speed factors the parameters used in the advanced logistic combination function could also have been tuned; however, due to the large amount of parameters, it was decided to only use parameter tuning for the speed factors. In the appendix the optimal values for the speed factors that were found through simulated annealing have been listed. The different speed factors the agents end up having would resemble the ability of one agent to process certain information faster than the other. For validation, the results of the values retrieved with the model were compared to the values of the three McClatchy-Marist polls. In the first poll (conducted from the first of August to the third) 35% of the whites would support Hillary Clinton if the November’s presidential election were held that day. 39% of the whites would support Donald Trump. For African Americans and Latinos together 67% would support Hillary Clinton and 11% would support Donald Trump (calculation was done by adding the two percentages, dividing it by 200 and then times 100 for a percentage). In the second poll conducted from the 15th until the 20th of September, 35% of the whites responded with Hillary Clinton on the question: “2016 presidential election including those who are undecided yet leaning toward a candidate”. 49% of the whites answered with Donald Trump. For the African Americans and Latinos together, 76,5 % supported Hillary Clinton and 8,5% supported Donald Trump. In the third and last poll conducted from the 1st of November through the 3rd, 39% of the whites responded with Hillary Clinton on the question: “2016 presidential election including those who are
3
https://nl.mathworks.com/help/optim/ug/optimtool.html
undecided yet leaning toward a candidate or already voted”. 50% of the whites answered with Donald Trump. For the African Americans and Latinos together, 71,5% supported Hillary Clinton and 19,5% supported Donald Trump. Table 2 shows the values in terms of percentages from the polls, absolute values in terms of the number of agents used in the simulation and number of agents that voted for the candidate in the simulation. Comparing the absolute values to the simulated values it can be seen that out of the 12 comparisons only 2 match. This indicates that there is room for improvement of the model.
7. Discussion After comparing the absolute values to the simulated values it turns out that the current model does not predict the real world in an accurate manner. Future research should focus on a number of issues. First, finding a better way to determine the language intensity score of the statements made by the candidates. For the current model different scenarios could be developed in which agents would, for example, have a connection to all other agents or a division in groups can be based on predisposition for a certain candidate. Most of all, the number of agents that could be used in the simulation is very important. In order to be able to compare the data more easily to the poll data, 100 agents could be used. This way a lot more ethnic groups could be created and the model could resemble reality much more.
References Ahmadian, S., Azarshahi, S., Paulhus, D.L. (2017). Explaining Donald Trump via communication style: Grandiosity, informality, and dynamism. Personality and Individual Differences 107 (2017) 49–53 Clementson, D. E., Pascual-Ferra, P., & Beatty, M. J. (2016). When does a presidential candidate seem presidential and trustworthy? Campaign messages through the lens of language expectancy theory. Presidential Studies Quarterly , 46 (3), 592–617. Conway, B. A., Kenski, K., & Wang, D. (2013). Twitter use by presidential primary candidates during the 2012 campaign. American Behavioral Scientist, 57(11), 1596–1610. doi:10.1177/0002764213489014 Conway, B. A., Kenski, K., & Wang, D. (2015). The rise of Twitter in the political campaign: Searching for intermedia agenda-setting effects in the presidential primary. Journal of Computer-Mediated Communication. 20, 363–380. Advance online publication. doi:10.1111/jcc4.12124 Iyengar, S., & Simon, A. F. (2000). New perspectives and evidence on political communication and campaign effects. Annual review of psychology, 51 (1), 149–169. Jungherr, A. (2016). Twitter use in election campaigns: A systematic literature review. Journal of Information Technology & Politics, 13, 72–91. Kuipers, B.J., (1984). Commonsense reasoning about causality: Deriving behavior from structure, Artificial Intelligence 24 (1984) 169-203. Lilleker, D. G. and N. A. Jackson. (2011). Political campaigning, elections and the Internet: Comparing the U.S., U.K., France and Germany. New York: Routledge. Pearl, J., (2000). Causality. Cambridge University Press, 2000. Port, R.F., & van Gelder, T. (1995). Mind as motion: Explorations in the dynamics of cognition. Cambridge, MA: MIT Press.
Towner, T.L. and Dulio, D.A. (2012), “New media and political marketing in the United States: 2012 and beyond”, Journal of Political Marketing, Vol. 11 Nos 1/2, pp. 95-119. Treur, J. (2016a). Network-Oriented Modeling: Addressing Complexity of Cognitive, Affective and Social Interactions. Springer Publishers, 2016. Treur, J. (2016b). Dynamic Modeling Based on a Temporal-Causal Network Modeling Approach. Biologically Inspired Cognitive Architectures, 16, 131-168. Treur, J. (2016c). Verification of Temporal-Causal Network Models by Mathematical Analysis. Vietnam Journal of Computer Science, 3, 207-221 (2016) Wright, S. (1921) Correlation and Causation. Journal of Agricultural Research, 20, 557-585
Appendix Polls by McClatchy-Marist First poll: https://www.scribd.com/document/320225575/McClatchy-Marist-Poll-National-Nature-of-theSample-and-Tables-August-2016 Second poll: http://www.mcclatchydc.com/news/politicsgovernment/election/article103597232.ece/BINARY/The\%20full\\%20McClatchyMarist\%20poll Third poll: http://www.mcclatchydc.com/news/politicsgovernment/election/article112635043.ece/BINARY/Full\%20poll\\%20results
Transcripts of Donald Trump June 22nd: http://www.politico.com/story/2016/06/transcript-trump-speech-on-the-stakes-of-the-election224654 July 21st: http://www.politico.com/story/2016/07/full-transcript-donald-trump-nomination-acceptancespeech-at-rnc-225974 July 27th: https://www.washingtonpost.com/news/the-fix/wp/2016/07/27/donald-trumps-falsehood-ladenpress-conference-annotated August 18th: http://www.realclearpolitics.com/video/2016/08/18/watch_live_donald_trump_gives_first_cam paign_speech_since_hiring_stephen_bannon.html August 31st: http://www.latimes.com/politics/la-na-pol-donald-trump-immigration-speech-transcript20160831-snap-htmlstory.html September 15th: http://time.com/4495507/donald-trump-economy-speech-transcript/
October 2nd: http://thoughtsonthedead.com/transcript-of-donald-j-trumps-speech-in-manheim-pa-10116/ October 13th: http://www.npr.org/2016/10/13/497857068/transcript-donald-trumps-speech-responding-toassault-accusations October 22nd: http://www.whatthefolly.com/2016/10/26/transcript-donald-trumps-speech-in-gettysburgpennsylvania-part-1/ Transcripts of Hillary Clinton June 7th: http://bluenationreview.com/full-transcript-of-hillary-clintons-june-7-victory-speech/July 18th: http://fortune.com/2016/07/18/hillary-clinton-speech-naacp-transcript/ July 28th: http://www.nytimes.com/2016/07/29/us/politics/hillary-clinton-dnc-transcript.html?_r=0 August 11th: http://europe.newsweek.com/hillary-clinton-full-transcript-economic-speech-489602?rm=eu August 25th: http://www.politico.com/story/2016/08/transcript-hillary-clinton-alt-right-reno-227419 September 15th: http://www.whatthefolly.com/2016/09/15/transcript-hillary-clintons-speech-in-greensboronorth-carolina-part-1/ October 3rd: http://www.presidency.ucsb.edu/ws/index.php?pid=119154 October 11th: http://www.dispatch.com/content/stories/local/2016/10/11/hillary-clintons-speech-at-ohiostate.html October 26th: http://www.presidency.ucsb.edu/ws/index.php?pid=119693