Behaviour & Information Technology, 2014 http://dx.doi.org/10.1080/0144929X.2014.921728
A neural network-based approach for user experience assessment A. Amanatiadisa∗ , N. Mitsinisb and D. Maditinosb a Department
of Production and Management Engineering, School of Engineering, Democritus University of Thrace, 12 Vas. Sofias Str, GR-67100, Xanthi, Greece; b Department of Business Administration, School of Business and Economics, Technological Educational Institute of Kavala, Agios Loukas, GR-65404, Kavala, Greece (Received 22 December 2012; accepted 17 April 2014 ) The objective of this study is to approximate the links between user satisfaction and its determinants without having the restrictions of common statistical procedures such as linearity, symmetry and normality. For this reason, artificial neural networks are utilised and trained with the observations of an extensive survey on user satisfaction with respect to website attributes. Each observation includes evaluations about the performance of 18 specific and 9 general website attributes as well as an evaluation about overall user satisfaction. The analysis results indicate that website attributes present different impacts on satisfaction whereas the relationships found feature both asymmetry and nonlinearity. Finally, function approximation using neural networks is found to be appropriate for estimating such kind of relationships providing valuable information about satisfaction’s formation. Keywords: user satisfaction; experience assessment; asymmetry; nonlinearity; neural networks
1. Introduction The popularity of computer technology has brought great changes in the field of the Internet. The web has evolved into an environment for a wide range of activities, including entertainment, communication, commerce, information search and many others. Furthermore, during the last decade the number of Internet users as well as the number of websites has tremendously increased and is expected to rise even more in the next years (Stewart 2012). These circumstances have increased the necessity for accurate determination of the factors that make a website effective and successful. User satisfaction has been acknowledged as the most useful metric of system success because there is lack of other measures which present high degree of face validity (DeLone and McLean 1992; Hassenzahl and Tractinsky 2006). Satisfied users may spend more time at a website, tend to revisit it and spread the news about their satisfaction. In general, user satisfaction may lead to an increase in retention, word of mouth, trust, loyalty and profitability. Therefore, it is crucial to determine what makes a user satisfied with a website (Kincl and Štrach 2012). Considering previous theories such as the two-factor theory (Hertzberg, Mausner, and Snyderman 1959), the disconfirmation expectation theory (Oliver 1977) and the three-factor theory (Kano et al. 1984), a novel approach can be chosen for the fulfilment of this purpose. The above theories claim that the impact of a website attribute on satisfaction may present different weights for different performances which means that their importance is ∗ Corresponding
author. Email:
[email protected]
© 2014 Taylor & Francis
subject to their performance. This fact leads to nonlinear and asymmetric relationships which are difficult to be estimated by using conventional econometric methods such as regression and structural equations analysis. For this reason, a new method is introduced, based on neural networks. More specifically, this paper tries to determine the relationship of overall user satisfaction with respect to website attributes. Satisfaction is a bi-dimensional attitude affected by a variety of attributes, also known as factors in the literature. The dimensionality and intensity of a user’s reaction to an attribute is that to be measured. That measurement will comprise the evaluation to the attribute, relative to the perceived evaluation metrics. The work exploits the experimental results of an extensive survey based on questionnaires. The objective of the survey was to distinguish the overall satisfaction of website users answering questions relevant to certain website attributes. During that survey a sample of 370 Internet users was asked to evaluate the performance of 18 specific and 9 general attributes as well as to claim their overall satisfaction on a nine-point scale anchored by very dissatisfied to very satisfied. The results were tested and validated through reliability and validity procedures indicating that there was a relationship structure since the defined general and specific website attributes introduced an association with user satisfaction. In this paper, we try to find out the relationship of overall satisfaction with specific website attributes by using neural networks for the functions approximation.
2
A. Amanatiadis et al.
Neural networks, having their origin in computational intelligence, can model both linear and nonlinear processes. The main components of an artificial neural network are highly interconnected elements (neurons) which work independently in parallel (Hassoun 1995; Yao 1999). Function approximation is the problem of estimating a function from a set of examples of its independent variables and function value. If there is prior knowledge of the type of function being learned, a mathematical model of the function can be constructed and the parameters perturbed until the best match is achieved. However, if there is no prior knowledge of the function, a model-free system such as a neural network may be employed to approximate an arbitrary nonlinear function (Behara, Fisher, and Lemmink 2002). A neural network inherent parallel computation is efficient for speed and the information learned is expressed in the weights of the network. For the purpose of this study, two feed-forward neural networks which have a hierarchical architecture are designed in order to represent the relationships between satisfaction and its attributes. The first one is used to predict nine general website attributes from 18 specific attributes while the second one predicts overall satisfaction having as input variables the nine general attributes. Although, these networks are trained separately, there is a strong connection between them since the outputs of the first network are the inputs for the second one. Therefore, it is possible to estimate the links between satisfaction and its specific attributes without having a complex and hard to train network, maintaining the level of error at very low levels. The rest of the paper is organised as follows. In Section 2, we give an overview of previous work in this area. In Section 3, we cover the methodologies employed to conduct our empirical survey, as well as the neural network architecture. In Section 4, we report the experimental results and findings of this research. Finally, we give concluding remarks in Section 5. 2. Related work A wide variety of researchers attempted to classify web attributes based on their very nature. According to the twofactor theory (Hertzberg, Mausner, and Snyderman 1959), attributes can be classified into hygiene (utility-preserving) and motivation (utility-enhancing) factors, depending on their underlying nature. The two-factor theory was adopted in Zhang et al. (1999) in order to explain the difference between satisfaction and dissatisfaction. It was found that hygiene factors are necessary to remove dissatisfaction, yet they do not lead to satisfaction. In contrast, satisfaction is determined by a group of intrinsic factors which are called motivators. The disadvantage of this theory is that some factors could be considered as either hygiene or motivating, depending on the individual differences. Another framework that has been frequently used for studies which regard satisfaction is the expectation
disconfirmation theory (Oliver 1977). The expectation disconfirmation theory explains the formation of satisfaction in terms of expectation, performance and disconfirmation. It proposes that users of a service or product have a standard of reference upon it which influences their judgement. Therefore, expectations are created and satisfaction is achieved in case they are met. In particular, satisfaction results if performance exceeds expectation (positive disconfirmation) while in case it falls below expectation (negative disconfirmation) then individuals become dissatisfied. There is also an area (zone of indifference) where performance matches expectations (zero disconfirmation) having no significant impact on satisfaction. However, this theory does not take into account the nature of expectations whether they are high or low. High expectations are more likely to be negatively disconfirmed while low expectations tend to be positively disconfirmed (Yi 1990). Therefore, the normative relationship between expectations and disconfirmation is negative. Desires rather than expectations should be used as a comparison standard in the disconfirmation process (Suh, Kim, and Lee 1994; Spreng, Mackenzie, and Olshavsky 1996). The formation of desire is not based on predictions of actual performances or expectations but focuses on emotional needs expressing what users want and desire. For example, users may desire from a website attribute to perform well but nevertheless based on their experiences and evaluation of current conditions they expect it to have low performance. According to the desire disconfirmation theory, poor performance may lead to dissatisfaction despite the fact that expectations about it are met (Sørum, Andersen, and Vatrapu 2012). Therefore, the comparison standard is not the actual or expected performance but the desired performance. On the other hand, the importance of both expectations and desires in explaining satisfaction is demonstrated in Chin and Lee (2000) as well as the need that both of them should be included as comparison standards for disconfirmation. Their conclusions are based on the fact that users hope that both their expectations and desires are fulfilled. In case, performances exceed the expected levels but not the desired levels, users may have feelings of dissatisfaction. On the contrary the case that performances meet the desired levels but fail to meet user expectations, may also lead to dissatisfaction. The model proposed in Kano et al. (1984) is a classification of attributes into three groups with a different impact on user satisfaction. The first group includes attributes called basic factors or ‘dissatisfiers’ which are minimum requirements and lead only to dissatisfaction in case of low performance. Basic factors are definitely expected and they may not lead to satisfaction even in case they are fulfiled or exceeded. The second group consists of attributes which enhance satisfaction in case of high performance but not cause dissatisfaction when they perform badly. These attributes are known as excitement factors or ‘satisfiers’
Behaviour & Information Technology and their result is based on the principle that pleasant surprises generate delight. The relationship between the performances of these attributes (basic and excitement factors) with overall satisfaction has been found to be asymmetric and nonlinear. On the contrary, the relationship between the attribute performances of the third group with satisfaction has been found to be symmetric and linear. This group includes performance factors which are attributes that lead to satisfaction in case performance is high and dissatisfaction if performance is low. Apart from the three principal categories, there is a group which includes attributes (indifferent attributes) that have no influence on satisfaction whether they perform well or badly (Berger et al. 1993). According to these theories one could argue that all attributes do not have same impacts on satisfaction. Thus, attributes could be classified into attributes which strongly affect satisfaction whether they perform well or badly and attributes that are performance related. Performance related means that the impact on satisfaction is dependent on the attribute performance. Furthermore, this positive–negative asymmetry effect has found great attention in the literature which regards the psychology sector. In general and apart from few exceptions, psychology suggests that bad events have greater impact than good ones. In Brickman and Campbell (1971) it is found that bad events wear off more slowly than good events. Moreover, in Diener et al. (1985) it is stated that negative effect and emotional distress had stronger impacts than positive effect and pleasant emotions. The effects of every-day good and bad events were examined and found that undesirable events affect more the individual’s mood than the desirable ones (David et al. 1997). The concept that bad events have a greater power over good ones in most sectors of life is supported in Baumeister et al. (2001). Researchers in many disciplines, including marketing and economics, have adopted the principle of positive– negative asymmetry in order to investigate user satisfaction (Amanatiadis et al. 2006). The asymmetric impact of website attribute performance on web satisfaction is examined assuming a linear relationship (Cheung and Lee 2005). It is found that there are different asymmetric impacts for different attributes. For example, negative performance of reliability, access and usability had a greater impact on overall satisfaction than positive performance. On the contrary, understandability, usefulness and navigation had a greater impact in case of positive performance. Other studies (Anderson and Sullivan 1993; Oliva, Oliver, and Bearden 1995; Mittal, Ross, and Baldasare 1998) have empirically demonstrated that negative effect has a greater impact on satisfaction than an equivalent unit of positive effect (negative asymmetry). For instance, in Anderson and Sullivan (1993) it is showed that negative disconfirmation has a greater influence on satisfaction than positive disconfirmation. Mittal, Ross, and Baldasare (1998) found the same asymmetric relationship although for one attribute a positive performance had a greater impact
3
than a negative one (positive asymmetry). In a follow-up study, it is found that asymmetry could be either of negative or positive nature (Anderson and Mittal 2000). It is suggested that positive asymmetry may occur when the perceived performance exceeds the usual, based on past experience performance which is expected from users. Thus, it is found that the links between satisfaction and its attributes could be nonlinear. Nonlinearity appears in the form of diminishing or increasing returns which means that each additional unit of increase has a smaller (diminishing returns) or a greater impact (increasing returns) if it is compared to the impact of the preceding unit of increase. Respectively, each additional unit of decrease has a stronger (diminishing returns) or a weaker impact (increasing returns) than the previous unit of decrease. Conventional econometric methods such as regression models and structural equation models have been used in order to estimate the parameters of such kind of models. However, these methods require a wide range of restrictive assumptions and estimations which have a great influence on the analysis’s outcome. A neural network function approximation approach is preferred against them for two main reasons. The first reason is that neural network development does not require knowledge of the underlying relationships between the input and output variables (West, Brockett, and Golden 1997; Tsai and Lu 2009). This is very important especially for the needs of this study which attempts to find out the pattern of these relationships (Behara, Fisher, and Lemmink 2002; Prakash, Mohanty, and Kallurkar 2011). The second reason is that the neural network performance is not diminished by violations of some assumptions such as normality, linearity and multi-collinearity, which constitute basic requirements for many statistical procedures (e.g. regression analysis) (Wray, Palmer, and Bejou 1994; Davies, Moutinho, and Curry 1996). 3. Research methodology 3.1. Survey The objectives and attributes of the survey are presented in detail. More precisely, the measurements, in terms of attributes, and the scaling used are first presented. The method analysis of the collected data is then defined. Finally, the instrument reliability and validity tests are presented as well as some methods followed to enhance reliability and validity. 3.1.1. Measures All the constructs for this study are related to three main categories. These categories are information quality, system quality and security-privacy as shown in Table 1. After defining the main categories, nine general website attributes that determine them are presented (Table 2). The construct selection is based on the works in McKinney,
4
A. Amanatiadis et al. Table 1.
The main categories used in the survey.
Name
Brief description
Information quality System quality Security-privacy Table 2.
The quality of information on websites (DeLone and McLean 2002; McKinney, Yoon, and Zahedi 2002) The quality of systems that enable interaction with websites (DeLone and McLean 2002; McKinney, Yoon, and Zahedi 2002; Lin and Lee 2006) The protection of users and website data (Kalakota and Whinston 1996; Ranganathan and Ganapathy 2002)
The general attributes used in the survey.
Name
Brief description
Understandability Reliability Usefulness Access Friendliness Navigation Interactivity Security Privacy Table 3.
The clearness and goodness of information on websites (Gefen 2002; McKinney, Yoon, and Zahedi 2002; Cheung and Lee 2005) The validity and soundness of information on websites (McKinney, Yoon, and Zahedi 2002; Kim, Shaw, and Schneider 2003; Cheung and Lee 2005) The effective use of information for a given purpose (Lu and Yeung 1998; Turban and Gehrke 2000; McKinney, Yoon, and Zahedi 2002) Easy and fast access to information on websites (McKinney, Yoon, and Zahedi 2002; Cheung and Lee 2005) It represents a user-friendly web environment (Khalifa and Liu 2002; McKinney, Yoon, and Zahedi 2002) Facilities that enable users to make their way through website pages (Rice 1997; McKinney, Yoon, and Zahedi 2002) It represents how direct is the communication (Palmer 2002; Teo et al. 2003) The protection of exchanged data from threats (Kalakota and Whinston 1996; Janda, Trocchia, and Gwinner 2002) The protection of user personal information when they visit websites (Huang, Lee, and Wang 1998)
Specific attributes used in the survey.
Name Easy to comprehend Well-presented Accurate Up-to-date Relevant Detailed Speed of access Availability Ease of use Well-organised Page-loading Hyperlinks Two-way communication Active control Confidentiality Integrity Protection Authorisation
Brief description The information is presented in such a way that is understandable (Aladwani and Palvia 2002) The representation of information published on websites (Palmer and Griffith 1998; Dedeke 2000; Sutcliffe and Namoun 2012) The content of information is accurate and precise (Madu and Madu 2002; Xiao and Dasgupta 2002) The information on websites is up-to-date (Huang, Lee, and Wang 1998; Madu and Madu 2002) The information is complete and relevant to users claims (Waite and Harrison 2002) The information is presented in detail (Anderson and Sullivan 1993) The time that is required for a user to access a website (Aladwani and Palvia 2002; Lee et al. 2002; Lindgaard et al. 2006) Websites are up-and-running whenever users want to access them (Nielsen 1999) It represents how easy is for users to use website features (Huang, Lee, and Wang 1998; Rai, Lang, and Welker 2002) A controlled and structured web environment (Nielsen 1999) The time that is required to load a web page (Turban and Gehrke 2000; Weinberg 2000) Links that enable users to navigate between internal and external websites (Radosevich 1997) Bi-directional flow of communication between users and websites (Novak, Hoffman, and Yung 2000; Lowry et al. 2006; Möller, Brezing, and Unz 2012) Users are able to determine and guide the interaction between them and websites (Novak, Hoffman, and Yung 2000; Lowry et al. 2006) Users personal information remain secret (Furnell and Karweni 1999; Warkentin et al. 2002) The data on websites are not corrupted or modified (Kalakota and Whinston 1996; Albuquerque and Belchior 2002) The data on websites are protected against viruses or malicious code (Kalakota and Whinston 1996) Websites permit only authorised access to specific information (Kalakota and Whinston 1996)
Yoon, and Zahedi (2002), Schenkman and Jönsson (2000) and Preece (2001). In particular, understandability, reliability and usefulness are chosen as determinants of information quality while access, user-friendliness, navigation and interactivity as determinants of system quality (Lin and Lee 2006). The constructs of the security-privacy category are security and privacy (Warkentin et al. 2002).
Subsequently, 18 specific attributes (two for each general attribute) are selected as shown in Table 3. Specifically, comprehensibility and presentation of information are considered components that may enhance understandability while accuracy and timeliness should mainly influence reliability. Thus, the fact that the information is relevant and in detail is expected to affect its usefulness. On the other
Behaviour & Information Technology hand, website availability and speed of access are selected as components of access, ease of use and general organisation as attributes of user-friendliness while page-loading and hyperlinks correspond to navigation (Lindgaard et al. 2006; Huang and Fu 2009). Two-way communication and active control may have a significant impact on interactivity (Möller, Brezing, and Unz 2012). Finally, the level of confidentiality, integrity, protection and authorisation may be able to influence privacy and security. 3.1.2. Scaling A seven-point Likert scale anchored by strongly disagree to strongly agree was used in order to measure the performance of all website attributes. On the other hand, the question about overall satisfaction was rated by respondents on a nine-point Likert scale from very dissatisfied to very satisfied. The actual number of choices was increased for the overall satisfaction question in order to decrease bias and improve reliability (Nunnally 1979). Each scale includes a neutral point enabling the respondents to remain neutral. Excluding the neutral point would force the respondents to choose between disagree/dissatisfied or agree/satisfied and this could reduce the reliability of the scale as the results would not be necessarily true. 3.1.3. Data collection This research conducted a survey of 370 Internet users about their satisfaction with websites. A questionnaire that included 32 questions was given personally to each respondent. Participants were voluntary and they were assured that their individual responses would be treated as confidential. They were asked to complete the questionnaires based on their personal experience with the websites they had visited. There were 18 questions about specific attributes performance, nine questions about the general attributes performance and a global question about the overall satisfaction with websites. Moreover, there were four demographic questions about the gender, the age, the level of education and the experience of the respondent with the Internet, as shown in Table 4. 3.1.4. Method of analysis In order to estimate the reliability of this survey’s instrument some reliability tests are performed. In particular, the Cronbach alpha value for all the general attributes as well as its value for all the specific attributes is calculated. The cut-off threshold value for Cronbach alpha is taken as 0.70 according to Nunnally (1979). If alpha is greater than or equal to 0.70 then the items are considered unidimensional and may be combined in a scale. Thus, the correlation of each item score with the total score of the remaining items of the same kind of attributes is examined (item-total correlation). A low item-total correlation means the item is
Table 4.
5
Participant demographics.
Item
Valid Cumulative Frequency percent percent
Gender Female Male Total
184 186 370
49.7 50.3 100.0
49.7 100.0
Age Less than 20 20–30 More than 30 Total
72 221 77 370
19.5 59.7 20.8 100.0
19.5 79.2 100.0
Education Less than Bachelor degree Bachelor degree More than Bachelor degree Total
141 165 64 370
38.1 44.6 17.3 100.0
38.1 82.7 100.0
Experience Less than one year 1–5 years More than five years Total
65 218 87 370
17.6 58.9 23.5 100.0
17.6 76.5 100.0
little correlated with the overall scale and by dropping it reliability may be enhanced. A correlation coefficient less than 0.50 is used as a threshold value (Xiao and Dasgupta 2002). Finally, the correlation of each item with the item that measures the overall satisfaction should have at least a value of 0.40 (Doll and Torkzadeh 1988). In order to assess convergent and discriminant validity, a specific procedure is followed. Initially, factor analysis is conducted for the specific attributes. In case that the general attributes may be considered factors of the specific ones then it is expected that each pair of them load unambiguously on their own factor. Moreover, the average variance extracted should be more than 0.50 (Fornell and Larcker 1981). Thus, factor analysis is performed once for the specific attributes and once for the general attributes having as criterion the Kaiser Rule (drop all components with eigenvalues under 1.0). Furthermore, internal consistency validity is assessed by the values of Cronbach alpha (a ≥ 0.70) while criterion-related validity is assessed by the correlation between the sum of the specific attributes’ scores and the score of the satisfaction variable as well as the correlation between the sum of the general attributes’ scores and the score of the satisfaction variable. 3.1.5. Reliability The reliability test indicated a high reliability for both specific (18-item, a = 0.922) and general (9-item, a = 0.876) attributes while there are no low item-total correlations since their values exceed the cut-off threshold of 0.50. Thus, the instrument’s reliability is enhanced since all attribute correlations with user satisfaction was found to be
6
A. Amanatiadis et al. Table 5.
Rotated component matrix for the specific attributes. Component
Easy to comprehend Well-presented Accurate Up-to-date Relevant Detailed Speed of access Availability Ease of use Well-organised Page-loading Hyperlinks Two-way communication Active control Confidentiality Authorisation Integrity Protection
1
2
3
4
5
6
7
8
9
0.071 0.143 0.137 0.165 0.085 0.130 0.127 0.082 0.046 0.155 0.065 0.116 0.171 0.221 0.275 0.360 0.827 0.833
0.099 0.083 0.112 0.044 0.114 0.075 0.170 0.233 0.242 0.243 0.859 0.805 0.288 0.158 0.159 0.080 0.160 0.017
0.810 0.859 0.256 0.196 0.301 0.288 0.024 0.068 0.107 0.054 0.069 0.121 0.130 0.051 0.182 0.108 0.146 0.072
0.317 0.253 0.290 0.209 0.820 0.830 0.112 0.001 0.088 0.092 0.046 0.154 0.079 0.118 0.128 0.150 0.120 0.083
0.048 0.047 0.095 0.209 0.044 0.069 0.799 0.807 0.319 0.270 0.162 0.248 0.218 0.215 0.198 0.017 0.109 0.097
0.230 0.189 0.809 0.843 0.256 0.221 0.194 0.105 0.099 0.153 0.155 0.019 0.166 0.065 0.112 0.093 0.108 0.177
0.055 0.082 0.131 0.098 0.082 0.079 0.236 0.267 0.799 0.805 0.144 0.297 0.212 0.223 0.156 0.112 0.093 0.078
0.043 0.101 0.112 0.091 0.077 0.102 0.188 0.186 0.198 0.238 0.228 0.133 0.761 0.827 0.135 0.207 0.186 0.143
0.183 0.080 0.083 0.114 0.114 0.141 0.123 0.065 0.179 0.102 0.147 0.059 0.204 0.158 0.786 0.793 0.233 0.302
Note: Bold values indicate the highest influence weight. Table 6. Rotated component matrix for the general attributes (eigenvalues ≥ 1.0).
Table 7. Rotated component matrix for the specific attributes (eigenvalues ≥ 1.0).
Component
Understandability Reliability Usefulness Access Friendliness Navigation Interactivity Privacy Security
Component
System quality
Information quality
Securityprivacy
0.133 0.266 0.216 0.807 0.828 0.770 0.653 0.293 0.156
0.854 0.692 0.853 0.150 0.158 0.282 0.201 0.255 0.206
0.192 0.253 0.137 0.247 0.174 0.065 0.480 0.795 0.882
Note: Bold values indicate the highest influence weight.
greater than 0.40. All values ranged from 0.531 to 0.795 and were significant at the 0.01 level (two-tailed). Subsequently, the instrument’s criterion-related validity lies at very high level. In particular, the specific attributes presented a criterion-related validity of 0.926 while for the general attributes the instrument’s criterion-related validity was 0.929. The factor analysis was conducted for the specific attributes using principal component analysis and varimax rotation resulting in nine factors for user satisfaction explaining 87.6% of its variance. As it is, each pair of specific attributes has high loading on a specific factor, as shown in Table 5. On the other hand, Tables 6 and 7 present the factors that are extracted by conducting factor analysis for the specific attributes (explaining 65.2% of user satisfaction variance) and for the general attributes (explaining 75.2% of user satisfaction variance), respectively, having
System Information Securityquality quality privacy Easy to comprehend Well-presented Accurate Up-to-date Relevant Detailed Speed of access Availability Ease of use Well-organised Page-loading Hyperlinks Two-way communication Active control Confidentiality Authorisation Integrity Protection
0.099 0.117 0.263 0.271 0.141 0.138 0.729 0.778 0.801 0.794 0.702 0.749 0.655 0.606 0.316 0.174 0.225 0.130
0.809 0.773 0.738 0.667 0.817 0.796 0.175 0.088 0.174 0.168 0.168 0.178 0.192 0.109 0.267 0.222 0.218 0.185
0.165 0.172 0.169 0.203 0.134 0.192 0.169 0.096 0.147 0.192 0.140 0.091 0.425 0.456 0.701 0.800 0.784 0.830
Note: Bold values indicate the highest influence weight.
as a criterion the Kaiser rule. The extraction technique is principal component analysis while varimax is used as a method of rotation. In both cases, three components are extracted after five iterations which are labelled information quality, system quality and security-privacy. 3.2.
Neural networks
Two artificial neural networks are employed in order to recognise the links between satisfaction and its components.
Behaviour & Information Technology
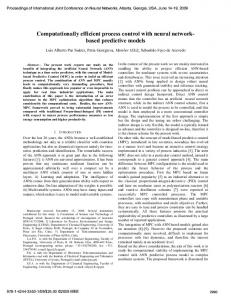
Figure 1.
The first neural network.
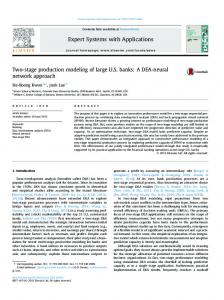
The first network, shown in Figure 1, is a feed-forward neural network which consists of three layers. The input layer has a total of 18 nodes. Each node represents a specific attribute. The number of nodes in the hidden layer have been extracted after extensive empirical tests (Nguyen and Widrow 1990). The output layer has nine nodes which represent the general attributes. The second neural network, shown in Figure 2, has a similar structure with the first network. The input layer has 9 nodes (one for each general attribute), 20 nodes in the hidden layer and 1 node in the output layer representing the final satisfaction variable. The two networks are trained and tested separately. The first 300 observations are used as the training set for the training process while the other 70 are used for testing. Therefore, 81% of the sample is used for training and 19% for testing which is considered to be a good proportion for modelling nonlinear functions according to Granger (1993). A logarithmic sigmoid function is used as a transfer (activation) function that connects the neurons of the input layer with those of the hidden layer. Subsequently, a linear activation function connects the hidden layer nodes with the output layer nodes. The learning algorithm for training is the back-propagation learning rule (Rumelhart, Hinton, and Williams 1985). The performance goal for error is set to 0.01 and the training epochs to 10,000. Finally, a normalisation takes place before the training, which scales the variable range of the survey into a scale of 0–1 required for the neural network training. A complex network is more difficult to train and usually takes more time as more epochs are required to complete the tasks. On the other hand, most of the problem domain involves large amount and variables. Removing some of the data or variables, even though some consider less relevant could affect the system knowledge. Even tiny information may affect the whole process. Due to this reason it is decided to develop two smaller networks instead of a large network. However, it is crucial to underline that the nine nodes of the second network input layer constitute the nine nodes of the first network output layer. This fact provides the
Figure 2.
7
The second neural network.
neural network-based model with a hierarchical architecture and gives the ability to connect the networks drawing conclusions about the relationships between the second network output (satisfaction) and the first network inputs (specific attributes). It is therefore necessary to feed a certain amount of information into the neural networks for internal evaluation and ultimately to produce the computational result. However, due to the great number of variables, the observation of the relationships will take place by keeping constant the values of all input variables except for that under examination. The value 4 which is the median of the variable scale is determined as the constant value. For instance, the second neural network is used in order to find out the relationship between a general attribute and satisfaction. All the other input variables of this network are given the value of 4 and a chart represents the function of the output variable (satisfaction) with that general attribute. In other words, this chart shows how satisfaction changes for different performance of a website attribute when all the other attributes remain constant at a neutral level. On the other hand, in order to estimate the link between satisfaction and one of the specific attributes, a combination of the two neural networks is used. First, all the specific attributes are given the value of 4 except for the under examination variable. Then, the nine outputs of the first neural network are calculated for each possible value of this variable. These outputs feed the next neural network which computes the outcome for satisfaction. Finally, a chart represents the relationship of satisfaction with that specific attribute. As mentioned before, the number of variables is very high with respect to the sample size. Moreover, satisfaction and its antecedents depend strongly on each individual. Therefore, the sample of this research is very difficult to contain enough information to provide logical results for all possible values. This fact constitutes a restriction for the neural network training resulting in charts where some points are not harmonised with the chart’s general trend.
8
A. Amanatiadis et al.
4. Experimental results and findings The following charts in Figure 3 represent the relationships between user satisfaction and its determinants. The horizontal axis represents the attribute performance while the vertical axis shows the user satisfaction of the equivalent attribute. Particularly, the attribute of information understandability has an impact on overall satisfaction that is asymmetric with increasing returns (Figure 3(a)). This means that understandability significantly affects satisfaction in case of good performance while for moderate and negative performance there is only a slight or zero impact. Usefulness of information (Figure 3(b)) has about the same impact on satisfaction with understandability of information. The attribute of navigation also follows the same pattern although its impact for positive performance is even greater (Figure 3(c)). On the other hand, reliability of information (Figure 3(d)), access (Figure 3(e)) and friendliness (Figure 3(f)) constitute website attributes that may lead to dissatisfaction in case of low performance. All these attributes present a negative asymmetry which means that negative effect has a greater impact on satisfaction than an equivalent unit of positive effect. Specifically, reliability of information and access have a significant impact only for negative performance
while a user-friendly environment affects satisfaction even for positive performance although this impact is weak with respect to its impact for negative performance. Conversely, interactivity (Figure 3(g)), security (Figure 3(h)) and privacy (Figure 3(i)) play always a very important role in determining overall satisfaction compared with their performances. The steep slopes in the charts imply a strong relationship and it is clear that small changes in performance have large impacts on satisfaction. In particular, interactivity has the greatest impact for both negative and positive performance. Security may enhance satisfaction more than may decrease it while privacy has exactly the opposite effect. Furthermore, it is remarkable that when interactivity and security exceed a point of positive performance, satisfaction led to a significant fall (especially for very high interactivity). The results for the variables of the specific attributes present a variety of impacts on overall satisfaction as shown in Figure 4. Some of these attributes are found to be indifferent, others to be crucial for positive or negative performance and others that have always a significant impact. The variables regarding the website organisation, the procedures that allow authorised access and the existence of hyperlinks which provide links within and between
(a)
(b)
(c)
(d)
(e)
(f)
(g)
(h)
(i)
Figure 3. Relationships of user satisfaction with respect to its determinants: (a) understandability of information; (b) usefulness of information; (c) navigation; (d) reliability of information; (e) access; (f) friendliness; (g) interactivity; (h) security and (i) privacy.
Behaviour & Information Technology (a)
(b)
(c)
(d)
(e)
(f)
(g)
(h)
(i)
(j)
(k)
(l)
(m)
(n)
(o)
(p)
(q)
(r)
9
Figure 4. Relationships of user satisfaction with respect to specific attributes: (a) organisation; (b) presentation; (c) hyperlinks; (d) authorisation; (e) accuracy; (f) timeliness; (g) speed of access; (h) availability; (i) ease of use; (j) comprehensibility; (k) page-loading; (l) integrity; (m) confidentiality; (n) relevancy; (o) details; (p) two-way communication; (q) active control and (r) protection.
websites, are classified into the first group of attributes which is called indifferent attributes. These attributes influence to the lowest degree overall satisfaction. The second group includes those attributes that affect significantly satisfaction only when they perform well. For example, a very good presentation of the information combined with clearness and lucidity which contribute to its comprehensibility may enhance considerably user
satisfaction. However, these attributes for a wide range of their performance are indifferent. Thus, speed of pageloading and integrity of information have great impacts for positive performance while for low performance they have small impacts. Finally, the attributes of relevancy and details of information affect satisfaction to a great extent when they perform well and their relationships with satisfaction present a very small deviation from linearity. Nevertheless,
10
A. Amanatiadis et al.
in case the information contains more details than it is necessary, user satisfaction is decreased. There is also a third group of attributes that affects satisfaction mainly for low performance. These attributes are accuracy and timeliness of information, speed of access, websites’ availability and ease of use. In case the information provided by a website is not accurate and not updated, users are led to dissatisfaction. Thus, long delays when users access a website may have large impact on satisfaction. Otherwise, these attributes are indifferent. Furthermore, availability and ease of use have an especially negative effect on satisfaction when they perform very badly while they present moderate effect for positive and neutral performance. Finally, there are some specific attributes which have always a significant impact on satisfaction. Such attributes are two-way communication, active control, confidentiality and protection of information. The relationship of the variable of two-way communication with satisfaction is almost linear and its performance may decrease or increase satisfaction at very low or high levels, respectively. Moreover, lack of active control may lead to dissatisfaction although users do not wish to have full control in guiding the interaction. Protection of information is always important to users and determines their level of satisfaction. Finally, our study showed that website visitors prefer websites that keep their personal data confidential with clear and trustworthy policies, in compliance with the findings of the empirical study in Vail, Earp, and Anton (2008).
5. Discussion This study empirically investigated the effects of website attributes on user satisfaction. A new technique using neural networks was proposed for recognising their relationships by function approximation. The overall good results of the proposed neural network-based model could be related to the assertion that neural networks are suitable for handling nonlinearities in the data. Hence, their ability to take into account the interaction between variables as well as approximate complex functions indicate their usefulness in predicting user satisfaction for a website based on performance of certain website attributes. Furthermore, the results of this study reveal that satisfaction formation is a complicated and non-trivial procedure. Therefore, the concept that these performance links are considered only linear and symmetric should be replaced with a new perspective which takes into account this kind of complexity. This study supports Herzberg’s two-factor theory and Kano, Seraku and Takahasi’s model who claimed that attributes may be classified into categories. The importance of some attributes and their impact on satisfaction were found to be associated with their performance. In other words, the results indicate that there are attributes whose relative impact differs for low and high performance.
Moreover, the concept that negative information tends to influence more strongly than comparably extreme positive information was not confirmed. For instance, the positive performance of understandability, usefulness and navigation had greater power than their negative performance while reliability, access and friendliness exhibited larger relative impacts for low performance. This conclusion is consistent with that derived from research in Cheung and Lee (2005). Furthermore, interactivity, security and privacy have always a significant impact on satisfaction for both negative and positive performance. Among all website attributes interactivity exhibits the greatest impact on overall satisfaction. However, it was found that if it exceeds a limit of positive performance, it leads to a decrease of overall satisfaction. This is in accordance to Sundar, Kalyanaraman, and Brown (2003) which demonstrated that high interactivity is not necessarily good. Concerning the specific attributes, organisation, hyperlinks and authorisation are found to be indifferent in determining satisfaction while two-way communication, active control, confidentiality and protection of information are found to be crucial. Thus, presentation, comprehensibility, page-loading, integrity, relevancy and details have significant impact on satisfaction only for positive performance. Subsequently, accuracy, timeliness, speed of access, availability and ease of use affect satisfaction when they perform negatively. Finally, details and active control present similar effects with interactivity decreasing satisfaction for very high performances. In summary, this research provides a model in order to recognise the impacts of website attributes on user satisfaction and outlines a series of research propositions that can move us towards a more comprehensive understanding of user satisfaction with websites.
References Aladwani, A., and P. Palvia. 2002. “Developing and Validating an Instrument for Measuring User-Perceived Web Quality.” Information & Management 39 (6): 467–476. Albuquerque, A., and A. Belchior. 2002. “E-Commerce Websites: A Qualitative Evaluation.” Proceedings of the 11th international WWW conference, Honolulu, HI, USA. Amanatiadis, Angelos, Konstantinos Drakatos, Loukas Tsironis, and Vassilis Moustakis. 2006. “Defining the Main Factors of Quality of Service in Mobile Telephony.” International conference on wireless and mobile communications, Bucharest, Romania, 23–23. Anderson, E., and V. Mittal. 2000. “Strengthening the SatisfactionProfit Chain.” Journal of Service Research 3 (2): 107–120. Anderson, E., and M. Sullivan. 1993. “The Antecedents and Consequences of Customer Satisfaction for Firms.” Marketing Science 12 (2): 125–143. Anderson, E., and M. Sullivan. 1993b. “The Antecedents and Consequences of Customer Satisfaction for Firms.” Marketing Science, 125–143. Baumeister, Roy F., Ellen Bratslavsky, Catrin Finkenauer, and Kathleen D. Vohs. 2001. “Bad Is Stronger than Good.” Review of General Psychology 5 (4): 323–370.
Behaviour & Information Technology Behara, R., W. Fisher, and J. Lemmink. 2002. “Modelling and Evaluating Service Quality Measurement Using Neural Networks.” International Journal of Operations & Production Management 22 (10): 1162–1185. Berger, Charles, Robert Blauth, David Boger, Christopher Bolster, Gary Burchill, William DuMouchel, Fred Pouliot, et al. 1993. “Kano’s Methods for Understanding CustomerDefined Quality.” Center for Quality Management Journal 2 (4): 3–35. Brickman, P., and D. Campbell. 1971. “Hedonic Relativism and Planning the Good Society.” In Adaptation Level Theory: A Symposium, edited by M. H. Appley, 287–302. New York: Academic Press. Cheung, C., and M. Lee. 2005. “The Asymmetric Effect of Website Attribute Performance on Satisfaction: An Empirical Study.” Proceedings of the Hawaii international conference on system sciences, Big Island, HI, USA, 175–175. Chin, W., and M. Lee. 2000. “A Proposed Model and Measurement Instrument for the Formation of Is Satisfaction: The Case of End-User Computing Satisfaction.” Proceedings of the international conference on information systems, Brisbane, Australia, 553–563. David, James P., Peter J. Green, Rene Martin, and Jerry Suls. 1997. “Differential Roles of Neuroticism, Extraversion, and Event Desirability for Mood in Daily Life: An Integrative Model of Top-Down and Bottom-Up Influences.” Journal of Personality and Social Psychology 73 (1): 149–159. Davies, F., L. Moutinho, and B. Curry. 1996. “ATM User Attitudes: A Neural Network Analysis.” Marketing Intelligence & Planning 14 (2): 26–32. Dedeke, A. 2000. “A Conceptual Framework for Developing Quality Measures for Information Systems.” Proceedings of the 2000 international conference on information quality (MIT IQ conference), Cambridge, MA, USA, 126–128. DeLone, W., and E. McLean. 1992. “Information Systems Success: The Quest for the Dependent Variable.” Information Systems Research 3 (1): 60–95. DeLone, W., and E. McLean. 2002. “Information Systems Success Revisited.” Proceedings of the 35th annual Hawaii international conference on system sciences, HICSS 2002, Big Island, HI, USA, 2966–2976. Diener, Ed, Randy J. Larsen, Steven Levine, and Robert A. Emmons. 1985. “Intensity and Frequency: Dimensions Underlying Positive and Negative Affect.” Journal of Personality and Social Psychology 48 (5): 1253–1265. Doll, W., and G. Torkzadeh. 1988. “The Measurement of End-User Computing Satisfaction.” MIS Quarterly 12 (2): 259–274. Fornell, C., and D. Larcker. 1981. “Evaluating Structural Equation Models with Unobservable Variables and Measurement Error.” Journal of Marketing Research 18 (1): 39–50. Furnell, S., and T. Karweni. 1999. “Security Implications of Electronic Commerce: A Survey of Consumers and Businesses.” Internet Research 9 (5): 372–382. Gefen, D. 2002. “Customer Loyalty in E-Commerce.” Journal of the Association for Information Systems 3 (1): 27–51. Granger, C. 1993. “Strategies for Modelling Nonlinear TimeSeries Relationships.” The Economic Record 69 (3): 233–238. Hassenzahl, M., and N. Tractinsky. 2006. “User Experience – A Research Agenda.” Behaviour & Information Technology 25 (2): 91–97. Hassoun, M. 1995. Fundamentals of Artificial Neural Networks. Cambridge, MA: MIT Press. Hertzberg, F., B. Mausner, and B. Snyderman. 1959. The Motivation to Work. New York: John Wiley & Sons.
11
Huang, K., Y. Lee, and R. Wang. 1998. Quality Information and Knowledge. Upper Saddle River, NJ: Prentice Hall PTR. Huang, T., and F. Fu. 2009. “Understanding User Interface Needs of E-Commerce Web Sites.” Behaviour & Information Technology 28 (5): 461–469. Janda, S., P. Trocchia, and K. Gwinner. 2002. “Consumer Perceptions of Internet Retail Service Quality.” International Journal of Service Industry Management 13 (5): 412–431. Kalakota, R., and A. Whinston. 1996. Frontiers of Electronic Commerce. Redwood City, CA: Addison Wesley Longman. Kano, Noriaki, Nobuhiko Seraku, Fumio Takahashi, and Shinichi Tsuji. 1984. “Attractive Quality and Must-Be Quality.” The Journal of the Japanese Society for Quality Control 14 (2): 39–48. Khalifa, M., and V. Liu. 2002. “Satisfaction with Internet-Based Services: The Role of Expectations and Desires.” International Journal of Electronic Commerce 7 (2): 31–49. Kim, S., T. Shaw, and H. Schneider. 2003. “Website Design Benchmarking Within Industry Groups.” Internet Research: Electronic Networking Applications and Policy 13 (1): 17–26. Kincl, T., and P. Štrach. 2012. “Measuring Website Quality: Asymmetric Effect of User Satisfaction.” Behaviour & Information Technology 31 (7): 647–657. Lee, Yang W., Diane M. Strong, Beverly K. Kahn, and Richard Y. Wang. 2002. “AIMQ: A Methodology for Information Quality Assessment.” Information & Management 40 (2): 133–146. Lin, H., and G. Lee. 2006. “Determinants of Success for Online Communities: An Empirical Study.” Behaviour & Information Technology 25 (6): 479–488. Lindgaard, Gitte, Gary Fernandes, Cathy Dudek, and Judith Brown. 2006. “Attention Web Designers: You Have 50 Milliseconds to Make a Good First Impression!” Behaviour & Information Technology 25 (2): 115–126. Lowry, Paul Benjamin, Trent Spaulding, Taylor Wells, Greg Moody, Kevin Moffit, and Sebastian Madariaga. 2006. “A Theoretical Model and Empirical Results Linking Website Interactivity and Usability Satisfaction.” Proceedings of the Hawaii international conference on system sciences, Kauai, HI, USA, Vol. 6, 123–123. Lu, M., and W. Yeung. 1998. “A Framework for Effective Commercial Web Application Development.” Internet Research 8 (2): 166–173. Madu, C., and A. Madu. 2002. “Dimensions of E-Quality.” International Journal of Quality and Reliability Management 19 (3): 246–258. McKinney, Vicki, Kanghyun Yoon, and Fatemeh Mariam Zahedi. 2002. “The Measurement of Web-Customer Satisfaction: An Expectation and Disconfirmation Approach.” Information Systems Research 13 (3): 296–315. Mittal, V., W. Ross, and P. Baldasare. 1998. “The Asymmetric Impact of Negative and Positive Attribute-Level Performance on Overall Satisfaction and Repurchase Intentions.” Journal of Marketing 62 (1): 33–47. Möller, B., C. Brezing, and D. Unz. 2012. “What Should a Corporate Website Look Like? The Influence of Gestalt Principles and Visualisation in Website Design on the Degree of Acceptance and Recommendation.” Behaviour & Information Technology 31 (7): 739–751. Nguyen, D., and B. Widrow. 1990. “Improving the Learning Speed of 2-Layer Neural Networks by Choosing Initial Values of the Adaptive Weights.” Proceedings of the international joint conference on neural networks, San Diego, CA, USA, 21–26.
12
A. Amanatiadis et al.
Nielsen, J. 1999. “User Interface Directions for the Web.” Communications of the ACM 42 (1): 65–72. Novak, T., D. Hoffman, and Y. Yung. 2000. “Measuring the Customer Experience in Online Environments: A Structural Modeling Approach.” Marketing Science 19 (1): 22–42. Nunnally, J. 1979. “Psychometric Theory.” Applied Psychological Measurement 3 (2): 279–280. Oliva, T., R. Oliver, and W. Bearden. 1995. “The Relationships Among Consumer Satisfaction, Involvement, and Product Performance: A Catastrophe Theory Application.” Behavioral Science 40 (2): 104–132. Oliver, R. 1977. “Effect of Expectation and Disconfirmation on Postexposure Product Evaluations: An Alternative Interpretation.” Journal of Applied Psychology 62 (4): 480–486. Palmer, J. 2002. “Website Usability, Design, and Performance Metrics.” Information Systems Research 13 (2): 151–167. Palmer, J., and D. Griffith. 1998. “Information Intensity: A Paradigm for Understanding Website Design.” Journal of Marketing Theory and Practice 6 (3): 38–42. Prakash, A., R. Mohanty, and S. Kallurkar. 2011. “Service Quality Modelling for Life Insurance Business Using Neural Networks.” International Journal of Productivity and Quality Management 7 (3): 263–286. Preece, J. 2001. “Sociability and Usability in Online Communities: Determining and Measuring Success.” Behaviour & Information Technology 20 (5): 347–356. Radosevich, L. 1997. “Fixing Web-Site Usability.” InfoWorld 19 (50): 81–82. Rai, A., S. Lang, and R. Welker. 2002. “Assessing the Validity of Is Success Models: An Empirical Test and Theoretical Analysis.” Information Systems Research 13 (1): 50–69. Ranganathan, C., and S. Ganapathy. 2002. “Key Dimensions of Business-to-Consumer Websites.” Information & Management 39 (6): 457–465. Rice, M. 1997. “What Makes Users Revisit a Website.” Marketing News 31 (6): 12–13. Rumelhart, David E., Geoffrey E. Hinton, and Ronald J. Williams. 1985. “Learning Internal Representations by Error Propagation.” DTIC Document. http://oai.dtic.mil/oai/oai?verb= getRecord&metadataPrefix=html&identifier=ADA164453 Schenkman, B., and F. Jönsson. 2000. “Aesthetics and Preferences of Web Pages.” Behaviour & Information Technology 19 (5): 367–377. Sørum, H., K. Andersen, and R. Vatrapu. 2012. “Public Websites and Human–Computer Interaction: An Empirical Study of Measurement of Website Quality and User Satisfaction.” Behaviour & Information Technology 31 (7): 697–706. Spreng, R., S. Mackenzie, and R. Olshavsky. 1996. “A Reexamination of the Determinants of Consumer Satisfaction.” Journal of Marketing 60 (3): 15–32. Stewart, T. 2012. “Websites – Quality and Usability.” Behaviour & Information Technology 31 (7): 645–646.
Suh, K., S. Kim, and J. Lee. 1994. “End User’s Disconfirmed Expectations and the Success of Information Systems.” Information Resources Management Journal 7 (4): 30–30. Sundar, S., S. Kalyanaraman, and J. Brown. 2003. “Explicating Website Interactivity: Impression Formation Effects in Political Campaign Sites.” Communication Research 30 (1): 30–59. Sutcliffe, A., and A. Namoun. 2012. “Predicting User Attention in Complex Web Pages.” Behaviour & Information Technology 31 (7): 679–695. Teo, Hock-Hai, Lih-Bin Oh, Chunhui Liu, and Kwok-Kee Wei. 2003. “An Empirical Study of the Effects of Interactivity on Web User Attitude.” International Journal of Human– Computer Studies 58 (3): 281–305. Tsai, C. F., and Y. H. Lu. 2009. “Customer Churn Prediction by Hybrid Neural Networks.” Expert Systems with Applications 36 (10): 12547–12553. Turban, E., and D. Gehrke. 2000. “Determinants of E-Commerce Website.” Human Systems Management 19 (2): 111–120. Vail, M., J. Earp, and A. Anton. 2008. “An Empirical Study of Consumer Perceptions and Comprehension of Website Privacy Policies.” IEEE Transactions on Engineering Management 55 (3): 442–454. Waite, K., and T. Harrison. 2002. “Consumer Expectations of Online Information Provided by Bank Websites.” Journal of Financial Services Marketing 6 (4): 309–322. Warkentin, Merrill, David Gefen, Paul A. Pavlou, and Gregory M. Rose. 2002. “Encouraging Citizen Adoption of e-Government by Building Trust.” Electronic Markets 12 (3): 157–162. Weinberg, B. 2000. “Don’t Keep Your Internet Customers Waiting too Long at the (Virtual) Front Door.” Journal of Interactive Marketing 14 (1): 30–39. West, P. M., P. L. Brockett, and L. L. Golden. 1997. “A Comparative Analysis of Neural Networks and Statistical Methods for Predicting Consumer Choice.” Marketing Science 16 (4): 370–391. Wray, B., A. Palmer, and D. Bejou. 1994. “Using Neural Network Analysis to Evaluate Buyer–Seller Relationships.” European Journal of Marketing 28 (10): 32–48. Xiao, L., and S. Dasgupta. 2002. “Measurement of User Satisfaction with Web-based Information Systems: An Empirical Study.” Proceedings of the eighth Americas conference on information systems, Dallas, TX, USA, 1149–1155. Yao, X. 1999. “Evolving Artificial Neural Networks.” Proceedings of the IEEE 87 (9): 1423–1447. Yi, Y. 1990. “A Critical Review of Consumer Satisfaction in Review of Marketing.” Review of Marketing 4 (1): 68–123. Zhang, Ping, Ruth V. Small, Gisela M. von Dran, and Silvia Barcellos. 1999. “Websites that Satisfy Users: A Theoretical Framework for Web User Interface Design and Evaluation.” Proceedings of the Hawaii international conference on system sciences, Maui, HI, USA, Vol. 32, 1–8.