Journal of Chromatographic Science, Vol. 43, July 2005
A New and Fast Extraction Method for the Determination of Priority Phenols from Marine Sediments by Liquid Chromatography Cristina Mahugo Santana, Zoraida Sosa Ferrera, and José J. Santana Rodríguez* Department of Chemistry, Faculty of Marine Sciences, University of Las Palmas de Gran Canaria, 35017, Las Palmas de Gran Canaria, Spain
Abstract A new and fast method for the determination of priority phenols in marine sediment samples by high-performance liquid chromatography using microwave-assisted micellar extraction is optimized. This study is carried out using the nonionic surfactants polyoxyethylene 9 lauryl ether (polidocanol) and genapol X-080 as extractants. Parameters studied include surfactant concentration, solution pH, extraction time, and power. Once the method is optimized, it is applied to different spiked marine sediments from of the Canary Islands coastlines (Spain). The results obtained indicate that a power irradiation of 500 W for 2 min achieved the best extraction efficiency (~ 100% recovery) and less than 10% relative standard deviation. Detection limits are obtained in the 2–20 µg/g range for the phenols studied. Finally, the proposed method provides a simple, fast, and organic solvent-free procedure to analyze phenols from marine sediment samples.
Introduction Phenolic compounds are widely involved in commercial applications, such as coal conversion, petroleum refining, paper manufacturing, dye synthesis, and photo processing (1,2). They also have substantial applications in agriculture as herbicides, insecticides, and fungicides. As a result, they are often found in waters (3–5), soils (6), and sediments (6,7). However, phenolic compounds are not only generated by human activity, they are also formed naturally (e.g., during the decomposition of leaves or wood) (8). Because of the widespread presence of phenolic compounds in our environment and their high toxicity (9), many phenolic compounds are listed as U.S. Environmental Protection Agency (EPA) priority pollutants (10). Because of the increasing concern to human health, efforts have been devoted to quantitating phenols from environmental samples, such as waste water, sea water, ashes, sediments, and soils (11–17). High-performance liquid chromatography (HPLC) is frequently used for the analysis * Author to whom correspondece should be addressed: email
[email protected].
282
of phenolic compounds because, unlike in gas chromatography, no derivatization of compounds is needed (18). An extraction step is required prior to their determination. The extraction of organic pollutants from solid samples requires the use of organic solvents. The most frequently used methods for the extraction of organic pollutants from these types of samples are Soxhlet extraction and the use of an ultrasonic bath. Traditional methods use large volumes of solvents under aggressive shaking or temperature conditions (or both). Soxhlet extraction is particularly suitable for the types of pollutants that are strongly adsorbed on matrices but require long extraction times and the use of large volumes of frequently toxic solvents. Moreover, they can degrade the analytes (19,20). In the last few years, microwave-assisted extraction (MAE) has become a viable alternative to conventional techniques, and MAE exhibits many substantial improvements in analytical sample preparation because it requires much lower volumes of organic solvent, reduces extraction time, and increases sample throughput through extraction of multiple samples (21,22). The number of procedures used for the extraction of organic compounds from environmental matrices by microwave energy has increased (23–25). However, the organic solvents are used as extractants in most of them. An alternative to these types of extractants would be the use of micellar systems. The extraction of organic compounds from solid samples using a micellar medium offers advantages such as safety, cost, compatibility with an aqueous–organic mobile phase in HPLC, etc. The micellar media have been applied to the extraction of several compounds present in different environments such as water samples, marine sediments, and soils (26–30). In this paper, a new, fast method for the determination of priority phenols in marine sediment samples by HPLC using microwave-assisted micellar extraction (MAME) is presented. The optimization of the variables that affect the extraction of these compounds from marine sediment samples using MAE with a micellar medium as extractants was studied. The most commonly studied variables are temperature, extraction time and power, solvent volume, and concentration for different types of extracting solvents. Many of these studies made use of experimental design
Reproduction (photocopying) of editorial content of this journal is prohibited without publisher’s permission.
Journal of Chromatographic Science, Vol. 43, July 2005
approaches for the optimization of MAE procedures (31,32). MAME was used for the extraction of 15 phenolic derivatives, including the eleven priority phenols listed by the EPA, from marine sediments using the nonionic surfactants polyoxyethylene 9 lauryl ether (polidocanol) and genapol X-080 as extractants.
Cromatografía S.A., Barcelona, Spain). The system and the data management were controlled by Millenium software from Waters. The stationary-phase column was a Waters Nova-Pack C18 (3.9- × 150-mm i.d., 4-µm particle diameter). The analytical column and the mobile phase reservoir were water-jacketed and thermostated at 25°C ± 1ºC with a circulating bath. The microwave oven used in this study was a Multiwave with a 6 EVAP rotor and 6 MF100 vessels (Anton Paar, Graz, Austria).
Experimental
Procedures
Reagents
Phenolic compounds were obtained from Sigma-Aldrich (Madrid, Spain), and their stock solutions (200 µg/mL) were prepared by dissolving appropriate amounts of the commercial products in methanol and stored in glass-stoppered bottles at 4ºC. Appropiate volumes of the stock solutions were diluted with methanol to prepare more dilute solutions containing phenols at a 50-µg/mL concentration. They are listed in Table I (numbers and abbreviations identify the compounds in the Figures). The standard certified mixture of phenolic compounds #X190103 was obtained from the Laboratories Dr. Ehrenstorfer GmbH (Germany) (provided by Imatra, Barcelona, Spain). The nonionic surfactants used in this study (polidocanol and genapol X-080) were obtained from Sigma-Aldrich and prepared in deionized water. HPLC-grade methanol was obtained from Panreac Química S.A. (Barcelona, Spain). All solvents and analytes were filtered through a 0.45-µm nylon membrane filter and ultrahigh-quality water obtained by a MilliQ (Millipore, Bedford, MA) water purification system was used throughout. Apparatus
The chromatographic system consists of two Waters pump 510, fitted with a Waters injector model Rheodyne 7725i with a 20-µL sample loop and a Waters 996 photodiode array detector (Waters, Table I. List of Phenolic Derivatives, Retention Times, and Optimal Absorption Wavelenghts No.
Compound
1 2 3 4 5 6 7 8 9 10 11 12 13
Phenol 4-Nitrophenol 2,4-Dinitrophenol Para-cresol 2-Nitrophenol 2-Chlorophenol 4-Chlorophenol 2,4-Dimethylphenol 4,6-Dinitro-ortho-cresol 4-Chloro-meta-cresol 2,4,6-Trimethylphenol 2,4-Dichlorophenol 4-Chloro-3,5Dimethylphenol 2,4,6-Trichlorophenol Pentachlorophenol
14 15
λ (nm)
t R (min)
PH 4 NP 2,4-DNP PC 2-NP 2-CP 4-CP 2,4-DMP 4,6-DNOC 4-CMC 2,4,6-TMP 2,4-DCP 4-C-3,5-DMP
270 315 270 280 280 280 280 280 270 280 280 290 280
5.3 8.7 10.3 11.9 12.9 14.0 19.5 24.7 25.3 28.1 29.1 29.4 31.4
2,4,6-TCP PCP
290 303
33.0 38.2
Abbrevation
Preparation of spiked sediments Marine sediments were collected from different parts of the Canary Islands coastline. After sieving, fractions of sediments with particle size under 0.3 mm [from Las Canteras beach (Gran Canaria Island) and Jandía beach (Fuerteventura Island)] and 0.1 mm [from Taliarte harbor (Gran Canaria Island)] were taken. These sediments were washed with purified water and dried in an oven. Uncontaminated sediments (blank samples) were previously analyzed and then spiked as follows: 2 g of sediment was spiked with a volume of the phenols dissolved in methanol to obtain a concentration of each analyte at 2 µg/g. The samples were then stored in the dark and allowed to air-dry at room temperature for 24 h prior to analysis. The aged spiked samples were prepared as follows: the mixture of phenolic derivatives dissolved in 25 mL of methanol was added to 20 g of sediment. After it was mixed thoroughly, the sample was then stored at 4ºC for 3 months before the first extraction. The supernatant solution was removed and analyzed to determine the phenolic compounds concentration. The concentrations in the sediment were between 1.14 and 1.65 µg/g. It was assumed that the phenols were uniformly distributed in the sample and that, as the sediment still retained residual moisture throughout the storage period, any analyte–matrix interactions would have occurred over the weathering period and, to a similar extend, to those in real contaminated sediments with similar properties. The results reported are the average of triplicate measurements. MAME After the sediment sample was transferred to the vessel, 4 mL of the surfactant solution was added, and the sediment was subjected to the MAME process. After this, the vessels were allowed to cool down to room temperature for 10–15 min before opening. The extracted solution was filtered with a 0.45-µm syringe-driven filter and transferred to a glass tube before injection. Effect of solution pH on extraction In order to investigate the effect of solution pH in the extraction of phenolic compounds, 50 µL of acetic acid 100%(v/v) or 50 µL of NaOH 25%(w/v) was added to the spiked sediment samples to obtain an acid or basic medium. The sediments were then subjected to the MAME process. LC analysis with UV detection For the separation of the phenols mixture, the eluent used was water (with 1% acetic acid)–methanol (70:30) for 16 min (isocratic), up to 100% methanol for 24 min. The flow rate was 1 mL/min. The separation and determination of the compounds under
283
Journal of Chromatographic Science, Vol. 43, July 2005
study were performed by injecting 20 µL of obtained extracts into the LC, and the absorbance corresponding to the wavelength maxima for each analyte was measured. The retention time and wavelength for each compound are listed in Table I. The range of the calibration curve concentration was between 100 and 1500 µg/L. Statistical analysis All statistical tests (anaysis of variance, experimental design) were performed using Statgraphics plus software, version 4.0 (Manugistic, Rockville, MD).
Results and Discussion Optimization of MAE conditions has been reported in several applications. Many studies have used factorial, central composite, and orthogonal array designs to find optimal conditions (33). In this study, the variables considered in the MAME optimization process were surfactant concentration, surfactant volume, pH of the solution, and extraction time and power. Not all of the variables influenced the extraction recoveries in the same way. As a result of this, those variables that were not mutually influenced (their interaction was not statistically significant) were optimized sequentially. On the other hand, time and power are variables that are conditioned reciprocally; they were, therefore, studied using a factorial design. To optimize the MAME procedure, marine sediments from Taliarte harbor were chosen. Surfactant volume
In some cases, solvent volume may be an important parameter for efficient extractions. The solvent volume must be sufficient to ensure that the entire sample is immersed (34). The surfactant volume–sample amount ratio was investigated by varying the volume of surfactant and keeping the sample mass constant. Four different ratios were studied: 2, 4, 8, and 12 mL of surfactant solution for 2 g of sample. The results obtained for both surfactants showed that 2 mL was not enough to wet the sample; however, the recoveries achieved with the other solvent volumes were sim-
ilar. Therefore, if the sample was fully immersed in the solvent, an increase of the solvent volume did not seem to have any influence on the extraction percentages. For subsequent studies, 4 mL of surfactant was chosen. Surfactant concentration
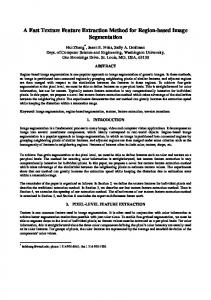
Four different concentrations for each surfactant, between 1% and 7.5% (v/v), were studied to establish the effect of this parameter on the extraction process. This initial study was carried out using a power of 200 W and time of 2 min. Figure 1 shows the dependence on surfactant concentration for the recovery of two phenolic compounds (PH and 2,4-DCP). A significant decrease in the recoveries was observed as the concentration of genapol X-080 was increased from 3.0% to 7.5% (v/v). It could be because of the fact that the solutions of this surfactant are more viscous than others at the same concentration, so the surfactant will not contact the analytes as efficiently. When polidocanol was used as the extractant, the recoveries increased slightly with an increase of the surfactant concentration. For this surfactant, the highest recovery percentages were obtained with 5% (v/v) surfactant. Over this concentration, the recoveries remained constant or decreased slightly. A concentration of 2% (v/v) for genapol X-080 and 5% (v/v) for polidocanol were chosen to study the influence of microwave irradiation conditions, time and power, on the extraction process. Solution pH
When working with sediment samples, the extraction process might also be influenced by pH. The pH of the extracting solution can alter the ionic form of the analytes under study. To investigate the effect of this parameter on the process, samples containing 2 g of sediment in an acid and basic medium were subjected to MAME using the surfactant concentration, power, and time, which were mentioned previously. The results obtained, after analysis of the extracted solutions, indicated that the basic medium slightly enhanced the extraction of some phenolic derivatives, such as phenol and 2-chlorophenol; although for most, the pH solution had no effect on the recoveries. It was therefore decided not to modify the initial pH of the solution. Optimization of microwave irradiation conditions
In a closed vessels system, the chosen power setting depends on
Recovery (%)
Table II. Design Matrix in the Screening Design
Surfactant concentration (%, v/v) Figure 1. Influence of the surfactant concentration (genapol X-080, solid lines and polidocanol, dashed lines) on the recovery percentages of some phenolic compounds.
284
Run
Power (W)
Time (min)
1 2 3 4 5 6 7 8 9 10 11
100 100 100 300 300 300 300 300 500 500 500
2 8 14 2 8 8 8 14 2 8 14
Journal of Chromatographic Science, Vol. 43, July 2005
Recovery (%)
the number of samples to be extracted during one extraction run. The power must be chosen correctly to avoid excessive temperatures, which could lead to analyte degradation and overpressure inside the vessels. This parameter is of prime importance in ensuring efficient extraction because it has to allow the diffusivity of the solvent into the internal parts of the matrix as well as enhanced desorption of the components from the active sites of the matrix. As in other extraction techniques, time is another parameter that needs to be taken into account. Extraction times in MAE are
very short compared with conventional techniques; often 10 min is sufficient, but even 3 min has been demonstrated to give full recovery for pesticides from soils and sediments (35,36). The irradiation power and time of microwaves are two parameters that are interrelated, so their influence on the extraction were investigated using a factorial design. This model allows the direct evaluation of the variables considered. Moreover, the application of a statistical approach using a factorial design can both reduce the development time and provide less ambiguous data. A central composite design was used (22 + star with three central points). The experimental design involving 11 runs (Table II) was used as an approach to the response surface of the microwave extraction process (37). Other variables involved in the extraction process were held constant: surfactant concentration, 2% (v/v) for Table III. Analytical Characteristics of the Method LOD (µg/L) Compound
Time (min)
Recovery (%)
Pow er (W )
Powe r (W )
Time (min)
Figure 2. Response surface for phenol estimated by the central composite design. Polidocanol (A) and genapol X-080 (B).
RSD (%)*
Polidocanol
Genapol X-080
Polidocanol
Genapol X-080
5 2 3 10 3 9 12 8 2 5 5 5 6 4 10
13 3 3 11 4 10 17 11 3 16 15 15 19 14 20
3.8 1.3 2.0 9.9 4.6 9.5 2.7 2.6 3.2 4.1 9.1 5.7 5.6 6.2 5.8
5.1 1.1 2.9 9.6 5.0 7.9 4.8 5.7 4.7 3.9 9.5 5.0 4.3 5.1 5.0
PH 4 NP 2,4-DNP PC 2-NP 2-CP 4-CP 2,4-DMP 4,6-DNOC 4-CMC 2,4,6-TMP 2,4-DCP 4-C-3,5-DMP 2,4,6-TCP PCP
* RSD = relative standard deviation (n = 6).
Table IV. Determination of Phenolic Derivatives in Sediment Spiked with Certified Standard Mixture* Amount found (µg/g)†
Figure 3. Elution of a mixture of 15 phenolic derivatives extracted of spiked sediment from Jandia beach using genapol X-080 as extractant. Chromatographic conditions as described in the text. The numbering refers to Table I.
Compound
Polidocanol
Genapol X-080
PH 4 NP 2,4-DNP 2-NP 2-CP 2,4-DMP 4,6-DNOC 4-CMC 2,4-DCP 2,4,6-TCP PCP
2.18 2.07 1.75 1.81 1.75 1.20 1.76 1.84 1.90 2.06 1.92
1.95 2.01 2.20 2.25 2.08 1.03 2.03 1.83 1.80 2.03 1.76
* Amound added of each analyte (2 µg/g). † Mean of three determinations.
285
Journal of Chromatographic Science, Vol. 43, July 2005
genapol X-080 and 5% (v/v) for polidocanol; surfactant volume, 4 mL; and sediment amount, 2 g. The concentration of phenolic compounds spiked was also held constant (2 µg/g). Figure 2A shows the response surface for PH using polidocanol as the extractant. This extraction model shows an increase in the amount of analyte extracted with the microwave power. A maximum in the region of high powers and low times for the extraction can be observed. Figure 2B shows the response surface for PH using genapol X-080. In this case, it can be observed that the higher recoveries are also obtained in the region of high powers and low extraction times, decreasing gradually the extraction percentages at longer times. Response surfaces modelled for the other phenols lead to the same conclusions. In accordance with these results, an irradiation power of 500 W and extraction time of 2 min were chosen as the best irradiation conditions.
MAME process was applied, and these are shown in Table III along with detection limit values. The results obtained indicate standard deviation values of lower than 10%. The detection limits (38) were calculated as twice the noise for each phenolic compound and vary between 2 and 20 µg/L for all compounds studied. Once the MAME conditions were optimized, the sediment was spiked with a standard certified mixture of the 11 phenols considered priority pollutants by the EPA. The extraction procedure was applied to test the validity of the proposed method. The results obtained are shown in Table IV, in which the high degree of accordance with the certified values in the case of both studied surfactants can be observed. Only in the case of 2,4-dinitrophenol were the recoveries lower, but this is in line with the results obtained in other studies in which the presence of methyl groups in the analyte inhibits the extraction (24).
LC analysis
Analytical applications
The analysis of the extracted samples was carried out using HPLC with UV detection. The chromatogram obtained for the mixture of phenols extracted of spiked sediment from Jandia Beach using genapol X-080 as the extractant is shown in Figure 3. The chromatogram obtained with polidocanol is similar. It can be observed that this mobile phase allows a good separation of analytes for both surfactants used and short analysis time. The corresponding calibration curves in both surfactants were obtained by duplicate injection of the sample containing a surfactant concentration of 2% (v/v) of polidocanol and genapol X-080 and the corresponding analyte concentration. Concentrations ranged between 100 and 1500 µg/L. A linear relationship was obtained between peak areas and the analyte concentrations, yielding high correlation coefficients (0.995). The relative standard deviations were calculated for six samples, to which the
Three different sediment samples from the Canary Islands coast (Taliarte harbor, Las Canteras beach, and Jandía beach) were spiked with the mixture of 15 phenols. These samples have different characteristics: particle size, organic matter, carbonates amount, and ferrous materials. The selected concentration level for spiking was the one typical of acute pollution events that may occur in industrial sites (39). The sediments were spiked 24 h before extraction. Table V shows the recoveries obtained in the extraction of these compounds in the three types of sediments using polidocanol and genapol X-080. It can be observed that the recovery percentages are better when polidocanol was used as the extractant agent. In the case of Taliarte sediment—some phenols, those which have methyl groups—have lower recoveries. This type of sediment has a lower particle size and a higher amount of organic matter. Electrostatic interactions can therefore take place between the organic matter and the alkylphenols (24). As a result, these types of analytes are more Table V. Determination of Phenolic Derivatives Mixture in Different Types of Marine Sediments* strongly retained in the sediment. When genapol X-080 was used to extract the Recovery (%)† phenolic compounds from the sediment, the recoveries obtained were lower than those Polidocanol Genapol X-080 achieved with polidocanol. As explained previCompounds Las Canteras Jandía Taliarte Las Canteras Jandía Taliarte ously, this surfactant is more viscous than polidocanol, and it could not contact the analytes as PH 111.1 101.9 100.2 86.0 73.0 78.1 efficiently. The values achieved for the sediment 4-NP 113.9 107.5 106.8 88.9 82.4 88.0 from Jandía beach are lower for most of the ana2,4-DNP 117.1 110.5 110.3 99.5 92.9 101.2 lytes studied. The main difference between this PC 101.3 98.1 90.7 85.6 71.3 88.6 type of sediment and the others is a higher 2-NP 103.6 97.4 101.8 97.3 82.3 97.6 amount of carbonates and lower ferrous mate2-CP 88.9 89.7 95.8 94.2 67.1 93.4 4-CP 114.4 107.2 105.9 49.4 59.2 65.9 rials. 2,4-DMP 104.2 96.4 69.4 79.4 67.3 70.7 Decreasing recoveries resulting from the aging 4,6-DNOC 114.9 107.8 107.8 97.0 83.7 98.7 of matrices is a well-known phenomenon (40). 4-CMC 107.4 99.6 101.3 92.2 71.1 85.7 The analytes present in the recent sediments 2,4,6-TMP 79.4 82.1 14.9 75.7 58.3 23.7 are more easily extracted than those that have 2,4-DCP 117.4 99.3 103.3 83.3 64.8 87.7 had a longer contact time. This can be explained 4-C-3,5-DMP 100.7 90.7 95.2 82.0 61.3 78.6 according to whether the analytes are incorpo2,4,6-TCP 108.3 100.6 107.3 97.0 86.4 101.1 rated by adsorption (short periods) or by sequesPCP 94.9 97.9 97.9 71.1 58.3 99.4 tration (longer periods) (41). The former * Chromatographic conditions: water (with 1% acetic acid)–methanol (70:30) in 16 min (isocratic), up to 100% phenomenon is involved at the early stages of methanol in 24 min; flow rate 1 mL/min. Amount added of each analyte 2 µg/g. sorption, in which H-bonding and Van der Waals † Mean of three determinations. forces often prevail. On the other hand, sequestra-
286
Journal of Chromatographic Science, Vol. 43, July 2005
References
Figure 4. Recoveries of phenolic compounds from fresh and aged samples using polidocanol.
tion involves sorption at remote microsites within the soil matrix (42). In order to study the aging effects, the MAME procedure was applied to marine sediment (Taliarte harbor) three and six months after the samples were spiked. Figure 4 shows the recoveries obtained for fresh and aged samples using polidocanol as extractant. The results obtained show that the recoveries decrease as the time of contact between the matrices and analytes increases, except for pentachlorophenol. In this way, it can be observed that this decreasing is lower for the samples aged for three months (recoveries higher than 70% are obtained for 13 phenolic derivatives) than for those aged for 6 months. In this case, only 10 compounds have recoveries above 50%. Although, in general, the recoveries obtained for aged samples are lower than those achieved for fresh samples, the proposed method can be applied to detect the presence of this type of compound in marine sediments.
Conclusion The determination of phenolic compounds in marine sediments by MAME with HPLC and UV detection has been described. The optimal conditions have been established. As can be seen from the results, the applicability of the proposed method provides a viable alternative to other extraction techniques. The main advantages of MAME are shorter extraction times, higher sample throughput, and organic-free solvents, which result in reduced cost and toxicity. The methodology developed allows the simple, fast, and selective determination of phenolic derivatives, including the 11 compounds considered to be priority pollutants by the EPA, in marine sediments.
Acknowledgments This study was funded by the Spanish Ministry of Science and Technology Project No. PPQ2002/04683.
1. J.W. Patterson. Waste Water Treatment Technology, Ann Arbor Science, Ann Arbor, MI, 1975. 2. R.L. Grob, Ed. Chromatographic Analysis of the Environment, 2nd ed. Marcel Dekker, New York, NY, 1983. 3. D. Puig and D. Barceló. Determination of phenolic compounds in water and waste water. Trends Anal. Chem. 15: 362 (1996). 4. M. Möder, S. Schrader, U. Franck, and P. Popp. Determination of phenolic compounds in waste water by solid- phase micro extraction. Fresenius’ J. Anal. Chem. 357: 326 (1997). 5. M.W. Powell. Development of a binary solid-phase extraction cartridge for use in screening water samples for organic pollutants. J. Chromatogr. A 697: 101 (1995). 6. M.R. Lee, Y.C. Yeh, W.S. Hsiang, and B.H. Hwan. Solid-phase microextraction and gas chromatography-mass spectrometry for determining chlorophenols from landfill leaches and soil. J. Chromatogr. A 806: 317 (1998). 7. L. Wennrich, P. Popp, and M. Möder. Determination of chlorophenols in soils using accelerated solvent extraction combined with solid-phase microextraction. Anal. Chem. 72: 546 (2000). 8. M. Ashraf-Khorassani, S. Gidanian, and Y. Yamini. Effect of pressure, temperature, modifier, modifier concentration, and sample matrix on the supercritical fluid extraction efficiency of different phenolic compounds. J. Chromatogr. Sci. 33: 658 (1995). 9. P. Patnaik. A Comprenhensive Guide to the Hazardous Properties of Chemical Substances. Van Nostrand Reinhold, New York, NY, 1992. 10. Environmental Protection Agency. Toxic Substance Control Act. U.S. EPA, Washington, D.C., 1979. 11. H.B. Lee, T.E. Peart, and R.L. Hong-You. In situ extraction and derivatization of pentachlorophenol and related compounds from soil using a supercritical fluid extraction system. J. Chromatogr. 605: 109 (1992). 12. H.B. Lee, T.E. Peart, and R.L. Hong-You. Determination of phenolics from sediments of pulp-mill origin by in situ supercritical carbondioxide extraction and derivatization J. Chromatogr. 636: 263–70 (1993). 13. J.J. Langenfeld, S.B. Hawthorne, and D.J. Miller. and J. Pawliszyn. Effects of temperature and pressure on supercritical fluid extraction efficiencies of polycyclic aromatic hydrocarbons and polychlorinated biphenyls. Anal. Chem. 65: 338–44 (1993). 14. C. Mahugo Santana, Z. Sosa Ferrera, and J.J. Santana Rodríguez. Use of non-ionic surfactant solutions for the extraction and preconcentration of phenolic compounds in water prior to their HPLC-UV detection. Analyst 127: 1031–37 (2002). 15. M. Ranil Criado, S. Pombo da Torre, S. Rodríguez Pereiro, and R. Cela Torrijos. Optimization of a microwave-assisted derivatization-extraction procedure for the determination of chlorophenols in ash samples. J. Chromatogr. A 1024: 155–63 (2004). 16. A. Peñalver, E. Pocurull, F. Borrull, and R.M. Marcé. Solid-phase microextraction coupled to high-performance liquid chromatography to determine phenolic compounds in water samples. J. Chromatogr. A 953: 79–87 (2002). 17. M.N. Sarrión, F.J. Santos, and M.T. Galceran. Determination of chlorophenols by solid-phase microextraction and liquid chromatography with electrochemical detection. J. Chromatogr. A 947: 155–65 (2002). 18. P. Barták and L. Cáp. Determination of phenols by solid-phase microextraction. J. Chromatogr. A 767: 171–75 (1997). 19. O.P. Heemken, T. Norbert, and B.W. Wendawiak. Comparison of ASE and SFE with Soxhlet, sonication, and methanolic saponification extractions for the determination of organic micropollutants in marine particulate matter. Anal. Chem. 69: 2171–80 (1997). 20. J. Snyder, R. Grob, M. McNally, and T. Oostdyk. Comparison of supercritical fluid extraction with classical sonication and Soxhlet extractions for selected pesticides. Anal. Chem. 64: 1940–46 (1992). 21. V. Lopez-Avila, R. Young, and N. Teplitsky. Microwave-assisted extraction as an alternative to Soxhlet, sonication, and supercritical fluid extraction J. AOAC Int. 79: 142–56 (1996).
287
Journal of Chromatographic Science, Vol. 43, July 2005
22. M. Letellier and H. Budzinski. Influence of sediment grain size on the efficiency of focused microwave extraction of polycyclic aromatic hydrocarbons. Analyst 124: 5–14 (1999). 23. M. Wei and J. Jen. Determination of chlorophenols in soil samples by microwave-assisted extraction coupled to headspace solid-phase microextraction and gas chromatography-electron-capture detection. J. Chromatogr. A 1012: 111–18 (2003). 24. M.A. Crespín, M. Gallego, and M. Varcárcel. Continuous microwave-assisted extraction, solvent changeover and preconcentration of monophenols in agricultural soils J. Chromatogr. A 897: 279–93 (2000). 25. R. Tukai, W.A. Maher, I.J. McNaught, and M.J. Ellwood. Measurement of arsenic species in marine macroalgae by microwave-assisted extraction and high performance liquid chromatography-inductively coupled plasma mass spectrometry. Anal. Chim. Acta 457: 173–85 (2000). 26. V. Pino, J.H. Ayala, A.M. Afonso, and V. González. Micellar extraction of polycyclic aromatic hydrocarbons from certified marine sediment. Int. J. Environ. Anal. Chem. 81: 281–94 (2001). 27. V. Pino, J.H. Ayala, A.M. Afonso, and V. González. Determination of polycyclic aromatic hydrocarbons in marine sediments by high-performance liquid chromatography after microwave-assisted extraction with micellar media. J. Chromatogr. A 869: 515–22 (2000). 28. A. Eiguren Fernández, Z. Sosa Ferrera, and J.J. Santana Rodríguez. Application of microwave-assisted extraction using micellar media to the determination of polychlorinated biphenyls in marine sediments. Anal. Chim. Acta 433: 237–44 (2001). 29. C. Padrón, A. Eiguren, Z. Sosa, and J.J. Santana. , Determination of organochlorinated compounds in marine organisms by microwaveassisted extraction with molecular organized systems and liquid chromatography with fluorescence detection. J. AOAC Int. 85: 44–49 (2002). 30. A. B. Prevot, M. Gulmini, V. Zelano, and E. Pramauro. Microwaveassisted extraction of polycyclic aromatic hydrocarbons from marine sediments using nonionic surfactant solutions. Anal. Chem. 73: 3790–95 (2001). 31. M. P. Llompart, R.A. Lorenzo, R. Cela, and J.R. Jocelyn Paré.
288
32.
33. 34.
35. 36.
37. 38. 39.
40.
41.
42.
Optimization of a microwave-assisted extraction method for phenol and methylphenol isomers in soil samples using a central composite design. Analyst 122: 133–37 (1997). A. Eguizabal, O. Zuloaga, N. Etxevarría, L.A. Fernández, and J.M. Madariaga. Comparison of microwave-assisted extraction and Soxhlet extraction for phenols in soil samples using experimental designs. Analyst 123: 1679–84 (1998). C. Sparr Eskilsson and E. Björklund. Analytical-scale microwaveassisted extraction. J. Chromatogr. A 902: 227–50 (2000). I.J. Barnabas, J.R. Dean, I.A. Fowlis, and S.P. Owen. Extraction of polycyclic aromatic hydrocarbons from highly contaminated soils using microwave energy. Analyst 120: 1897–1904 (1995). F.I. Omuska and K.A. Terry. Extraction of pesticides from sediments using a microwave technique. Chromatographia 36: 191–94 (1993). G. Xiong, J. Liang, S. Zou, and Z. Zhang. Microwave-assisted extraction of atrazine from soil followed by rapid detection using commercial ELISA kit. Anal. Chim. Acta 371: 97–103 (1998). C. Montgomery. Design and Analysis of Experiments, 3rd ed. John Wiley & Sons, New York, NY, 1991. S. Lindsay. High Performance Liquid Chromatography. John Wiley & Sons, New York, NY, 1992, p. 71. N.M. Laine, H. Haario, and K.S. Jorgensen. Microbial functional activity during composting of chlorophenol-contaminated sawmill soil. J. Microbial. Methods 30: 21–32 (1997). S.B. Hacothorne, E. Björklund, S. Bøwadt, and L. Mathiasson. Determining PCB sorption/desorption behavior on sediments using selective supercritical fluid extraction. Environ. Sci. Technol. 33: 3152–59 (1999). J. Dec and J. Bollag. Determination of covalent and non-covalent binding interactions between xenobiotic chemicals and soil. Soil Sci. 162: 858–74 (1997). F. Kopinke, J. Pörschmann, and U. Stottmeister. Sorption of organic pollutants on anthro-pogenic humic matter. Environ. Sci. Technol. 29: 941–50 (1995). Manuscript received July 2, 2004; revision received April 13, 2005.