matrix of piezoresistive force sensors with semi-conductive polymer composite ... piezoresistivity of carbon-black-filled silicone rubber based on differences in ...
> REPLACE THIS LINE WITH YOUR PAPER IDENTIFICATION NUMBER (DOUBLE-CLICK HERE TO EDIT)
REPLACE THIS LINE WITH YOUR PAPER IDENTIFICATION NUMBER (DOUBLE-CLICK HERE TO EDIT) < mathematical model between force applied to semi-conductive polymer composites and the consequent change of electrical resistance. In addition, the contact resistance between the electrodes and polymer composites is considered in the formulation. Semi-conductive polymer composite-made force sensors show drift in their output. The reason for this drift in such force sensors could be due to the creep behavior of the semi-conductive polymer composite used as the sensing element. If a polymer composite such as Linqstat, (a patented name), is subjected to a constant force, it exhibits creep behavior which causes the drift in the output of the force sensor [18]. In order to include the drift of the force sensor in the formulation, a viscoelastic model is used to represent semiconductive polymer composites based on their creep behavior. Hence, the strain rate of semi-conductive polymer composites is formulated and used in the proposed formulation. To verify the validity of the proposed formulation, an experimental setup was prepared and various tests were performed. Linqstat, as an industrial semi-conductive polymer composite, was selected to be tested. Furthermore, an accurate force sensor made from Linqstat material was developed and calibrated. The curve of force versus resistance for the sensor was determined and compared with the proposed formulation. In addition, a creep test was performed on Linqstat and the results were compared to the model predictions. Finally, it is shown that the proposed formulation is accurate and reliable for predicting the output of these piezoresistive force sensors fabricated from polymer composites used as sensing elements.
A. Review of related formulation In semi-conductive polymer composites, the matrix is selected from non-conductive polymers, while the filler is selected from conductive materials. By subjecting the polymer composite to compressive stress, the filler particles inside the matrix start to display micro-Brownian motion [15]. The fillers move closer to each other because of the strain in the matrix that causes a change in the electrical resistance the polymer composite. There are two main types of resistances that cause a change in resistivity within the composite, namely constriction resistance and tunneling resistance. It has been shown [14] that the total resistance of the polymer composites can be given as
R
L 1 Rm LRc S
4πs 2m 3 2m q 2 (2) J Ve h 2s h where q and m are electron charge and mass respectively, is the height of the potential barrier between two adjacent filler particles, h is Plank’s constant, V is the applied voltage, and s is the thickness of the insulating film. The height of the potential barrier can be extracted from the work function of the polymer. The between adjacent particles in a composite can be calculated by subtraction of the polymer (matrix) work function and the filler work function. In this current project, carbon black and polyethylene is used as the filler and matrix respectively. Therefore, the required potential height of carbon black and polyethylene is considered as 0.05 (eV) [21]. The tunneling resistivity is proportional to area a 2 [18] of the contact between two filler particles,
V 8 s Rm m e s 2 2 2 2 a a J 3a q
(1)
where Rm is the resistance between two adjacent filler particles, Rc is the resistance across a single filler particle, L is the
number of particles forming one conductive path, and S is the total number of effective conduction paths. The tunneling current would flow through a gap between adjacent particles [19]. The tunneling current at low applied voltages [20] can be written as:
(3)
where J is the tunneling current, and
4 2m (4) h By putting Rm in (1), and equating L 1 ~ L , [18] the total resistance can be introduced as
R
II. DEVELOPMENT OF THE PROPOSED FORMULATION
2
L 8 s s L e Rc S 3a 2 q 2 S
(5)
In this current research work, carbon black is selected to be the filler particle inside the matrix. The matrix is selected to be a nonconductive material with high resistance. Therefore, the resistance of carbon black, Rc , which is highly conductive can be considered negligible. So, L Rc in the above equation is S omitted for the coming derivations. By dividing the actual resistance with the initial resistance [18], the following formula can be obtained.
R s s s e 0 R0 s0
(6)
where R0 is the initial resistance of the composite, and s0 is the initial distance between two adjacent filler particles. As a result of application of stress to the composite, it is also assumed that only the polymer (matrix) would carry the load. The deformation of the filler particles is in the range of a few nanometers, which is negligible in comparison with that of the matrix. The inter-particle separation distance [18] can be simply shown as
s s0 1
(7)
> REPLACE THIS LINE WITH YOUR PAPER IDENTIFICATION NUMBER (DOUBLE-CLICK HERE TO EDIT) < where is the strain of the polymer matrix which could be considered time dependent. Wu [22] showed that the interparticle separation between two spherical fillers can be calculated from the following relation
1/3 s0 D 1 6
3
electrode and polymer would leave from the air vent in the tail of the sensor. This results in a sudden decrease in contact
(8)
where D is the filler particle diameter, and is the volume fraction of filler particles. By substituting (7) and (8) into (6), similar to that shown in [18], it can be written that
R 1 e R0
1/3 D 1 6
(9)
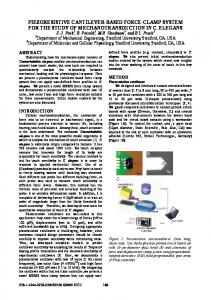
As mentioned earlier, R0 is the initial resistance of the polymer composite which can be measured by precise measurement techniques. B. Working principle of a piezoresistive force sensor In a typical force sensor that uses polymer composites, a thin layer of the polymer composite is sandwiched between two layers of electrode. The electrodes are then covered with two layers of polyester films. Figure 1.a shows the schematic view of the components of such a sensor.
Fig. 2. The schematic view of the piezoresistive force sensor based on semi-conductive polymer composites materials. The figure shows the working principle of the sensor.
resistance between the electrodes and the polymer composite. As shown schematically in Fig. 2, the average distance between conductor particles would decrease by applying force to the sensor. C. Contact resistance In order to obtain an accurate reading of the force sensor output, the contact resistance between electrodes and the polymer composite was taken into account. It has been shown that the effective contact area between two adjacent members is only a small fraction of the apparent macroscopic area of contact [23]. Looking at the contact interface on a microscopic scale, the roughness of surfaces would be evident. Therefore, the electrical contact would take place on both separable mating surfaces through asperities, or a-spots [24]. In the present work, it is assumed that there is no film resistance caused by thin oxide layers on the contact surfaces since the polymer, polyethylene, does not oxide in the room temperature. Therefore, based on this assumption total resistance of the force sensor which is read by a measurement system attached to the sensor can be written as
Rtotal 2RCon RPol
Fig. 1.a. View of the fabricated force sensor using Linqstat and its components b. The schematic view of current flow geometry
When a compressive force is applied to the surface of the force sensor, its resistance drops due to a decrease in the resistance of the piezoresistive polymer, and also due to a slight decrease in the contact resistance between the conductors and the piezoresistive polymer. In other words, applying force causes a decrease in distance between filler particles inside the matrix, and an increase in the number of conductive paths which leads to a decrease in the resistance of polymer composites. Because there is no adhesive between the electrodes and the polymer in the fabrication process, when force is applied air between the
(10)
where Rtotal is the total resistance of the sensor, RCon is the contact resistance between each electrode and polymer composite, and RPol is the resistance of the polymer composite which is to be determined. Figure 1.b shows the schematic view of the total electrical resistance of the sensor. By using the Holm and Greenwood formula [25], the contact resistance can be written as: 2 RCon 1 (11) 4na where 1 and 2 are the electrical resistivity of the two materials in contact, a is the radius of a-spot, and n is the number of a-spots. The number and the radius of a-spots increase when force is applied to the contact surfaces. Figure 3 shows the change in the number of electrical contacts and the change of the interface of two adjacent members upon applying force.
> REPLACE THIS LINE WITH YOUR PAPER IDENTIFICATION NUMBER (DOUBLE-CLICK HERE TO EDIT)
REPLACE THIS LINE WITH YOUR PAPER IDENTIFICATION NUMBER (DOUBLE-CLICK HERE TO EDIT)
REPLACE THIS LINE WITH YOUR PAPER IDENTIFICATION NUMBER (DOUBLE-CLICK HERE TO EDIT)
REPLACE THIS LINE WITH YOUR PAPER IDENTIFICATION NUMBER (DOUBLE-CLICK HERE TO EDIT)
REPLACE THIS LINE WITH YOUR PAPER IDENTIFICATION NUMBER (DOUBLE-CLICK HERE TO EDIT) < test, several constant forces with different magnitudes were applied to the force sensor. Then, the change in the resistance of the force sensor over time was recorded for each of the forces to show the creep behavior in the sensor output. The gathered data for each force were finally compared to the theoretical model prediction for that specific force as shown in Fig. 9.b. To include all the comparison results together, the chart was drawn in logarithmic scale for the resistance. As can be seen from the test results of the comparison in Fig. 9.b, the model predictions closely match the experimental results of the test. The proposed theoretical model contains three variables namely, resistance, force, and time. The relationship of these three variables is shown in Fig. 10 as a three dimensional surface. The piezoresistive behaviour of other kind of semi-conductive polymer composites, such as Velostat, can be predicted by the developed model. Linqstat and Velostat have some differences in the size and the volume fraction of carbon black particles, and in the type of the nonconductive polymer, resulting in different hardnesses for Velostat and Linqstat. Hence, the model can be also used for another type of semi-conductive polymer composites by populating the model with appropriate parameters.
[5] W.E. Mahmoud, A.M.Y. El-Lawindy, M.H. El Eraki, and H.H. Hassan. “Butadiene acrylonitrile rubber loaded fast extrusion furnace black as a compressive strain and pressure sensors”. Sens Actuat A Phys, vol. 136, pp. 229–233, 2007. [6] L. Wang, Ding TH, and P. Wang,”Effects of conductive phase content on critical pressure of carbon black filled silicone rubber composite”. Sens Actuat A Phys, vol.135, pp. 587–592, 2007.
V. SUMMARY AND CONCLUSION A novel formulation has been developed for modeling the dependence of electrical resistivity of semi-conductive polymer composites on an applied load. The proposed formulation includes a viscoelastic model that shows the creep behavior within semi-conductive polymer composites. Moreover, the contact resistance was also included in the proposed formulation. Although contact resistance is not a large factor at high resistances, it turns out that it does have a significant effect in the lower range of resistance. This is very important given the fact that the working range of the sensor needs to be accurate from 0.5 N to 5 N. Linqstat as a semi-conductive polymer composite was selected to verify the validity of the proposed formulation by means of experiments. Creep tests were performed on Linqstat samples and the viscoelastic parameters were determined. In addition, by using Linqstat, an accurate force sensor was fabricated because the results obtained from the formulas corresponded very closely to the actual output readings from the sensors. REFERENCES N. Hu, Y. Karube, C. Yan, Z. Masuda, and H. Fukunaga, “Tunneling effect in a polymer/carbon nanotube nanocomposite strain sensor”, Acta Materialia, vol. 56, issue 13, pp. 2929-2936, 2008. [2] M. Knite, V. Teteris, A. Kiploka, and J. Kaupuzs “Polyisoprene-carbon black nanocomposites as tensile strain and pressure sensor materials”. Sens Actuat A Phys, vol. 110, issue 1-3, pp.142-149, 2004. [3] S. Qu, S.C. Wong. “Piezoresistive behavior of polymer reinforced by expanded graphite”. Compos Sci Technol, vol. 67, pp. 231–237, 2007. [4] L. Wang, Ding TH, and P. Wang “Effects of compression cycles and precompression pressure on the repeatability of piezoresistivity for carbon black-filled silicone rubber composite”. J Polym Sci B Polym Phys, vol. 46, pp.1050–1061, 2008.
8
[1]
Fig. 9. a. Comparison of the experimental results and the theoretical results for change of resistance per applied force b. Comparison of the experimental results and the theoretical results for change of resistance over time for different force magnitudes
> REPLACE THIS LINE WITH YOUR PAPER IDENTIFICATION NUMBER (DOUBLE-CLICK HERE TO EDIT)