Journal of the Korean Magnetic Resonance Society 2013, 17, 40-46 DOI
10.6564/JKMRS.2013.17.1.040
A new approach to quantify paraquat intoxication from postmortem blood sample by using 1H qNMR method Ran Seon Hong1†, Hwang Eui Cho1, Dong Woo Kim2, Sang Hee Woo2, Sanggil Choe2, Suncheun Kim1,2, Jin Tae Hong1, Dong Cheul Moon1* 1
College of Pharmacy, Chungbuk National University, Cheongju 361-763, Korea 2 National Forensic Service, 305-348, Korea
Received May 28, 2013; Revised June 10, 2013; Accepted June 12, 2013
Abstract For a case study of suspected paraquat intoxication, we developed a simple and rapid method of 1H qNMR to determine the mili-molar amount of paraquat in postmortem blood samples. There were no interfering signals from endogenous compounds in the chemical shift of paraquat and diquat (internal standard). The amount of sample used ranged from 0.25 mM to 10.0 mM. Diquat, which has similar physicochemical properties with paraquat, was chosen as an internal standard. The NMR experimental conditions, relaxation delay time and CPMG spin-echo pulse sequence were optimized. The developed method was validated in terms of specificity, accuracy, precision, matrix effect, recovery, limit of detection (LOD), and low limit of quantification (LLOQ). The proposed qNMR method provided a simple and rapid assay for the identification and quantification of the quaternary ammonium herbicide, “paraquat” in postmortem blood samples. This method was tested by using the blood from the heart of a man who was intoxicated with paraquat. In this particular case, the level of paraquat was 1.07 mM in the blood. For the determination of quaternary ammonium herbicides, qNMR could also be used to provide a better understanding of the currently available techniques. Keywords
Paraquat, 1H qNMR, whole blood
Introduction Paraquat (1,1’-dimethyl-4,4’-bipyridyliumdichloride) is a widely used herbicide because it becomes quickly inactive against surrounding environment after promptly reacting to green plant tissue. Under normal conditions of the manufacture and usage of paraquat, it has proven to be safe in practice. However, over the past decades, many intentional or accidental intoxication cases have been reported1-2. In the majority of these cases, paraquat poisoning was caused by oral ingestion. Mild poisoning cause gastric upset and oral irritation, and has a good prognosis for a full recovery3. But ingesting a large amount of paraquat is considered to be fatal, and leads to death due to multiple-organ failure and cardiogenic shock within 1-4 days. Absorbed paraquat accompanied by variety of symptoms-severe and extensive fibrotic lung changes, myopathy with extensive degeneration, and fibrosis of the skeletal muscle. And then it is lead to death immediately or only a few days later. In fatal case related with paraquat intoxication, plasma levels of victims who died within one day of ingestion ranged from 2.3 to 646.6 μg/ml and those of victims who died between 1 approximately 4 days ranged from 0.9 to 25.1 μg/ml (average 7.0 μg/mL) 4. Until now, analytical methods based on chromatographic techniques such as GC-MS and
* Address correspondence to: Dong Cheul Moon, College of Pharmacy, Chungbuk National University, Cheongju 361-763, Korea, Tel: 82-43-261-2819; Fax: 82-43-268-2723;. E-mail:
[email protected]
Ran Seon Hong et al / J. Kor. Magn. Reson., Vol.17, No. 1, 2013
LC-MS have been widely used to determine the absorbed amount of paraquat in various matrices including biological samples5-7. However, for the GC-MS analysis, a chemical reduction is performed by adding reducing agents such as sodium tetrahydroborate in order to obtain more volatile compounds8. This method is complicated of the sample pretreatment process. For the LC-MS measurement, sample preparation includes solid phase extraction (SPE) that uses weak cation exchange cartridges9-10. Moreover, reversed phase HPLC requires a retaining and separating procedure, which can be difficult to do with strong ionic compounds such as paraquat11-12. Therefore, the need to develop a simple and highly reproducible method of analysis to replace it has emerged. Nuclear magnetic resonance (NMR) spectroscopy can be considered as the leading non-destructive analytical tool13 used for the structural analysis of biomolecules14 and quantitative measurements by analytical chemists15-18. NMR is developing into a powerful tool for quantification because of the direct proportionality of signal intensity to the concentration of resonating nuclei. The 1H qNMR has been used as an available method to measure the analyte concentration of natural products and various biological samples19-21. The 1H qNMR has been proven to be highly suitable for the simultaneous selective recognition and quantitative determination of metabolites in complex biological matrices22. In terms of application of NMR to human whole blood, the composition of the blood can affect the course of the analysis. Thus, although analyte concentration can be measured directly by NMR spectroscopy like ERETIC (Electronic Reference To access In vivo Concentrations)23, the addition of the internal standard can be useful to avoid effect of matrix and recovery. The purpose of this study is to establish and validate a fast, simple, and reliable alternative method of quantification for paraquat. We determined the amount of paraquat in the whole blood of a man suspected dead from paraquat poisoning.
Experimental Methods Sample- We have received one intoxicated blood sample and five postmortem blood samples from National Forensic Service and these samples were kept at -20 ℃ until performing analysis. We recruited paraquat dichloride tetrahydrate (1,1’-dimethyl-4,4’bipyridinium dichloride tetrahy drate) and diquat dibromide were purchased from Chem Service, Inc. (West Chester, PA, USA). All chemicals and reagents were used without further purification. Preparation of whole blood samples- 1 mL of whole blood samples was taken into a 2-mL micro-tube and then 1 mL of TCA solution (10%, w/v in D2O), which include 0.1% TSP and 4 mM diquat (IS), was added. The sample mixture was vortex-mixed for 10 min, then centrifuged at 13,000 × g for 10 min. A portion of the supernatant was pipetted into a 5 mm NMR tube for NMR measurements. Preparation of stock standards and QC samples- The stock solutions of paraquat (100 mM in D2O) and IS (40 mM in D2O) were prepared, and then kept at 4°C in amber glass vessels. Working standard solutions were prepared by serial dilutions of the stock solutions with deuterium oxide containing 0.1% TSP to required concentrations. Quality control (QC) samples (n=7) were prepared by addition of the corresponding working standard solutions (1 mL) to drug-free whole blood (1 mL) to make final concentrations to be 0-, 0.25-, 0.5-, 1.0-, 2.0-, 5.0and 10.0 mM of paraquat. NMR spectroscopy- 1H NMR spectra of the prepared blood samples were performed using a Bruker Avance III 400 MHz spectrometer (Bruker Biospin, Karlsruhe, Germany) with 5 mm I.D broad band BBFO probe. The temperature was controlled at 298 K. The NMR spectra for each sample were acquired by using water suppression CPMG (Carr-Purcell Meiboom-Gill) spin-echo pulse sequence. By using the CPMG pulse sequence the peak complexity due to fat and protein remained in the blood samples can
41
42
1
H qNMR method to quantify paraquat intoxication
be reduced. For each sample, 32 transients were collected into 64 k data points using a spectral width of 4795 Hz, a relaxation delay time of 20 s, and an acquisition time of 6.83 s. To fit the exact frequency the probehead was tuned and matched automatically as command “atma exact”. NMR data processing- Data processing included 0.3 Hz exponential line broadening factor. The spectra were subsequently manually phased and the baseline-corrected. The experimental conditions and parameters described above were equally applied for calibration and quantification. For quantitative works, peak area was used and the integration limits of each peak were selected manually. Each selected signal was integrated three times and the results were averaged in order to minimize errors from manual integration. Method validation- Specificity of the method was determined by analyzing five postmortem blood
samples from different sources to identify the presence of signal interferences from endogenous components. Linearity was prepared for the 6 QC samples (calibration standards: 0.25-, 0.5-, 1.0-, 2.0-, 5.0- and 10.0 mM paraquat in drug-free whole blood), the standards were then processed by the sample work-up procedure and measured as already described. The precision and accuracy of the method were determined by 5 replicate measurements of the three batches of the QC samples (nominal concentration, 0.5-, 2.0-, and 5.0 mM of paraquat) within a day and on five separate days. The precision was calculated by the intra- and inter-day percent relative standard deviation (RSD). The accuracy was measured as the percentage deviation from the nominal concentration. The recovery of analyte was obtained for three concentrations (0.5-, 2.0-, and 5.0 mM) in five replicates. Recovery was calculated as the ratio of the mean response of the analyte spiked into drug-free whole blood to that of the control samples after sample preparation step as described
4
5
5
N+
N+
4
3
3 2
2
N+ CH 3
H 3C N+
1
1
2
3
3
2
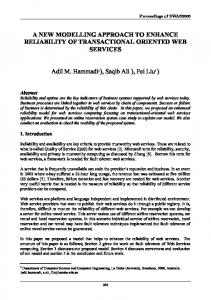
Figure 1. 1H NMR spectra of blank and control samples. The rectangle is a quantitative region of analyte (DH-2 and PH-2 denote the quantitative peaks of IS and paraquat, each respectively). (A) Blank whole blood, (B) Diquat (2mM) in whole blood and (C) Paraquat (2mM) in whole blood; DH-n and PH- n are protons attached in n - carbon of IS and paraquat, each respectively.
Ran Seon Hong et al / J. Kor. Magn. Reson., Vol.17, No. 1, 2013
before. Since the endogenous substance could have potential effects on the analyte, the matrix effect was investigated. To prepare the spiked-after-extraction samples, blank whole blood was processed according to the sample preparation procedure as described above. All the supernatant solution was mixed with the appropriate standard solutions of paraquat at concentrations corresponding to the final concentrations of the pretreated blood samples. The LLOQ was estimated at a signal-to-noise (S/N) ratio of 10 by recording a series of diluted paraquat solutions with the blood samples.
Results and Discussion Selection of sample preparation methods- The conventional HPLC, LC- and GC-MS methods require extensive sample preparation procedure such as SPE or solvent extraction. It is cumbersome, time consuming, and can also cause a loss of sample. Here, we describe a simple protocol for sample preparation from whole blood without any need of extraction. The sample preparation was only double dilution with deproteination of postmortem whole blood samples, which require minimal sample handling, and as simple as given the chemical characteristics of the analyte in the biological matrix. Because paraquat is freely soluble in water, simple dilution was suitable. The protein precipitation by 10% TCA in D2O gave approximately 98% recovery of the analyte providing sufficient clean substance for thereafter analysis. The question that existed was whether the recovery would be the same for diverse blood sample of different composition. The answer to this question would be to use IS (diquat) which is similar to the paraquat. Longitudinal relaxation time (T1) measurement- In order to obtain reliable, precise and accurate results for quantitative analyses by using the 1H qNMR technique, it is critical to set appropriate parameters for the acquisition and processing of 1H NMR spectra. For quantitative purposes, a minimum D1 (relaxation delay time) of 5*T1longest is required to ensure the
complete relaxation of all quantified protons to be able to obtain equal response factors in a single run. Thus the T1 values of the quantified proton of paraquat and diquat need to be measured. In this study, solutions of paraquat with the PH-2 signal (2 mM) at δ 9.05 ppm and diquat with the DH-2 signal (2 mM) at δ 9.19 ppm were used for calibration. The T1 values were determined by using an inversion recovery sequence with 10 inversion time values between the range of 10 ms-15 s (0.01, 0.05, 0.1, 0.25, 0.5, 1, 2, 4, 8, 15 s). Subsequently, data was computed by using the T1 calculation software of the spectrometer. The measured T1 values were 3.36 (paraquat) and 3.65 (diquat) s at 2 mM and 298 K. Taking into account these T1 values, the relaxation delay time (D1) was set at 20 s to ensure full relaxation of all quantified protons. Total experimental time for each run was 15 minutes. Method validation- The specificity and selectivity have been studied by using independent blood samples from five different deceased. Typical 1H NMR spectra are presented in Figure 1. In the region of δ 8.0-9.5 ppm, the paraquat signals at δ 9.1 (d, J=6.72 Hz, 4H), 8.5 (d, J=6.68 Hz, 4H) ppm and the diquat signals at δ 9.25 (d, J=5.2 Hz, 2H), 9.0 (dd, J=8.15, 1.16 Hz, 2H), 8.93 (dd, J=7.9, 1.4 Hz, 2H), 8.40 (ddd, J=7.64 ,5.98, 1.31 Hz, 2H) ppm. The 1H NMR spectra revealed that there was no interfering signal derived from the endogenous components at the reference 1H chemical shift of paraquat (PH-2) and diquat (DH-2). The chemical shift of reference peaks according to the concentration variation was less than 0.01 ppm and for different variations in the blood was lower than 0.005 ppm. As the effect of the concentration and matrix for the chemical shift of the analyte were negligible, quantitative peaks chosen for the blood samples could be considered suitable. A linear regression analysis was performed using a theoretical concentration value (x) and the experimental concentration data (y) to determine the correlation coefficient (r2). The curve was linear over the concentration range, 0.25–10.0 mM with r2 of 0.9996. The mean equation (n=5) of the regression line was y=0.9297x – 0.0581. Good linearity was
43
44
1
H qNMR method to quantify paraquat intoxication
obtained in this concentration range. LOD was 0.05 mM (9.3 μg/mL), which was defined as the concentration of analyte giving a S/N of 3 by recording a series of diluted paraquat solutions with known concentrations. Furthermore, LLOQ was 0.1 mM (18.6 μg/mL), which was defined as the lowest concentration in the linear range that could be detected with a variation within 20% (119%). The accuracy of a measurement system is the closeness of agreement between a measured concentration and its true value. The intra- (n=5) and inter-day (n=5) precision and accuracy are summarized in Table 1. The inter-day assay variations were determined by duplicates of QC samples obtained on five different days. In both cases, the accuracy ranged from 99.05% to 110.69% at the concentrations investigated and the RSDs were less than 1.3%, which indicated excellent agreement between the measured and theoretical concentrations among absolute errors. In this study, the recovery and the matrix effect were evaluated by analyzing QC samples over a range of 0.5-5.0 mM. The recovery and the matrix effect of paraquat in blood samples are presented in Table 2.
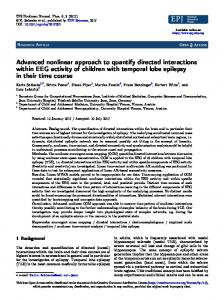
The recovery of the paraquat was 98.84-101.93% and average matrix effect values obtained for the matrix effect were 101.53-104.00% at tested concentrations, respectively. This method had higher selectivity for paraquat detection in blood than other previously reported methods and, hence, it provided good reproducible quantitative values. Application for the poisoning case- The deceased was a 50-year-old man with diabetes mellitus. He was staying alone and was financially supported by his family. The doctor overseeing his care carried out a postmortem examination and concluded that he had died of low blood glucose levels and myocardial infarction. During the autopsy, it was discovered that his intestine and stomach had a greenish appearance and was suspected that he had been intoxicated with Gramoxone®, which is the brand name of the herbicide containing paraquat. The developed 1H qNMR method was used to analyze the sample from the victim. The 1H NMR spectrum of the victim’s blood sample is presented in Figure 2. Paraquat was successfully determined in the sample. In this case, the concentration of paraquat in
Table 1. Precision and accuracy for the assay of paraquat in postmortem whole blood Intra-assay (n=5) Nominal conc. (mM )
M easured conc. (M ean ± SD, mM )
Inter-assay (n=5)
RSD
Accuracy
(%)
(%)
M easured conc. (M ean ± SD, mM )
RSD
Accuracy
(%)
(%)
0.5
0.55 ± 0.01
1.3
109.78
0.55 ± 0.00
0.64
110.69
2
1.98 ± 0.00
0.17
99.05
1.99 ± 0.01
0.49
99.36
5
5.06 ± 0.04
0.72
101.17
5.08 ± 0.05
0.98
101.69
Table 2. Recovery and matrix effect for paraquat in postmortem whole blood (n=5)
Nominal conc.
Recovery
RSD
M atrix effect
RSD
(mM )
(M ean ± SD, %)
(%)
(M ean ± SD, %)
(%)
0.5
100.23 ± 2.09
2.08
101.53 ± 4.64
4.57
2
101.93 ± 2.08
2.04
102.79 ± 6.15
5.99
5
98.84 ± 5.88
5.95
104.00 ± 3.32
3.19
Ran Seon Hong et al / J. Kor. Magn. Reson., Vol.17, No. 1, 2013
the whole blood was 1.07 mM (199 μg/mL). Conclusion The 1H qNMR method for the determination of paraquat in whole blood was developed and validated. The method showed acceptable linearity, precision, accuracy and recovery. This is the first application of 1 H qNMR for the identification and quantitation of paraquat in postmortem whole blood sample. The resulting LOD (9.3 μg/mL) and LLOQ (18.6 μg/mL) values were higher than those by chromatographic
methods such as GC and LC, etc. Nonetheless, this method has many advantages comparing with the previous methods-simple and rapid analytical method with minimal sample pretreatment. In the cases of overdose of drugs, this qNMR measurement could be an alternative method to find out the cause of death from the paraquat. If high field NMR is applied to the quantitative analysis, sensitivity and resolution will be improved. This technique is not commonly used yet in toxicology or forensic science. But because of its simplicity and specificity 1H qNMR is considered very useful method for poisoning cases.
Figure 2. 1H spectrum of blood obtained from victim spiked with IS.
Acknowledgement This work was supported by the research grant of Chungbuk National University in 2012.
References 1. 2. 3. 4. 5.
A. van Dijk, R.A.A.M.a.R.H.D.J.M.D.a.A.N.P.v.H., Archives of Toxicology 34, 129 (1975). Erickson, T., et al., J Emerg Med, 15, 649 (1997). Houze, P., et al., Hum Exp Toxicol, 9, 5 (1990). Lee, S.K., et al., Int J Legal Med, 112, 198 (1999). Moreira, P.N., et al., Biomed Chromatogr, 26, 338 (2012).
45
46
1
H qNMR method to quantify paraquat intoxication
6. 7. 8. 9. 10. 11. 12. 13. 14. 15. 16. 17. 18. 19. 20. 21. 22. 23.
Taguchi, V.Y., et al., J Am Soc Mass Spectrom, 9, 830 (1998). Ludwig-Kohn, H., et al., Clin Chim Acta, 121, 189 (1982). de Almeida, R.M. and M., J Chromatogr B Analyt Technol Biomed Life Sci, 853, 260 (2007). Lee, X.P., et al., J Mass Spectrom, 39, 1147 (2004). Bo, H., Se Pu, 29, 180 (2011). Whitehead, R.D., Jr., et al., J Chromatogr B Analyt Technol Biomed Life Sci, 878, 2548 (2010). Castro, R., E. Moyano, and M.T. Galceran, J Chromatogr A, 914, 111 (2001). J. Jung, G. S. Hwang, J. Kor. Magn. Reson. Soc. 15, 54 (2011). H. Kim, E. Hong and W.Lee, J. Kor. Magn. Reson. Soc. 15, 115 (2011). Martinez-Bisbal, M.C., et al., NMR Biomed, 22(2), 199 (2009). Malet-Martino, M. and U. Holzgrabe, Journal of Pharmaceutical and Biomedical Analysis, 55(1), 1 (2011). Holzgrabe, U., Prog Nucl Magn Reson Spectrosc, 57(2), 229 (2010). Li, K., et al., Anal Bioanal Chem, 405, 2619 (2013). Ding, P.L., et al., J Pharm Biomed Anal, 60, 44 (2012). Molinier, V., et al., Carbohydr Res, 341(11), 1890 (2006). Imbenotte, M., et al., Forensic Science International, 133(1–2), 132 (2003). Lourenco, A.B., et al., PLoS One, 8(2), e55439 (2013). Akoka,S., et al., Anal Chem, 71(13), 2554-7 (1999).