Can. J. Fish. Aquat. Sci. Downloaded from www.nrcresearchpress.com by NORTHWEST FISHERIES SCIENCE CENTER on 12/11/12 For personal use only.
2112
A new conceptual framework for evaluating the early ontogeny phase of recruitment processes among marine fish species Miriam J. Doyle and Kathryn L. Mier
Abstract: For Gulf of Alaska (GOA) fish populations, ordination by principal component analysis of a matrix of species by early life history and ecological traits resulted in distribution of species along three primary gradients. These are synonymous with phenology of egg and larval production, quantity of production, and ubiquity of larvae, the latter representing temporal and spatial extent of distribution in the pelagic environment. GOA species were assigned to categories that shared similar positions in ordination space relative to the three primary gradients. From this comparative analysis, a conceptual framework is proposed for species’ early life histories representing trade-offs in adaptation to prevailing environmental conditions and associated vulnerability and resilience factors that may modulate species’ recruitment responses to environmental variability. The utility of this framework for evaluating response to environmental forcing was supported by the analysis of a 27-year time series of GOA late spring larval fish abundance. The hypothesis for this ongoing research is that we can utilize similarities in reproductive and early life history characteristics among species to identify (i) ecologically determined species groups that are predisposed to respond to environmental forcing in similar ways and (ii) plausible environmental predictors of recruitment variation attributable to aspects of early life history. Résumé : Pour des populations de poissons du golfe de l’Alaska (GOA), l’ordination par analyse en composantes principales d’une matrice d’espèces en fonction de caractères écologiques et relatifs aux premiers stades du cycle biologique a produit une distribution des espèces le long de trois gradients principaux. Ces gradients correspondent a` la phénologie de la production d’œufs et de larves, a` la quantité de production et a` l’ubiquité des larves, cette dernière représentant l’étendue temporelle et spatiale de la répartition dans le milieu pélagique. Les espèces du GOA ont été affectées a` des catégories occupant des positions semblables dans l’espace d’ordination relativement aux trois gradients principaux. À la lumière de cette analyse comparative, un cadre conceptuel est présenté qui décrit les premiers stades du cycle biologique des espèces en terme de compromis associés a` l’adaptation aux conditions ambiantes et des facteurs de vulnérabilité et de résilience connexes qui pourraient moduler des modifications au recrutement des espèces découlant de la variabilité du milieu. L’utilité de ce cadre pour évaluer la réponse a` des forçages environnementaux est corroborée par l’analyse d’une série chronologique de 27 ans de données sur l’abondance de larves de poissons a` la fin du printemps dans le GOA. L’hypothèse qui sous-tend ces travaux veut que les similitudes entre espèces sur les plans des caractères reproductifs et des premiers stades du cycle biologique puissent être utilisées pour cerner (i) des groupes d’espèces déterminés écologiquement prédisposés a` réagir de manière semblable a` des forçages environnementaux et (ii) des prédicteurs environnementaux plausibles de la variation du recrutement attribuable a` différents aspects des premiers stades du cycle biologique. [Traduit par la Rédaction]
Introduction Understanding what regulates recruitment variability has been the number one issue in fisheries science since the early 20th century. It is one of the major sources of uncertainty in contemporary endeavors to forecast the response of marine fish populations to natural and anthropogenic-induced climate variability (Ottersen et al. 2004; Hollowed et al. 2009;
Rijnsdorp et al. 2009). Recruitment here is defined as the survival of young of any fish species through the larval and juvenile stages to the age- or year class at which they physically join the adult population and become sexually mature. The age at recruitment is variable among species, depending on factors such as age at reproductive maturity, longevity, and ontogenetic variation in habitat. The contemporary conceptual view of marine fish recruitment is that of a complex system of
Received 13 April 2012. Accepted 25 September 2012. Published at www.nrcresearchpress.com/cjfas on 4 December 2012. cjfas-2012-0171 Paper handled by Associate Editor Carl Walters. M.J. Doyle. Joint Institute for the Study of the Atmosphere and Oceans, University of Washington, P.O. Box 355672, Seattle, WA 98195, USA. K.L. Mier. NOAA, National Marine Fisheries Service, Alaska Fisheries Science Center, 7600 Sand Point Way NE, Seattle, WA 98115, USA. Corresponding author: Miriam J. Doyle (e-mail:
[email protected]). Can. J. Fish. Aquat. Sci. 69: 2112–2129 (2012)
doi:10.1139/cjfas-2012-0171
Published by NRC Research Press
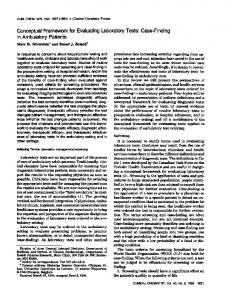
interacting biological and physical processes integrated over several early life stages, with a myriad of factors interacting at each stage and across scales to influence population abundance and variability (e.g., Bailey et al. 2005; Houde 2008; Wood and Austin 2009). The interaction of these multiple environmental forcing factors makes it difficult to establish unequivocal linkages between changes in the oceanic environment and recruitment among individual fish species and populations. Furthermore, established associations with various environmental variables can change over time, especially with climate and ecosystem shifts (Bailey 2000; Ottersen et al. 2004). Acknowledgement of this complexity, along with the adoption of ecosystem-based fisheries management policies, has led to new challenges among fisheries scientists that study reproductive and recruitment processes among marine fish stocks. Single-species recruitment forecasting for commercial fish populations remains a formidable challenge, but is no longer the only focus of research on recruitment processes. Rather, appreciating recruitment variability across a diverse range of species, explaining probable causes, and understanding this variability in the context of broader marine ecosystem dynamics and climate change are identified as worthy goals (Houde 2008). The utilization of multispecies comparative frameworks is considered to be a valuable approach in the identification and elaboration of important mechanistic linkages between fish population fluctuations and the ocean environment (Rijnsdorp et al. 2009; Bakun 2010). There has been some success in the development of multispecies life history frameworks in this respect. Based on a quantitative analysis of a suite of life history traits in North American freshwater and marine fishes, Winemiller and Rose (1992) proposed a triangular model of life history strategies with three end points (opportunistic, periodic, and equilibrium) that explain adaptive response to environmental variation in terms of three key life history traits: parental investment in offspring, fecundity, and size or age at maturity (Fig. 1). The opportunistic strategy is typified by low age at maturity, low levels of fecundity, short generation time, and small body size. Although rates of survivorship to adulthood are low, the early maturity and short generation time allows rapid recovery from unfavorable conditions. The periodic strategy maximizes longevity and fecundity, but with a trade-off in terms of delayed maturity and poor, although extremely variable, early survivorship that results in “periodic” recruitment success. Equilibrium strategists optimize early survivorship through the production of small numbers of large eggs that are subject to parental care and hatch out into well-developed larvae. The latter strategy is favored by stability of environmental resources that result in relatively stable levels of recruitment. The Winemiller and Rose model has been adapted as a framework for predicting population responses among fish species to diverse natural and anthropogenic disturbances (King and McFarlane 2006; Winemiller 2005; Yatsu et al. 2008). Rose (2005) offers a critique of their initial model by suggesting that population responses should be considered in terms of a broader range of life history traits than the three (maturation, fecundity, and parental care) defining the Winemiller and Rose model. From an early life history perspective, it would seem that its effectiveness may be compromised by the omission of early life history characteristics that initiate the recruitment process, specifically suites of charac-
2113 Fig. 1. A modified version of the three end-point life history framework for fish proposed by Winemiller and Rose (1992) and Winemiller (2005). End-point strategies are labeled periodic, opportunistic, and equilibrium, representing extreme ends of three primary life history gradients: fecundity, age at maturity, and parental care.
PERIODIC
Fecundity
Can. J. Fish. Aquat. Sci. Downloaded from www.nrcresearchpress.com by NORTHWEST FISHERIES SCIENCE CENTER on 12/11/12 For personal use only.
Doyle and Mier
Ag
rity atu m t ea
OPPORTUNISTIC
Pa r en
tal car e
EQUILIBRIUM
teristics representing diverse patterns of exposure to the ocean environment during early ontogeny. We propose that the predictive capacity of the Winemiller and Rose (1992) life history approach can be enhanced by the incorporation of a comprehensive suite of early life history attributes into a new conceptual model representing early life history exposure and response to the marine environment during the early ontogeny phase of the recruitment process. This hypothesis is tested for fish species in the Gulf of Alaska (GOA), where ichthyoplankton, fisheries, and oceanographic data have been collected for several decades. For GOA fish species, a diverse range of early life history patterns is observed among the three categories: periodic, epportunistic, and equilibrium strategists (Matarese et al. 1989; Doyle et al. 1995, 2002a). Even within phylogenetic groups such as pleuronectid flatfish (periodic strategists) that dominate this region, there is a high diversity of early life history strategies and characteristics. Furthermore, synthesis of an ongoing GOA ichthyoplankton abundance time series, and concurrent climate and ocean data, reveal synchronies and similarities in larval abundance trends and links to environmental variables that reflect early life history variation among species (Doyle et al. 2009). Similarities in response to environmental forcing are apparent when there are similarities in early life history exposure to the environment. These exposure–response connections suggest that species groups based on early life history patterns may represent “functional assemblages” that have common vulnerabilities, resilience, and potential response to environmental change. The objectives of this research include the identification of major early life history and ecological gradients among GOA fish species, delineating and characterizing species groups based on these gradients, and the construction of a conceptual framework of GOA early life history processes representing exposure and adaptation to the environment prior to recruitment. It is hypothesized that the emergent species groups will display within-group similarities in time series of abundance metrics and in links between these abundance metrics and Published by NRC Research Press
2114
Can. J. Fish. Aquat. Sci. Vol. 69, 2012
60°N
Alaska
A
di Ko
Bering Sea
A
55°N
CC
Shelikof Strait
CC
Can. J. Fish. Aquat. Sci. Downloaded from www.nrcresearchpress.com by NORTHWEST FISHERIES SCIENCE CENTER on 12/11/12 For personal use only.
Fig. 2. Map of the northwest Gulf of Alaska showing bathymetry and prevailing circulation features as described in Stabeno et al. (2004).
ak
am e r St
ka s a Al
Gulf of Alaska Russia
Bathymetry metres
Canada USA
0
125
250
500 km
200 1000
160°W
suites of environmental forcing variables. Among-species synchronicity in the larval abundance time series is explored here.
Materials and methods Study area The GOA is a semi-enclosed ocean basin in the North Pacific Ocean characterized by a continental shelf and slope with complex bottom topography and a productive ecosystem that supports numerous species of fish, and commercial and recreational fisheries. The general topography, meteorology, oceanography, biology, and fisheries have been well documented and described based on decades of scientific investigations (Hood and Zimmerman 1986; Stabeno et al. 2004; Mundy 2005). For this study, the area of interest is the northwest GOA incorporating the shelf, slope, and adjacent deep water between 140°W and 170°W (Fig. 2). Ocean circulation in this area is dominated by the southwesterly flowing Alaskan Stream that flows roughly parallel to the shelf break and the vigorous and dynamic Alaska Coastal Current (ACC) on the shelf. Strong but variable cyclonic winds and substantial freshwater runoff drive the ACC and contribute to its seasonal
150°W
dynamics (Stabeno et al. 2004). For most of the year alongshore winds are downwelling-favorable, whereas the summer is characterized by intermittent upwelling-favorable winds. The ACC is a primary dispersal path for planktonic organisms on the shelf, including the early life history stages of the fish populations in this region (Mundy 2005). Other important circulation features include tidal mixing, topographic steering, eddies, and deep-water advection in canyons and troughs, all of which can contribute to the replenishment of nutrients in coastal and shelf waters (Stabeno et al. 2004; Hermann et al. 2009) and the cross-shelf and along-shelf transport of fish eggs and larvae (Bailey and Picquelle 2002; Doyle et al. 2009). Ocean temperatures are at an annual minimum in March and at a maximum in August in the GOA. A seasonal peak in phytoplankton production generally occurs during early May and is followed by acceleration in zooplankton production that extends from March to October, with copepod dominated biomass and abundance peaks occurring in May and July, respectively (Cooney 1986; Napp et al. 1996; Coyle and Pinchuk 2003). In recent decades, community shifts such as changes in species dominance have been documented among Published by NRC Research Press
Doyle and Mier
2115
Can. J. Fish. Aquat. Sci. Downloaded from www.nrcresearchpress.com by NORTHWEST FISHERIES SCIENCE CENTER on 12/11/12 For personal use only.
Table 1. List of species included in the study with common names and abbreviations. Family
Species
Common name
Abbreviation
Clupeidae Bathylagidae Osmeridae Myctophidae Gadidae
Clupea pallasi Leuroglossus schmidti Mallotus villosus Stenobrachius leucopsarus Gadus macrocephalus Theragra chalcogramma Sebastes spp. Anoplopoma fimbria Hexagrammos decagrammus Ophiodon elongatus Pleurogrammus monopterygius Hemilepidotus hemilepidotus Bathymaster spp. Ammodytes hexapterus Atheresthes stomias Glyptocephalus zachirus Hippoglossoides elassodon Hippoglossus stenolepis Isopsetta isolepis Lepidopsetta bilineata Lepidopsetta polyxystra Microstomus pacificus Platichthys stellatus Limanda aspera Pleuronectes quadrituberculatus
Pacific herring Northern smoothtongue Capelin Northern lampfish Pacific cod Walleye pollock Rockfish (unidentified) Sablefish Kelp greenling Lingcod Atka mackerel Red Irish lord Genus of ronquils Pacific sand lance Arrowtooth flounder Rex sole Flathead sole Pacific halibut Butter sole Southern rock sole Northern rock sole Dover sole Starry flounder Yellowfin sole Alaska plaice
Cpal Lsch Mvil Sleu Gmac Tchal Seba Afim Hdec Oelo Pmon Hhem Bath Ahex Asto Gzac Hela Hste Iiso Lbil Lpol Mpac Pste Lasp Pqua
Scorpaenidae Anoplopomatidae Hexagrammidae
Cottidae Bathymasteridae Ammodytidae Pleuronectidae
fish and invertebrate populations in the GOA in association with so-called climate-driven oceanographic “regime shifts” that are connected to the dynamics of the broader northeast Pacific Basin (Anderson and Piatt 1999; Hare and Mantua 2000; Litzow 2006). The underlying mechanisms for such changes in GOA biological communities are not well understood. Species information and data Species included in this study (Table 1) were chosen based on their common occurrence as larvae in the GOA plankton, availability of life history and ecological information, commercial or ecological importance in this ecosystem, diversity of adult and early life history patterns, and availability of time series of early life stage abundance (Matarese et al. 2003; Mundy and Hollowed 2005; Doyle et al. 2009). Among the 12 families represented, walleye pollock and Pacific cod (Gadidae), several species of rockfish (Scorpaenidae, genus Sebastes spp. — species not distinguishable as larvae), lingcod and Atka mackerel (Hexagrammidae), sablefish (Anoplopomatidae), and 12 species of flatfish (Pleuronectidae) are abundant groundfish of commercial importance. Forage species include the coastal pelagics Pacific herring (Clupeidae) and capelin (Osmeridae), the coastal, schooling and sometimes substrate-dwelling Pacific sand lance (Ammodytidae), and the oceanic mesopelagic species northern lampfish (Myctophidae) and northern smoothtongue (Bathylagidae). Among the forage species, only Pacific herring is exploited commercially. The remaining noncommercial species are demersal and include the coastal-dwelling kelp greenling (Hexagrammidae) and red Irish lord (Cottidae) and unidentified ronquils of the genus Bathymaster that occur from the intertidal zone to the outer shelf and slope. Although
these species occur as larvae in GOA subsurface plankton collections, sablefish, kelp greenling, Atka mackerel, and red Irish lord larvae are known to be primarily neustonic, being most abundant in the upper 10 –20 cm of the water column (Doyle et al. 1995; Matarese et al. 2003). The US National Oceanic and Atmospheric Administration’s (NOAA) Alaska Fisheries Science Center’s (AFSC) Ichthyoplankton Database (IchBASE) includes data from collections in the GOA from 1972 to the present and with annual sampling since 1981. Since 1985 these collections have been part of AFSC’s recruitment processes research under the Ecosystems and Fisheries Oceanography Coordinated Investigations Program (EcoFOCI). The primary sampling gear used for these collections was a 60 cm bongo sampler fitted with 333 or 505 m mesh nets (catch differences between mesh sizes not found to be significant; Boeing and Duffy-Anderson 2008), and oblique tows were carried out mostly from 100 m depth to the surface or from 10 m off bottom in shallower water. Occasionally, for special studies oblique tows were extended below 100 m when the focus was fish species that spawn in very deep water over the continental slope (Blood et al. 2007). For a few surveys, oblique tows were also carried out with a 1 m2 Tucker trawl (333 or 505 m mesh nets), which is comparable to the 60 cm bongo sampler in terms of catches (Shima and Bailey 1994). Neuston samples were collected using a Sameoto sampler (Sameoto and Jaroszynski 1969; Jump et al. 2008) with a frame mouth opening of 30 cm high ⫻ 50 cm wide and 505 m mesh net. These neuston collections contribute to an understanding of early life history patterns for species whose larvae are associated with the Published by NRC Research Press
Can. J. Fish. Aquat. Sci. Downloaded from www.nrcresearchpress.com by NORTHWEST FISHERIES SCIENCE CENTER on 12/11/12 For personal use only.
2116
surface layer of the ocean (Doyle et al. 1995). Volumes of water filtered by each of these gear types were measured by flowmeters suspended in the mouths of the nets. Details of sampling protocols, preservation of samples, and calculations of standardized catches for each of these gears are given in Matarese et al. (2003). Distribution of sampling effort in the GOA from 1972 to the present extends from the coastal area to the east of Prince William Sound southwestwards along the Alaska Peninsula to Umnak Island, part of the Aleutian chain, covering coastal, shelf, and adjacent deep water (Fig. 3). Sampling has been most intense in the vicinity of Kodiak Island for bongo collections (Fig. 3a), and to a lesser extent for neuston collections (Fig. 3b). For the former, the greatest concentration of historical samples has been in Shelikof Strait and to the immediate southwest over Shelikof Sea Valley and out to adjacent slope waters (Fig. 3a). Although sampling has been carried out during all seasons, most collections are from the spring months, from April through June (Fig. 4). Life history and ecological traits used in this study were chosen to represent broad ecological connections and environmental exposure throughout the early life of the selected species in the study area (Table 2). Early life history information was compiled primarily from AFSC’s IchBASE and Ichthyoplankton Information System (IIS: http://access.afsc. noaa.gov/ichthyo/index.cfm), as well as from published material from the EcoFOCI Program. Adult life history information was accumulated from various published and unpublished sources at NOAA’s AFSC, including the online life history database (http://access.afsc.noaa.gov/reem/lhweb/index.cfm). These numerically expressed life history and ecological traits represent adaptation to long-term prevailing conditions in the GOA, diversity of life history strategies, and diversity of spatial and temporal patterns of exposure to the pelagic environment during early ontogeny. Beginning with reproductive patterns of these species, adult traits utilized include age at first maturity, fecundity, a Julian day representation of the peak period and duration of spawning, and a spawning thermal exposure index. The latter index represents the mean local water temperature (from Stabeno et al. 2004) in the vicinity of the spawning habitat (e.g., close to bottom temperatures for demersal spawner) during the period of peak spawning in the GOA. Nine traits are included that represent life history and ecological characteristics during early ontogeny. Egg size, larval size at hatching and at transformation, and peak period of larval abundance (expressed in Julian day) are classic species life history characteristics based on synthesis of observations at the individual level, whereas the remaining traits are based on calculations of quantifiable ecological characteristics using population-level data from IchBASE. The latter numerically expressed ecological traits were calculated from data collected with the 60 cm bongo nets, as spatial and temporal coverage and total number of samples is more extensive than for the neuston collections (Figs. 3 and 4). It needs to be emphasized here that intraspecies plasticity in traits (e.g., timing and duration of spawning; egg size and larval size at hatching), which can vary with maternal and environmental conditions, is not a focus of this study. Rather the interest is in broad comparisons among species based on averages of the reported species-specific life history traits. The population-level estimates include an egg exposure index and a larval duration index, the former being the time in
Can. J. Fish. Aquat. Sci. Vol. 69, 2012
weeks between the peak spawning time and peak larval abundance (both represented by Julian day) and the latter being the total number of weeks when larvae are common in GOA plankton samples (Table 2). Annual patterns of occurrence and abundance of these species have been well established based on synthesis of three decades of GOA ichthyoplankton collections (Matarese et al. 2003; Doyle et al. 2009), whereas egg incubation times and pelagic larval duration (determined from analysis of fish otoliths) at the individual level are not available for most species. Indices of spatial ubiquity of larvae and larval thermal exposure (mean local water temperature, representing larval habitat during peak abundance; see Table 2) and a weighted mean bottom depth of larval occurrence were also calculated. The index of larval spatial ubiquity was estimated as the percentage of samples in which the species was present, from collections during all years, but restricted to the seasonal period of common occurrence of the particular species. This assessment of ubiquity is representative of the extent of distribution of the propagules in the pelagic environment from initial egg deposition or emergence of larvae into the plankton through dispersal during the larval phase. Owing to variability among years in the overlap of sampling with periods of peak abundance and full extent of larval duration among species, the spatial ubiquity index is not an absolute measurement of the full extent of larval distribution. Rather it is considered to be a reliable representation of the relative ubiquity of larvae among species in the study area for comparative purposes. The weighted mean bottom depth of occurrence of larvae (LDepth) was calculated for each species based on water depth and abundance at all sampling stations at which it occurred: LDepth ⫽
兺
n
i⫽1
(Ci ⫻ Di)
/兺
n
i⫽1
Ci
where Ci is the catch per unit effort (no./10 m2) for the ith station; Di is the bottom depth (m) for the ith station; and n is the total number of samples in which larval species occurred. This estimate is considered an index of larval habitat by water depth and is also suitable for comparative purposes. A subset of the three decades of GOA ichthyoplankton data was developed into a time series of larval species abundance, based on annual 60 cm bongo collections in the vicinity of Kodiak Island during mid-May through early June 1981–2009 (Table 3; Fig. 3a). The 60 cm bongo net was the sampling gear used during all cruises except for 4MF88 and 4MF89, when the 1 m2 Tucker trawl was utilized. Neuston data are not included in this abundance time series, as spatial and temporal coverage of the neuston sampling was inconsistent over the years. The method of calculation of the mean abundance values from the bongo samples is given in Doyle et al. (2009). Patterns of interannual variation in abundance for the species of interest are examined for similarities and synchronicity. Data analysis Numerical expressions of life history and ecological traits were organized into a species ⫻ traits data matrix. To explore relationships among life history and ecological traits, data were log-transformed, and Pearson’s product–moment pairwise correlations were performed on each pair of traits across species. The traits were then organized into attribute groups according to the correlative relationships. Published by NRC Research Press
Can. J. Fish. Aquat. Sci. Downloaded from www.nrcresearchpress.com by NORTHWEST FISHERIES SCIENCE CENTER on 12/11/12 For personal use only.
Doyle and Mier
2117
Fig. 3. Distribution of ichthyoplankton sampling in the Gulf of Alaska by NOAA’s Alaska Fisheries Science Center from 1972 through 2009 using (a) a 60 cm frame bongo net and (b) a 30 cm ⫻ 50 cm frame neuston net. Sampling effort is illustrated by the total number of stations sampled in 20 km2 grid cells over these years. A late-spring time series of mean abundance of larval fish species has been developed for the years 1981–2009 from bongo collections in the polygonal area outlined in white in panel (a). See Table 3 for sampling details associated with this time series.
(a)
Prince William Sound
Alaska
60°N
Cook Inlet Shelikof Strait
Southeast Bering Sea
Umnak Island
55°N
Kodiak Island Shelikof Sea Valley
Bathymetry met res 200
Gulf of Alaska 160°W
1000
150°W
(b) 60°N
55°N
No. Stations per cell 1 2-5 6 - 10
0
160°W
125
250
500 km
11 - 20 21 - 30
150°W Published by NRC Research Press
2118
Can. J. Fish. Aquat. Sci. Vol. 69, 2012
3000
(a) (a)
1000 500 0 400
hypothesis that species with similar early life history patterns (delineated by the PCA ordination) will display similar patterns of interannual variation in early life history abundance and perhaps subsequent survival to recruitment.
Results
1500
No. of samples
(b) (b)
300 200 100 0 Ja n Fe . b. M ar . Ap r. M a Ju y ne Ju ly Au g. Se pt . O ct . N ov D . ec .
Can. J. Fish. Aquat. Sci. Downloaded from www.nrcresearchpress.com by NORTHWEST FISHERIES SCIENCE CENTER on 12/11/12 For personal use only.
Fig. 4. Seasonal variation in ichthyoplankton sampling effort in the Gulf of Alaska by half-month for (a) 60 cm bongo collections, 1972 and 1977–2009, and (b) neuston collections, 1977–1979, 1981–1986, and 2001–2005.
Half-month
Ordination of the log-transformed species ⫻ traits correlation matrix was performed by principal component analysis (PCA) (Tabachnick and Fidell 1996) using PCORD5 software (McCune and Mefford 1999) for the purpose of investigating relationships among species across life history and ecological traits. As in Winemiller and Rose (1992) and King and McFarlane (2003), the ordination of species in this way results in the identification of major gradients in life history and ecological variation among species, and accordingly shows the delineation of species groups or categories based on these gradients. PCA ordination plots were constructed for two sets of PC axes (three axes total), and associated PC statistics were compiled to show variable (i.e., trait) loadings (eigenvectors scaled to standard deviation) on these axes. Nonmetric multidimensional scaling (NMDS) (Tabachnick and Fidell 1996) was also applied using PCORD5 to examine among species synchronicity in the 1981–2009 time series of larval abundance (Table 3). Not all species included in the PCA analysis of life history and ecological variations (Table 1) were appropriate for inclusion in the NMDS analysis. The following were excluded: Pacific herring larvae were present in only 7 out of the 27 years of data collections; capelin were present as overwintered larvae (unusually extended pelagic exposure relative to the other species; Doyle et al. 2002b), Atka mackerel and yellowfin sole larvae were absent from the time series (mismatch with sampling period); and butter sole larvae were present in anomalously high numbers in one year only, and rare or absent in other years. NMDS was performed using Bray–Curtis dissimilarity measures on abundance standardized by species totals as in Doyle et al. (2009). The examination of synchronicity in these metrics addresses the
Relationships among life history and ecological traits The Pearson’s product–moment correlation matrix showing among-species relationships in life history and ecological traits was reorganized into life history and ecological attribute categories within which traits were most likely to be positively and significantly correlated with each other (Table 4). Conversely, all the significant negative relationships among traits were between traits that were in different attribute categories. Five attribute categories were identified. Age at first maturity and fecundity were positively correlated with each other and constitute the attribute category “production,” representing the adult reproductive output of eggs. “Temporal and spatial ubiquity” was the category comprised of traits relating to the spread of eggs and larvae in time and space, including spawning duration, egg exposure, larval duration, and spatial ubiquity of larvae. Larval size at transformation was also included in this category, as it was significantly and positively correlated with the indices for egg and larval duration. Egg size and larval size at hatching are traits that determine mobility and behavioral abilities of newly emerged larvae. They were strongly correlated with each other and are identified here as the “early larval competence” category. The “phenology” category combines traits that represent the timing of occurrence and peak abundance of larvae in the plankton (peak spawning and peak larval abundance) and thermal exposure indices associated with each of these peaks. Finally, the weighted mean bottom depth of larval occurrence (LDepth) is in a category of its own, as it is the only trait that represents early life history habitat, as indicated by water depth. The correlative relationships among attribute categories are indicative of GOA fish species trade-offs in adaptive value among early life history and ecological traits (Table 4). High levels of production of eggs and larvae as indicated primarily by fecundity seems to be associated with limited larval duration and larval size at transformation, as well as “early” spawning (i.e., early winter months). Early spawning and timing of larval peak abundance is also associated with deep, cold water as indicated by significant negative correlations between the phenology traits and larval habitat by water depth. In addition, the positive correlation between larval duration and larval habitat by depth indicates that an extended larval phase is favored by species spawned in deep water. A significant negative relationship between egg size and peak spawning period and positive correlation between egg size and larval habitat by water depth reflects the necessity for a high level of early larval competence among species spawned in cold, deep water. PCA ordination of species in life history and ecological space Trade-offs in adaptive values among individual life history and ecological traits (Table 4) were further illuminated in the PCA ordination (Fig. 5). The PCA resulted in a wide distribution of species along three primary early life history and ecological gradients. These primary gradients are identified based on orientation of the eigenvectors (life history and Published by NRC Research Press
Doyle and Mier
2119
Can. J. Fish. Aquat. Sci. Downloaded from www.nrcresearchpress.com by NORTHWEST FISHERIES SCIENCE CENTER on 12/11/12 For personal use only.
Table 2. Numerical life history and ecological traits used for species in the study, description, and abbreviation key. Life history and ecological traits
Abbreviation
Description
Unit
Adult traits Age at first maturity Fecundity
Age1M Fecun
Earliest age at which the species is known to reproduce Mean or midpoint of the reported range of number of eggs produced per female Midpoint of the reported peak spawning period Maximum duration of spawning Mean local water temperature during peak period of spawning, based on spawning habitat
Years No. of eggs (103)
Midpoint of the reported egg size range Time between peak spawning time (Julian day) and peak larval abundance (Julian day) Midpoint of the reported size range of larvae at hatching Total length of time when larvae are common in the plankton Midpoint of the reported peak period of larval abundance Occurrence of larvae in all samples collected during period when common in the plankton Midpoint of reported size range at which larvae metamorphose into juveniles Mean GOA water temperature in Shelikof Strait during period of peak abundance of larvae Weighted mean bottom depth of occurrence of larvae
mm Weeks
Peak spawning Spawning duration Spawning thermal exposure index
PeakS SDur STemp
Early life history and ecological Egg size Egg duration (incubation) index* Larval size at hatching Larval duration index* Peak larval abundance Spatial ubiquity of larvae
traits EggSz EDur
Larval size at transformation
LszT
Larval thermal exposure index Mean bottom depth larval occurrence
LTemp
LszH LDur PeakL LUbiq
LDepth
Julian day Weeks °C
mm Weeks Julian day % mm °C m
Note: Sources of information: Published life history information taken from Alaska Fisheries Science Center’s Life History Databases: http://access.afsc. noaa.gov/reem/lhweb/index.cfm, http://access.afsc.noaa.gov/ichthyo/index.cfm. Annual peak in larval abundance and spatial ubiquity among species calculated from GOA ichthyoplankton collections 1972–2009 (IchBASE data). Thermal exposure indices identified using annual temperature patterns at various depths given in Stabeno et al. (2004); species-specific temperatures at depth chosen based on preferred spawning time and habitat of species and depth of occurrence of larvae in water column during period of peak abundance (Brodeur and Rugen 1994; IchBASE depth discrete data). Traits are based on available data for populations in the Gulf of Alaska and represent long-term, evolutionary-scale adaptiveness among species. *Traits based on population-level rather than individual-level measurements of egg incubation time or larval duration from hatching to transformation.
ecological variables) relative to the first three principal components (PCs) and the variable loadings on these three axes (Figs. 5a and 5b; Table 5). PC1 accounts for 24% of the variance in the data, and the alignment of phenology traits, egg size, and larval habitat by depth along this axis distinguishes GOA species primarily by timing of production and early life habitat. Early winter spawners such as arrowtooth flounder and Pacific halibut spawn in deep, cold water, whereas at the other end of this gradient species such as capelin, butter sole, yellowfin sole, and starry flounder are characterized by spawning and early ontogeny in shallow, warmer water from spring through summer. In addition, egg size and larval size at hatching tends to be larger among the early than among the late spawners. A further 21% of the variance is accounted for by PC2, along which production traits (age at first maturity and fecundity) run from low to high with an opposite alignment of larval duration and larval size at transformation. Walleye pollock, Pacific cod, and northern rock sole are representative of the high production, limited larval duration end of this axis, whereas Atka mackerel and ronquils (Bathymaster spp.) are positioned at the negative end of the axis and characterized by extended egg and larval duration. The third PC (14% of the variance) describes a strong gradation in temporal and spatial ubiquity of larvae and early larval competence. Species such as northern lampfish and Pacific sand lance that are character-
ized by high spatial and temporal ubiquity of their larvae have very small egg sizes, and their larvae are small and weak at hatching. At the other end of this axis, species such as Pacific herring, lingcod, Alaska plaice, and Dover sole have relatively large eggs, larger and more competent larvae at hatching, and their distribution in the pelagic environment is more limited during early ontogeny. Along with these “end-point” species, remaining species were also assigned to subdivisions of the primary life history and ecological gradients, depending on their positions in the PCA plots (Figs. 5a and 5b) and individual values for their life history and ecological traits (Table 6). The general patterns along the gradients (axes) still apply in terms of combinations of high and low values of the defining life history and ecological traits. However, there are also some combinations of traits among certain species that represent outlier types within their groups, or intermediate positions within the ordination space. Rockfish (Sebastes spp.) are late spawners (spring to summer), but they release their larvae in deep water along the continental slope unlike the other members of the latephenology group that spawn eggs in coastal or inner shelf waters. Capelin overwinter as larvae (Doyle et al. 2002b) and are very large at transformation with an extremely extended larval duration relative to the other late spawners that have settled out of the plankton prior to the onset of winter. In the Published by NRC Research Press
2120
Can. J. Fish. Aquat. Sci. Vol. 69, 2012
Can. J. Fish. Aquat. Sci. Downloaded from www.nrcresearchpress.com by NORTHWEST FISHERIES SCIENCE CENTER on 12/11/12 For personal use only.
Table 3. Survey schedule and number of stations sampled within the chosen study area (Fig. 3a) from which the late-spring time series of larval species mean abundance indices were calculated. Year
Cruise
Date
1981 1981 1982 1983 1985 1987 1988 1989 1990 1991 1992 1993 1994 1995 1996 1997 1998 1999 1999 2000 2001 2002 2003 2004 2005 2006 2007 2008 2009
3SH81 4MF81 2DA82 1CH83 2PO85 3MF87 4MF88 4MF89 4MF90 4MF91 4MF92 5MF93 6MF94 8MF95 8MF96 8MF97 5MF98 2WE99 5MF99 6MF00 3MF01 4MF02 5MF03 5MF04 6MF05 4MF06 5MF07 4DY08 4DY09
23–28 May 21–24 May 23–28 May 21–28 May 23 May–1 June 19–23 May 21 May–6 June 29 May–5 June 30 May–5 June 19 –24 May 18 –26 May 27 May–1 June 24 May–1 June 22–28 May 25–31 May 24–30 May 22–28 May 25 May–1 June 26–31 May 28 May–2 June 27–31 May 27–30 May 28 May–1 June 23 May–3 June 22 May–3 June 22 May–1 June 20–28 May 24–30 May 28 May–6 June
No. of stations 34 59 32 52 55 40 149 95 102 70 105 74 98 77 96 94 95 67 25 81 78 59 72 84 85 81 79 82 83
Total 27
Total 29
Range 18 May–6 June
Total 2203
high production category, sablefish is unusual in having the largest egg size and primarily neustonic larvae (Doyle et al. 1995; Matarese et al. 2003), and its distribution extends over much deeper water than the other members of this group. Although the spatial ubiquity of their larvae is very high, kelp greenling and flathead sole display a much higher level of early larval competence (egg size and larval size at hatching) than the other highly ubiquitous species. Also in this group, Pacific sand lance has an extraordinarily long egg exposure index, as its eggs are incubated in coastal sediments for many weeks over the winter prior to hatching (Robards et al. 1999; Matarese et al. 2003). For comparative purposes, the Winemiller and Rose (1992) life history strategy categories periodic, opportunistic, and equilibrium (Fig. 1) are labeled among the species and gradient categories that emerged from the PCA analysis in this study (Table 6). These strategy types are well distributed among the six early life history subdivisions, indicating the existence of subgroups that diverge from the original three life history strategy end points of Winemiller and Rose (1992).
Conceptual framework of species early life history exposure to the pelagic environment The PCA results and associated primary life history and ecological gradients and categories were synthesized into a new conceptual model of GOA fish species early life history exposure (Fig. 6). This new trilateral framework identifies three strategies that represent primary end points of the gradients identified by the PCA analysis: synchronous, abundant, and ubiquitous. Ecological characteristics of these primary end points and their opposites along the three gradients are summarized here with respect to associated factors of resilience and vulnerability to environmental conditions in the GOA. The synchronous strategy represents a pattern of spring to summer production of larvae (late phenology) that is associated with favorable temperature conditions and prey resources in the GOA for growth and development. Disadvantages include high exposure to egg and larval predators in association with spring–summer peaks in zooplankton abundance and a shorter optimal window for larvae to transition out of the plankton prior to winter. At the opposite end of the phenology gradient, larvae of the early spawners encounter poor food resources (but diminished predators) in deep water during winter. However, slow growth in response to the cold temperatures is advantageous to extending their planktonic life until prey conditions are enhanced. The abundant strategy at the high end of the production gradient is characterized by sufficient production of eggs and larvae to withstand high levels of early mortality. Limited larval duration, however, confers significant vulnerability from potential mismatch with peaks in food resources or exposure of the bulk of the larval population to other unfavorable conditions such as suboptimal temperatures. At the opposite end of the production gradient, the extended larval duration that is associated with low fecundity confers resilience in terms of extending the exposure of the larval population beyond this mismatched time frame. The Ubiquitous strategy is characterized by extensive larval dispersal and spatial and temporal utilization of pelagic resources, but vulnerability due to poor early larval competence and associated risk of starvation or lethal drift. Conversely, species at the low ubiquity end of the gradient have the advantage of a high degree of early larval competence that compensates for their limited dispersal. Among-species synchrony in abundance trends Results of the two-dimensional NMDS of the GOA larval fish time series indicates similarities among species in interannual variation in abundance during late spring 1981–2009 (Fig. 7). Species positions along the two NMDS axes reflect positions of species in the PCA plots representing patterns of early life history and ecology (Fig. 6) and also preserve the gradients and end points that constitute the constructed framework of early life history exposure (Fig. 6). Species belonging to the synchronous (late phenology) category plotted towards the negative portions of the two axes, whereas the early phenology species were proximate to the positive ends. Separation of species along the production gradient is reflected in the position of the abundant species at the positive end and the low production species at the negative end of axis 2. The ubiquitous species plotted close to the origin of both axes, whereas low ubiquity species were separated from them and positioned at the positive end of axis 2. Published by NRC Research Press
Doyle and Mier
2121
Trait
Production
Temporal and spatial ubiquity
Age1M
SDur
Fecun 0.022
EDur
0.577 0.270
LUbiq
LDur
Age1M Fecun
0.46*
SDur EDur LUbiq LDur LszT
0.12 –0.33 –0.26 –0.23 –0.50*
–0.23 –0.07 –0.34 –0.08 0.03 –0.44* 0.36 –0.42* 0.08
EggSz LszH
–0.02 –0.20
0.11 –0.09
0.13 0.08
0.11 0.15
–0.27 –0.15
–0.01 0.14
PeakS STemp PeakL LTemp
–0.17 –0.21 0.01 0.26
–0.40* –0.16 –0.53* –0.12 –0.14 0.01 0.15 –0.04
0.14 0.14 0.02 –0.16
–0.02 –0.17 –0.31 –0.37
–0.07 0.21 –0.25 –0.26
LDepth
0.30
–0.07
–0.19
0.11
0.27
LszT
Early larval competence
Phenology
EggSz
PeakS
STemp
PeakL
LTemp
LszH
EL Habitat by depth LDepth
0.104 0.742
0.203 0.700
0.278 0.026
0.010 0.037
0.927 0.606
0.344 0.680
0.408 0.045
0.323 0.006
0.976 0.498
0.214 0.464
0.140 0.754
0.097
0.895 0.873
0.077 0.584 0.006
0.703 0.022 0.381 0.032
0.527 0.615 0.186 0.962 0.600
0.723 0.464 0.471 0.502 0.040
0.437 0.501 0.917 0.723 0.995
0.556 0.511 0.407 0.317 0.382
0.973 0.936 0.137 0.234 0.987
0.846 0.438 0.067 0.218 0.280
0.197 0.358 0.606 0.047 0.788
0.000
0.034 0.464
0.635 0.331
0.296 0.471
0.206 0.628
0.052 0.322
0.000
0.003 0.090
0.037 0.104 0.019
0.024 0.607 0.005 0.004
0.03 –0.12 0.46*
0.54* 0.18
0.43* 0.11 0.41*
0.40*
0.76*
0.00 0.18 0.00 –0.23
–0.43* –0.10 –0.22 –0.26
–0.15 0.20 –0.15 –0.10
0.06
0.39
0.21
0.69* 0.58* 0.42*
0.35 0.33
0.47*
–0.45* –0.11
–0.55*
–0.55*
Note: Abbreviation codes for individual traits are given in Table 2. Correlation values are presented below the diagonal and probabilities are above the diagonal. EL refers to early life. *Significant correlation at P ⬍ 0.05.
Fig. 5. PCA ordination of GOA fish species in life history and ecological space showing (a) the first and second principle component axes and (b) the first and third principle component axes, as well as associated life history and ecological vectors. Species abbreviations are given in Table 1. Primary life history and ecological gradients are identified based on orientation and loadings (Table 5) of the vectors relative to the axes. EL refers to early life. 4
Sleu
Pste
EggSz Lsch
Gzac LDur
Hdec
STemp -2
LszT
M vvil
P mo n
LUbiq Seba B ath Lpo l Tchal Lbil Gmac
Lsch
LDur
M vil
0
Iiso PeakS Lasp PeakL LTemp
A hex
Hhem
Hdec
A sto
LDepth
Hela Gzac
A fim
P qua Cpal M pac
Hste
P mo n
-2
LszH EggSz Oelo
Low
-4 A hex -4
Late Shallow, warm
-2
0
PC 1 Phenology EL Habitat
2
4
High
Low
Sleu
High Low
LDepth
Hela Hhem B ath
(b)
2
PC 3
PC 2
Production
Larval Duration
PeakS
Hste
A fim Lpo l Gmac M pac Oelo Tchal
Seba
LTemp PeakL Cpal
0
A sto
P qua
Ubiquity
P ste
Lasp
2
Fecun Age1M
EL Competence
High Short
(a) Iiso Lbil
Long
Can. J. Fish. Aquat. Sci. Downloaded from www.nrcresearchpress.com by NORTHWEST FISHERIES SCIENCE CENTER on 12/11/12 For personal use only.
Table 4. Correlation matrix of log-transformed life history and ecological traits (Pearson’s product–moment) among GOA species (Table 1) arranged by life history and ecological attribute categories.
-4 -4
-2
0
2
4
PC 1 Early Deep, cold
Two species that appeared to be outliers relative to their previously assigned categories (Table 6) were lingcod (low ubiquity) and sablefish (abundant), which plotted close to each other and the low production species in the lower right quadrant of the
Late Shallow, warm
Phenology EL Habitat
Early Deep, cold
NMDS plot (Fig. 7). A common early life history characteristic of these two species, in addition to that of the cottid species red Irish lord (low production type), is that their larvae are primarily neustonic, being most abundant in the surface layer of the ocean. Published by NRC Research Press
2122
Can. J. Fish. Aquat. Sci. Vol. 69, 2012
Can. J. Fish. Aquat. Sci. Downloaded from www.nrcresearchpress.com by NORTHWEST FISHERIES SCIENCE CENTER on 12/11/12 For personal use only.
Table 5. PCA statistics for the GOA fish species life history and ecological matrix (25 species or taxa; 14 life history and ecological traits). Eigenvalue: Cummulative % variance:
PC1 3.36 23.97
PC2 2.95 45.02
PC3 1.97 59.08
Life history – ecological attributes Phenology
Individual PeakS STemp PeakL LTemp
–0.76 –0.45 –0.74 –0.73
–0.44 –0.61 – ⫹
⫹ – – –
Habitat by depth
LDepth
0.76
⫹
⫹
Production
Age1M Fecun
– ⫹
0.71 0.78
⫹ –
Temporal and spatial ubiquity
SDur EDur LUbiq LDur LszT
⫹ ⫹ ⫹ 0.46 ⫹
– –0.41 – –0.55 –0.74
⫹ – 0.65 0.45 –
Early life competence
EggSz LszH
0.55 0.40
⫹ –
–0.73 –0.71
PHENOLOGY Early production Spawning and early ontogeny in deep, cold water during winter; large egg size
PRODUCTION High production High age at first maturity, fecundity, production of larvae; limited egg and larval duration Pacific cod, walleye pollock, sablefish, northern rock sole
UBIQUITY High ubiquity Extended temporal and spatial “spread” of eggs and larvae; low early life competence Northern lampfish, kelp greenling, Pacific sand lance, flathead sole
Low production Low age at first maturity, fecundity, production of larvae; extended egg and larval duration Atka mackerel, red Irish lord, ronquils (Bathymaster spp.)
Low ubiquity Limited temporal and spatial “spread” of eggs and larvae; high early life competence Pacific herring, lingcod, rex sole, Dover sole, Alaska plaice
Primary life history and ecological gradients with associated end points and representative species
Northern smoothtongue, arrowtooth flounder, Pacific halibut
Late production Spawning and early ontogeny in shallow, warmer water, spring–summer; small egg size Capelin, rockfish (deep water), butter sole, southern rock sole, starry flounder, yellowfin sole
Note: Interpretation of abbreviations for individual life history and ecological traits are given in Table 2. Variable loadings (eigenvectors scaled to standard deviation) on the first three principal components axes are given for values ⱖ0.4 or ⱕ – 0.4; otherwise they are listed as ⫹ or –, respectively. Primary gradients are identified based on orientation of vectors (Fig. 5) and vector loadings.
Varying patterns of interannual variation and degrees of synchrony are apparent in the normalized time series of larval abundance plotted for the most abundant species grouped by end-point strategies (Fig. 8). The synchronous species are characterized by low to average levels of abundance for the first half of the time series and more dramatic fluctuations with the highest positive anomalies in abundance from 1998 onwards, but not always coinciding (Fig. 8a). The highest degree of synchrony
is apparent in the trends for the abundant species, with coincident high and low anomalies for these species (Fig. 8b). The least amount of synchrony is illustrated in the trends for the ubiquitous species (Fig. 8c), whereas the deep water, early phenology species share a common trend of mostly low to average abundance in the 1980s, occurrence of highest anomalies during the 1990s, and fluctuating levels with a limited amount of synchrony during the 2000s. Published by NRC Research Press
Primary life history and ecological gradients Phenology Late Capelin Rockfish Butter sole Southern rock sole Starry flounder Yellowfin sole Early Northern smoothtongue Arrowtooth flounder Pacific halibut Production High Pacific cod Walleye pollock Sablefish Northern rock sole Low Atka mackerel Red Irish lord Ronquils (Bathymaster) Ubiquity High Northern lampfish Kelp greenling Pacific sand lance Flathead sole Low Pacific herring Lingcod Rex sole Dover sole Alaska plaice
Spatial and temporal ubiquity
Early larval competence
Phenology
W–R group*
Age1M
Fecun
SDur
EDur
LUbiq
LDur
LszT
EggSz
LszH
PeakS
O P P P P P
2.5 7.0 3.0 3.0 5.0 6.0
16.5 300.0 525.0 950.0 85.0 2000.0
21 30 21 24 17 20
6 0 4 2 5 10
8.0 23.0 4.7 12.0 9.4 3.0
38 24 8 22 8 8
60.0 17.5 18.0 13.4 9.0 16.0
1.1 1.0 1.0 1.0 1.0 0.8
4.5 5.6 2.8 3.5 2.0 2.5
181 196 135 151 120 181
O P P
2.0 6.0 4.0
6.5 1246.0 2500.0
43 17 17
2 4 4
8.5 18.0 9.5
30 26 24
33.0 29.0 19.4
1.8 1.8 3.4
4.5 4.4 8.2
P P P P
2.5 3.0 5.5 3.0
3000.0 550.0 1000.0 525.0
13 13 25 24
6 6 10 4
34.0 70.0 8.0 29.0
14 18 12 18
30.0 25.0 37.0 17.3
1.0 1.4 2.0 1.0
E E ?
2.5 4.0 3.0
11.5 93.0 15.0
17 17 25
10 10 4
4.0 19.0 31.0
30 22 28
35.0 21.0 40.0
O E O P
4.0 3.0 1.0 2.0
12.6 50.0 9.0 335.0
25 38 12 25
2 6 25 4
30.0 58.0 72.0 42.0
38 40 22 17
O E P P P
2.5 3.0 3.0 5.0 4.0
51.0 300.0 121.0 85.0 344.0
12 24 25 24 16
2 12 6 5 2
2.5 2.0 6.0 5.3 3.0
8 9 19 10 10
Habitat by depth
STemp
PeakL
LTemp
LDepth
7.0 7.0 5.0 5.5 4.5 5.5
227 196 166 166 159 259
10.0 8.0 7.0 8.0 6.0 9.0
102 388 178 136 170 90
45 15 15
4.5 4.0 4.0
59 46 46
4.5 5.0 6.0
678 839 694
3.5 3.5 5.5 3.8
74 74 74 90
3.0 3.0 3.0 3.0
120 120 151 120
5.0 5.0 6.0 6.0
140 230 646 149
2.6 1.5 1.0
8.0 5.5 4.0
243 334 120
10.0 6.5 4.5
319 46 151
5.0 6.0 7.0
346 366 152
16.0 50.0 65.0 19.5
0.8 1.9 0.8 3.2
2.0 8.0 5.5 6.1
120 59 288 120
4.5 4.0 9.5 4.5
136 105 114 151
5.0 5.0 6.0 6.0
642 274 183 194
31.0 30.0 61.0 20.0 11.0
1.5 2.7 2.0 2.4 1.9
6.6 8.5 5.0 6.0 5.8
136 46 135 145 120
5.0 4.0 5.0 5.5 5.0
151 135 181 181 136
6.0 6.0 6.0 7.0 9.0
162 148 290 313 167
*W–R life history group assignment is based on the Winemiller and Rose (1992) categories: O, opportunistic strategy; P, periodic strategy; E, equilibrium strategy.
2123
Published by NRC Research Press
Can. J. Fish. Aquat. Sci. Downloaded from www.nrcresearchpress.com by NORTHWEST FISHERIES SCIENCE CENTER on 12/11/12 For personal use only.
Production
Doyle and Mier
Table 6. Assignment of species among categories and subdivisions according to primary early life history and ecological gradients and associated values for individual life history and ecological traits (description and units in Table 2).
Can. J. Fish. Aquat. Sci. Vol. 69, 2012
Fig. 6. Conceptual framework of early life history exposure for Gulf of Alaska fish species based on synthesis of the PCA ordination of species by life history and ecological traits. Primary end-point strategies are identified as synchronous, abundant, and ubiquitous with reference to the three primary gradients of phenology, production, and ubiquity.
SYNCHRONOUS
Fig. 7. Nonmetric multidimensional scaling ordination of species based on the time series (1981–2009) of late spring larval abundance from the 60 cm bongo samples. End-point strategies that emerged in the PCA ordination of species are identified with labeled ellipses (black, dark gray, and light gray) enclosing the representative species, solid lines for the primary end points, and dotted lines for the opposite ends of the respective gradients.
Late
Low
Ub High
UBIQUITOUS
Phenology
Can. J. Fish. Aquat. Sci. Downloaded from www.nrcresearchpress.com by NORTHWEST FISHERIES SCIENCE CENTER on 12/11/12 For personal use only.
2124
Low
Pro duc tion
ity iqu Early
High
ABUNDANT
Discussion Adequate understanding of the linkages between fish population fluctuations and environmental variability in marine ecosystems largely continues to elude us. Bakun (2010) recommends the utilization of conceptual templates and schematic constructs for elucidating multiple controlling processes that will lead to identification of the basic dynamics. Furthermore, many contemporary studies that investigate such linkages also identify the importance of examining population trends and processes across species and ecosystems as a valuable comparative approach to discerning the influence of environmental forcing on recruitment variation (Mueter et al. 2007, 2009; Megrey et al. 2009; Alheit and Bakun 2010). A multispecies approach is particularly powerful when dealing with ichthyoplankton studies that integrate information on pelagic early life history stages across a diverse range of fish species with varied phylogeny, adult life history traits, habitats, and ecologies (Doyle et al. 2002a, 2009). Essentially, commonality in early life history patterns is indicative of shared exposure to environmental variation during early ontogeny. Results from the present study demonstrate the value of multispecies synthesis of empirical early life history information. This approach yielded fundamental patterns and coherent gradients in the early life exposure and response connections among a diverse variety of GOA fish species. Rigorous attention to multispecies early life history aspects of complex recruitment processes can indeed advance our understanding of fish– environment mechanistic linkages beyond what may be discerned through relating recruitment metrics to environmental indices. Furthermore, incorporating the biological and ecological details of early ontogeny into multispecies life history frameworks seems to offer a more comprehensive and nuanced insight into ecological processes and environmental influence than is available via adult life history characteristics alone. This is not surprising given the profound differences that exist between morphology, physiology, and ecology of early life stages and adult fish (Fuiman
2002; Miller and Kendall 2009). Ecological interactions are very different during embryonic and larval stages than later during juvenile and adult life. Separate consideration of early life history is therefore appropriate when dealing with life history traits as fundamental determinants of population regulation. The clear subdivisions of the Winemiller and Rose (1992) life history strategy and recruitment pattern types that emerged in this study reflect a greater degree of variability in strategies among GOA fish species than are described broadly by the periodic, opportunistic, and equilibrium categories. The three primary gradients (phenology, production, and ubiquity) that emerged from the ordination of species by early life history and ecological traits highlight the variability in environmental exposure profiles that exists among fish species in the GOA ecosystem. For instance, the strong phenological gradient that emerged seems somewhat surprising given that the GOA is a temperate to subarctic ecosystem with distinct and predictable spring to summer peaks in plankton production (Mundy 2005). Although species such as the so-called synchronous end-point types (e.g., capelin, southern rock sole, and yellowfin sole) place their larvae in the pelagic environment during spring–summer to coincide with peak production of larval food prey such as copepod nauplii, many others including the “abundant” types (e.g., Pacific cod, walleye pollock, and sablefish) are at peak larval abundance prior to the spring peak in copepod nauplii. A more extreme apparent mismatch with food resources is displayed by the early phenology species (e.g., arrowtooth flounder and Pacific halibut) whose larvae hatch out into cold, deep water over the continental slope during January and February (Blood et al. 2007). Given that both these species are abundant as adults in the GOA, other early life history traits such as slow development of larvae in association with cold winter temperatures and Published by NRC Research Press
Doyle and Mier
2125
Can. J. Fish. Aquat. Sci. Downloaded from www.nrcresearchpress.com by NORTHWEST FISHERIES SCIENCE CENTER on 12/11/12 For personal use only.
Fig. 8. Late spring time series of abundance expressed as the log10 (mean no.)·10 m–2 ⫹ 1, normalized by the time-series mean and standard deviation, for the most abundant larval species in the Gulf of Alaska. Species are grouped according to end-point strategies identified by the PCA ordination: (a) synchronous species, (b) abundant species, (c) ubiquitous species, and (d) early phenology species.
relatively large larval size at hatching (enhanced larval competence) are likely to minimize starvation. The observed diversity of spawning and larval peak abundance phenologies suggests that Cushing’s (1975, 1995) match–mismatch hypothesis may not generally apply here. However, a more nuanced understanding is needed concerning patterns of prey
availability and prey selectivity during the varied annual periods of larval occurrence to understand the contribution of larval feeding processes to recruitment outcome across GOA species. The production gradient that emerged in our analysis was similar to that of Winemiller and Rose (1992) based on fecunPublished by NRC Research Press
Can. J. Fish. Aquat. Sci. Downloaded from www.nrcresearchpress.com by NORTHWEST FISHERIES SCIENCE CENTER on 12/11/12 For personal use only.
2126
dity and distributes the species in life history space based on the quantity of eggs and larvae that are deposited into the marine environment. As expected, most of the periodic type strategists plotted at the positive end of this gradient, and the opportunistic and equilibrium strategists along the negative portion of this axis, with an interesting negative association between production and larval duration and size at transformation. Nevertheless, the widespread distribution of these types and species along the phenology and ubiquity gradients illustrates that the quantity of eggs and larvae produced by any species is of limited value alone as an indicator of early life history exposure and response to the pelagic environment. The ubiquity gradient seems to be a valuable proxy that represents the temporal and spatial distribution of propagules initially in the pelagic environment, as well as dispersal distances throughout the larval phase. Furthermore, the negative relationship between ubiquity of larvae and larval competence lends credence to its relevance as an ecological measurement. Two GOA forage species, Pacific herring and Pacific sand lance (both opportunistic strategists), are good examples of end-point types along this gradient. Both these species spawn demersal, adhesive eggs in shallow coastal waters throughout the GOA. Nevertheless, their larvae experience radically different exposure patterns based largely on differences in spawning behavior and early larval competence. Pacific herring spawn predominantly in bays and estuaries in association with seaweed and eel grass (Hart 1973; Matarese et al. 2003) during spring, and when their larvae hatch after a short incubation period they seem to be able to affect their retention largely in shallow coastal waters. They are rare in GOA ichthyoplankton collections in shelf waters (Matarese et al. 2003). In contrast, Pacific sand lance deposit very small eggs (⬍1 mm diameter) in intertidal and subtidal sediments during autumn months (Robards et al. 1999). Their eggs overwinter in these sediments, and initial hatching of small and very weak larvae is documented in February with a peak in March (Doyle et al. 2009). From April through June, their larvae are distributed widely along the coastal and shelf region of the western GOA (Doyle et al. 2002a; Matarese et al. 2003). Such a larval drift strategy seems to favor efficient utilization of planktonic food resources throughout coastal and shelf waters by this species. This contrast between Pacific herring and Pacific sand lance, as well as the broad distribution of life history types along this ubiquity gradient, illustrates again the high variability of early life history exposure profiles among GOA species. The above variability in “exposure” patterns are expected to result in variable early life history “response” as mediated through varying abilities among species during early life to track or coincide with optimal conditions in the marine environment. These “optimal conditions” represent a balanced synthesis of multiple oceanographic processes such as suitable temperature ranges, advection patterns, food availability and encounter rates, and predator avoidance that results in favorable growth and survival through the larval stage. This synthesis approach to understanding environmental influence on survival attempts to unite various mechanistic processes within a single framework (Cole and McGlade 1998) and is considered more broadly applicable than the “optimal environmental window” hypothesis of Cury and Roy (1989) and the “triad hypothesis” (enrichment–retention– concentration) of Bakun (1993) proposed for clupeids in upwelling areas.
Can. J. Fish. Aquat. Sci. Vol. 69, 2012
Although each species in the GOA ecosystem has its own unique exposure pattern, the degree of commonality that has emerged among these patterns has contributed to what is proposed here as an effective trilateral framework of early life history exposure to environmental forcing among GOA fish populations. The potential utility of this framework as a predictive tool is supported by the NMDS ordination of the 27-year time series of GOA late-spring larval fish abundance. The preservation of the early life history gradients (phenology, production, and ubiquity) and associated grouping of species (including endpoint categories synchronous, abundant, and ubiquitous, and their opposites) indicates a strong connection between exposure pattern and response outcome during early ontogeny. The proximity on this ordination plot of species from a range of families with primarily neustonic larvae (e.g., sablefish, lingcod, kelp greenling and red Irish lord) is further evidence of larval response matching exposure. Such species experience unique habitat conditions at the surface of the ocean. The GOA late-spring time series of larval fish abundance is a limited and variable representation of synthesized larval survival among species. Nevertheless it yields coherent and synchronous patterns (based on 1981–2003 data) that are considered representative of environmental exposure–response connections during early life (Doyle et al. 2009). It is encouraging that the newly extended time series (through 2009) maintains a similar pattern of synchrony with respect to early life history, even with the addition of several species. These results are promising in terms of developing predictability with respect to recruitment variation among species that is attributable to early life processes. To explore this potential further, the extended time series in species larval abundance (data now available through 2011) and relationships with GOA environmental conditions will be investigated in future work that will also include analysis of recruitment time series. The early life history exposure framework proposed here is valuable as a means to identify (1) ecologically determined species groups that are predisposed to respond to environmental forcing in similar ways and (2) plausible environmental predictors of recruitment variation attributable to aspects of early life history. Biological and ecological details of species early life history exposure patterns in a given ecosystem can provide the information necessary to determine the former (via ordination of life history and ecological traits), and the investigation of links between time series of species larval abundance and time series of environmental variables can contribute to the development of the latter. There is good potential, therefore, for pan-regional application of this conceptual framework approach in ocean regions where ichthyoplankton studies have been concurrent with established and long-standing fisheries surveys and oceanographic investigations. It is likely that emergent frameworks would vary according to latitudinal variation in temperature regimes and production cycles, dominant oceanographic and ecological processes such as upwelling, and prevailing patterns of circulation, all to which resident fish populations will have developed unique and varied combinations of adaptive early life history strategies. Primary gradients in early life history variation can therefore be expected to differ regionally as well as distribution of species along such gradients. In reference to life history models and frameworks, Rose (2005) suggests that population responses should be considered in terms of the broadest range possible of life history Published by NRC Research Press
Can. J. Fish. Aquat. Sci. Downloaded from www.nrcresearchpress.com by NORTHWEST FISHERIES SCIENCE CENTER on 12/11/12 For personal use only.
Doyle and Mier
traits and that the site-specific components of population responses are critical. In this respect, there will always be the potential to improve constructs such as the GOA early life history framework by improving the accuracy of speciesspecific life history and ecological traits and by the addition of new biological and ecological information. For instance, detailed information on larval fish feeding ecology across species is generally lacking for most ecosystems, although certain studies have provided critical information (Llopiz and Cowen 2009; Llopiz et al. 2010). Knowledge of prey selectivity versus omnivory among species, during subintervals of early life, could contribute to the development of larval trophic indices that might be incorporated into an early life history exposure framework. Similarly, comprehensive species-specific process studies that determine growth rates under varying conditions and other physiological trajectories and constraints would be very useful in determining larval exposure–response processes (Heath and Gallego 1997; Burggren and Blank 2009. Ultimately, the development of an early life history exposure framework should include the determination of environmental vulnerability and resilience factors associated with each end-point strategy and associated species category subdivisions. Furthermore, for any species position within the three-dimensional space of the framework, whether in proximity or intermediate to the end points, an exposure profile can be developed that identifies critical vulnerabilities to environmental fluctuations. The end points and subdivisions among the GOA species types are characterized by contrasting sets of adaptive successes and challenges in relation to prevailing oceanographic and ecological processes. These features could be applied to an early life history assessment among species in which vulnerability ratings (e.g., low, medium, and high) are applied based on a comparison of early life history exposure– response profiles with various environmental change scenarios. Such scenarios could include ecological disturbances from climate variability, commercial fishing (Hsieh et al. 2005), and habitat degradation by pollutants. Finally, the early life history exposure framework is likely to be beneficial to the development of individual-based models and ecosystem models. For individual-based models that seek to represent the dynamics of an individual fish species from reproductive behavior and egg deposition through its complex ontogenetic pathway to recruitment, the early life history exposure framework is likely to be a valuable asset in constructing initial conceptual models. In addition, response relationships that may emerge from investigations of links between time series of larval abundance and suites of environmental forcing variables can contribute to the validation of such models. At the ocean basin scale, the challenges of modeling ecosystems include the necessity of incorporating complex coupling of processes across trophic levels. In response to such challenges, deYoung et al. (2004) recommend that target species in a model should be represented by key life history stages whose links to the environment are explicitly formulated. For fish species at least, it would seem that such mechanistic linkages can be illuminated effectively by the type of early life history exposure framework proposed here.
2127
Acknowledgements We appreciate the crews and scientists aboard the various research vessels that collected ichthyoplankton samples during NOAA surveys in the Gulf of Alaska from the 1970s to the present. In addition, we thank the many scientists at the Alaska Fisheries Science Center’s Recruitment Processes Program, and the Plankton Sorting and Identification Center in Sczcecin, Poland, who participated over the years in processing and analysis of the samples, as well as compilation of the ichthyoplankton data. We thank Jeff Napp, Ann Matarese, Janet Duffy-Anderson, Kevin Bailey, and Morgan Busby at the Alaska Fisheries Science Center for reviewing an earlier draft of this manuscript and providing many useful suggestions, and we value the constructive comments of two anonymous reviewers that helped strengthen the manuscript. This research was partially funded by the Joint Institute for the Study of the Atmosphere and Ocean, University of Washington, under NOAA Cooperative Agreement Nos. NA17RJ1232 and NA10OAR4320148, Contribution No. 1894, and by NOAA’s Climate Regimes and Ecosystem Productivity program. This research is contribution FOCI-0779 to NOAA’s Ecosystem and Fisheries Oceanography Coordinated Investigations program.
References Alheit, J., and Bakun, A. 2010. Population synchronies within and between ocean basins: apparent teleconnections and implications as to physical-biological linkage mechanisms. J. Mar. Syst. 79(3– 4): 267–285. doi:10.1016/j.jmarsys.2008.11.029. Anderson, P.J., and Piatt, J.F. 1999. Community reorganization in the Gulf of Alaska following ocean climate regime shift. Mar. Ecol. Prog. Ser. 189: 117–123. doi:10.3354/meps189117. Bailey, K.M. 2000. Shifting control of recruitment of walleye pollock, Theragra chalcogramma, after a major climatic and ecosystem change. Mar. Ecol. Prog. Ser. 198: 215–224. doi:10.3354/ meps198215. Bailey, K.M., and Picquelle, S.J. 2002. Larval distribution of offshore spawning flatfish in the Gulf of Alaska: potential transport pathways and enhanced onshore transport during ENSO events. Mar. Ecol. Prog. Ser. 236: 205–217. doi:10.3354/meps236205. Bailey, K.M., Ciannelli, L., Bond, N.A., Belgrano, A., and Stenseth, N.C. 2005. Recruitment of walleye pollock in a physically and biologically complex ecosystem: a new perspective. Prog. Oceanogr. 67(1–2): 24 – 42. doi:10.1016/j.pocean.2005.06.001. Bakun, A. 1993. The California Current, Benguela Current, and Southwest Atlantic Shelf ecosystems: a comparative approach to identifying factors regulating biomass yields. In Large marine ecosystems: stress, mitigation, and sustainability. Edited by K. Sherman, L.M. Alexander, and B.D. Gold. American Association for the Advancement of Science, Washington, D.C., USA. pp. 199 –224. Bakun, A. 2010. Linking climate to population variability in marine ecosystems characterized by non-simple dynamics: Conceptual templates and schematic constructs. J. Mar. Syst. 79(3– 4): 361– 373. doi:10.1016/j.jmarsys.2008.12.008. Blood, D.B., Matarese, A.C., and Busby, M.S. 2007. Spawning, egg development, and early life history dynamics of arrowtooth flounder (Atheresthes stomias) in the Gulf of Alaska. US Dep. Commer. NOAA Prof. Paper NMFS 7. Boeing, W.J., and Duffy-Anderson, J.T. 2008. Ichthyoplankton dyPublished by NRC Research Press
Can. J. Fish. Aquat. Sci. Downloaded from www.nrcresearchpress.com by NORTHWEST FISHERIES SCIENCE CENTER on 12/11/12 For personal use only.
2128 namics and biodiversity in the Gulf of Alaska: Responses to environmental change. Ecol. Indic. 8(3): 292–302. doi:10.1016/ j.ecolind.2007.03.002. Brodeur, R.D., and Rugen, W.C. 1994. Diel vertical distribution of ichthyoplankton in the northern Gulf of Alaska Fish. Bull 92: 223–235. Burggren, W., and Blank, T. 2009. Physiological study of larval fishes: challenges and opportunities. In Advances in early life history study of fish. Edited by C. Clemmesen, A.M. Malzahn, M.A. Peck, and D. Schnack. Scientia Marina 73S1, Barcelona, Spain. pp. 99 –110. Cole, J., and McGlade, J. 1998. Clupeoid population variability, the environment and satellite imagery in coastal upwelling systems. Rev. Fish Biol. Fish. 8(4): 445– 471. doi:10.1023/A: 1008861224731. Cooney, R.T. 1986. Zooplankton. In The Gulf of Alaska: physical environment and biological resources. Edited by D.W. Hood and S.T. Zimmerman. Minerals Management Service, OCS Study, MMS-86-0095. pp. 285–303. Coyle, K.O., and Pinchuk, A.I. 2003. Annual cycle of zooplankton abundance, biomass and production on the northern Gulf of Alaska shelf, October 1997 through October 2000. Fish. Oceanogr. 12(4 –5): 327–338. doi:10.1046/j.1365-2419.2003.00256.x. Cury, P., and Roy, C. 1989. Optimal environmental window and pelagic fish recruitment success in upwelling areas. Can. J. Fish. Aquat. Sci. 46(4): 670 – 680. doi:10.1139/f89-086. Cushing, D.H. 1975. Marine ecology and fisheries. Cambridge University Press, London, UK. Cushing, D.H. 1995. Population production and regulation in the sea: a fisheries perspective. Cambridge University Press, Cambridge, UK. deYoung, B., Heath, M., Werner, F., Chai, F., Megrey, B., and Monfray, P. 2004. Challenges of modeling ocean basin ecosystems. Science, 304(5676): 1463–1466. doi:10.1126/science.1094858. PMID:15178792. Doyle, M.J., Rugen, W.C., and Brodeur, R.D. 1995. Neustonic ichthyoplankton in the western Gulf of Alaska during spring. Fish. Bull. 93: 231–253. Doyle, M.J., Mier, K.L., Busby, M.S., and Brodeur, R.D. 2002a. Regional variation in springtime ichthyoplankton assemblages in the northeast Pacific Ocean. Prog. Oceanogr. 53(2– 4): 247–281. doi:10.1016/S0079-6611(02)00033-2. Doyle, M.J., Busby, M.S., Duffy-Anderson, J.T., Picquelle, S.J., and Matarese, A.C. 2002b. Early life history of capelin (Mallotus villosus) in the northwest Gulf of Alaska: a historical perspective based on larval collections, October 1977–March 1979. ICES J. Mar. Sci. 59(5): 997–1005. doi:10.1006/jmsc.2002.1236. Doyle, M.J., Picquelle, S.J., Mier, K.L., Spillane, M., and Bond, N. 2009. Larval fish abundance and physical forcing in the Gulf of Alaska, 1981–2003. Prog. Oceanogr. 80(3– 4): 163–187. doi: 10.1016/j.pocean.2009.03.002. Fuiman, L.A. 2002. Special considerations of fish eggs and larvae. In Fishery science: the unique contributions of early life stages. Edited by L.A. Fuiman and R.G. Werner. Blackwell Science, Oxford, UK. pp. 1–32. Hare, S.R., and Mantua, N.J. 2000. Empirical evidence for North Pacific regime shifts in 1977 and 1989. Prog. Oceanogr. 47(2– 4): 103–145. doi:10.1016/S0079-6611(00)00033-1. Hart, J.L. 1973. Pacific fishes of Canada. Bull. Fish. Res. Board Can. 180. Heath, M., and Gallego, A. 1997. From the biology of the individual to the dynamics of the population: bridging the gap in early life
Can. J. Fish. Aquat. Sci. Vol. 69, 2012 studies. J. Fish Biol. 51(A): 1–29. doi:10.1111/j.1095-8649.1997. tb06090.x. PMID:9236083. Hermann, A.J., Hinckley, S., Dobbins, E.L., Haidvogel, D.B., Bond, N.A., Mordy, C., Kachel, N., and Stabeno, P.J. 2009. Quantifying cross-shelf and vertical nutrient flux in the Coastal Gulf of Alaska with a spatially nested, coupled biophysical model. Deep Sea Res. Part II Top. Stud. Oceanogr. 56(24): 2474 –2486. doi:10.1016/ j.dsr2.2009.02.008. Hollowed, A.B., Bond, N.A., Wilderbuer, T.K., Stockhausen, W.T., A’mar, Z.T., Beamish, R.J., Overland, J.E., and Schirripa, M.J. 2009. A framework for modeling fish and shellfish responses to future climate change. ICES J. Mar. Sci. 66(7): 1584 –1594. doi: 10.1093/icesjms/fsp057. Hood, D.W., and Zimmerman, S.T. 1986. The Gulf of Alaska, physical environment and biological resources. US Dep. Commer. NOAA Tech. Rep. National Ocean Service, Ocean Assessments Division, Anchorage, Alaska, USA. Houde, E.D. 2008. Emerging from Hjort’s shadow. J. Northwest Atl. Fish. Sci. 41: 53–70. doi:10.2960/J.v41.m634. Hsieh, C., Reiss, C., Watson, W., Allen, M.J., Hunter, J.R., Lea, R.N., Rosenblatt, R.H., Smith, P.E., and Sugihara, G. 2005. A comparison of long-term trends and variability in populations of larvae of exploited and unexploited fishes in the Southern California region: a community approach. Prog. Oceanogr. 67(1–2): 160 –185. doi: 10.1016/j.pocean.2005.05.002. Jump, C.M., Duffy-Anderson, J.T., and Mier, K.L. 2008. Comparison of the Sameoto, Manta, and MARMAP neustonic ichthyoplankton samplers in the Gulf of Alaska. Fish. Res. 89(3): 222–229. doi: 10.1016/j.fishres.2007.08.019. King, J.R., and McFarlane, G.A. 2003. Marine fish life history strategies: applications to fishery management. Fish. Manag. Ecol. 10: 249 –264. King, J.R., and McFarlane, G.A. 2006. A framework for incorporating climate regime shifts into the management of marine resources. Fish. Manag. Ecol. 13(2): 93–102. doi:10.1111/j.1365-2400.2006. 00480.x. Litzow, M.A. 2006. Climate regime shifts and community reorganization in the Gulf of Alaska: How do recent shifts compare with 1976/1977? ICES J. Mar. Sci. 63(8): 1386 –1396. doi:10.1016/ j.icesjms.2006.06.003. Llopiz, J.K., and Cowen, R.K. 2009. Variability in the trophic role of coral reef fish larvae in the oceanic plankton. Mar. Ecol. Prog. Ser. 381: 259 –272. doi:10.3354/meps07957. Llopiz, J.K., Richardson, D.E., Shiroza, A., Smith, S.L., and Cowen, R.K. 2010. Distinctions in the diets and distributions of larval tunas and the important role of appendicularians. Limnol. Oceanogr. 55(3): 983–996. doi:10.4319/lo.2010.55.3.0983. Matarese, A.C., Kendall, A.W., Jr., Blood, D.M., and Vinter, B.M. 1989. Laboratory guide to the early life history stages of Northeast Pacific fishes. US Dep. Commer. NOAA Tech. Rep. NMFS 80. Matarese, A.C., Blood, D.M., Picquelle, S.J., and Benson, J.L. 2003. Atlas of abundance and distribution patterns of ichthyoplankton from the northeast Pacific Ocean and Bering Sea ecosystems based on research conducted by the Alaska Fisheries Science Center (1972–1996). US Dep. Commer. NOAA Prof. Paper NMFS 1. McCune, B., and Mefford, M.J. 1999. PC-ORD. Multivariate analysis of ecological data. Version 4. MjM Software Design, Gleneden Beach, Oregon. Megrey, B.A., Hare, J.A., Stockhausen, W.T., Dommasnes, A., Gjøsæter, H., Overholtz, W., Gaichas, S., Skaret, G., Falk-Petersen, J., Link, J.S., and Friedland, K.D. 2009. A cross-ecosystem comparison Published by NRC Research Press
Can. J. Fish. Aquat. Sci. Downloaded from www.nrcresearchpress.com by NORTHWEST FISHERIES SCIENCE CENTER on 12/11/12 For personal use only.
Doyle and Mier of spatial and temporal patterns of covariation in the recruitment of functionally analogous fish stocks. Prog. Oceanogr. 81(1– 4): 63– 92. doi:10.1016/j.pocean.2009.04.006. Miller, B.S., and Kendall, A.W., Jr. 2009. Early life history of marine fishes. University of California Press, Berkeley and Los Angeles, California. Mueter, F.J., Boldt, J.L., Megrey, B.A., and Peterman, R.M. 2007. Recruitment and survival of Northeast Pacific Ocean fish stocks: temporal trends, covariation, and regime shifts. Can. J. Fish. Aquat. Sci. 64(6): 911–927. doi:10.1139/f07-069. Mueter, F.J., Broms, C., Drinkwater, K.F., Friedland, K.D., Hare, J.A., Hunt, G.I., Jr., Melle, W., and Taylor, M. 2009. Ecosystem responses to recent oceanographic variability in high-latitude Northern Hemisphere ecosystems. Prog. Oceanogr. 81(1– 4): 93– 110. doi:10.1016/j.pocean.2009.04.018. Mundy, P.R. (Editor). 2005. The Gulf of Alaska: biology and oceanography. Alaska Sea Grant College Program, University of Alaska Fairbanks, Fairbanks, Alaska. Mundy, P.R., and Hollowed, A.B. 2005. Fish and Shelfish. In The Gulf of Alaska: biology and oceanography. Edited by P.R. Mundy. Alaska Sea Grant College Program, University of Alaska Fairbanks, Fairbanks, Alaska. pp. 81–97. Napp, J.M., Incze, L.S., Ortner, P.B., Siefert, D.L., and Britt, L. 1996. The plankton of Shelikof Strait, Alaska: standing stock, production, mesoscale variability and their relevance to larval fish survival. Fish. Oceanogr. 5(Suppl. s1): 19 –38. doi:10.1111/j.13652419.1996.tb00080.x. Ottersen, G., Alheit, J., Drinkwater, K., Friedland, K., Hagan, E., and Stenseth, N. 2004. The response of fish populations to ocean climate fluctuations. In Marine ecosystems and climate variation. Edited by N.Chr. Stenseth, G. Ottersen, J.W. Hurrell, and A. Belgrano. Oxford University Press, Oxford, UK. pp. 73–94. Rijnsdorp, A.D., Peck, M.A., Engelhard, G.H., Möllmann, C., and Pinnegar, J.K. 2009. Resolving the effect of climate change on fish populations. ICES J. Mar. Sci. 66(7): 1570 –1583. doi:10.1093/ icesjms/fsp056.
2129 Robards, M.D., Piatt, J.F., and Rose, G.A. 1999. Maturation, fecundity, and intertidal spawning of Pacific sand lance in the northern Gulf of Alaska. J. Fish Biol. 54(5): 1050 –1068. doi:10.1111/ j.1095-8649.1999.tb00857.x. Rose, K.A. 2005. Lack of relationship between simulated fish population responses and their life history traits: inadequate models, incorrect analysis, or site-specific factors. Can. J. Fish. Aquat. Sci. 62(4): 886 –902. doi:10.1139/f05-049. Sameoto, D.D., and Jaroszynski, L.O. 1969. Otter surface sampler: a new neuston net. J. Fish. Res. Board Can. 26(8): 2240 –2244. doi:10.1139/f69-213. Shima, M., and Bailey, K.M. 1994. Comparative analysis of ichthyoplankton sampling gear for early life stages of walleye pollock (Theragra chalcogramma). Fish. Oceanogr. 3(1): 50 –59. doi: 10.1111/j.1365-2419.1994.tb00047.x. Stabeno, P.J., Bond, N.A., Hermann, A.J., Kachel, N.B., Mordy, C.W., and Overland, J.E. 2004. Meteorology and oceanography of the Northern Gulf of Alaska. Cont. Shelf Res. 24(7– 8): 859 – 897. doi:10.1016/j.csr.2004.02.007. Tabachnick, B.G., and Fidell, L.S. 1996. Using multivariate statistics. 3rd ed. Harper Collins College Publishers, New York. Winemiller, K.O. 2005. Life history strategies, population regulation, and implications for fisheries management. Can. J. Fish. Aquat. Sci. 62(4): 872– 885. doi:10.1139/f05-040. Winemiller, K.O., and Rose, K.A. 1992. Patterns of life history diversification in North American Fishes: implications for population regulation. Can. J. Fish. Aquat. Sci. 49(10): 2196 –2218. doi:10.1139/f92-242. Wood, R.J., and Austin, H.M. 2009. Synchronous multidecadal fish recruitment patterns in Chesapeake Bay, USA. Can. J. Fish. Aquat. Sci. 66(3): 496 –508. doi:10.1139/F09-013. Yatsu, A., Aydin, K.Y., King, J.R., McFarlane, G.A., Chiba, S., Tadokoro, K., Kaeriyama, M., and Watanabe, Y. 2008. Elucidating dynamic responses of North Pacific fish populations to climatic forcing: Influence of life-history strategy. Prog. Oceanogr. 77(2–3): 252–268. doi:10.1016/j.pocean.2008.03.009.
Published by NRC Research Press