Journal of Chromatographic Science, Vol. 42, February 2004
A New HPLC Method to Determine Glomerular Filtration Rate and Effective Renal Plasma Flow in Conscious Dogs by Single Intravenous Administration of Iohexol and p-Aminohippuric Acid V. Meucci1, A. Gasperini1, G. Soldani1, G. Guidi2, and M. Giorgi1,* 1Pharmacology
and Toxicology Section and 2Clinical Medicine Section, Veterinary Clinics Department, V.le delle Piagge 2, 56124, Pisa, Italy
Abstract A high-performance liquid chromatography method to determine iohexol (IOX) and p-aminohippuric acid (PAH) in the plasma of dogs is evaluated according to recovery, reproducibility, and linearity utilizing a gradient pump. The mobile phase consists of 50mM sodium dihydrogen phosphate with 0.5mM tetrabutylammonium chloride, the pH is adjusted to 4.1, methanol is added to the final ratio of 90:10 (v/v), the flow rate is set at 1 mL/min, and separation is achieved with an ODS2 Luna column. The UV detector is set at 254 nm. IOX and PAH are used for evaluation of the effective renal plasma flow (ERPF) and glomerular filtration rate (GFR). The present method tested in three dogs demonstrates the accuracy in the evaluation of ERPF and GFR. Because of its precision and simplicity and low cost, it can be considered a good tool for ERPF and GFR in small animal practice.
Introduction It is generally acknowledged that glomerular filtration rate (GFR) is the best quantitative parameter of overall renal function (1). The GFR is considered one of the earliest and most sensitive indicators of renal dysfunction (1). In the presence of acute renal failure or chronic renal failure, alterations in the GFR occur. The magnitude of the alteration is dependent on the etiology of the dysfunction (glomerular vs. tubular disease) and the intrinsic ability of the kidney to compensate. Any change in the mechanisms that regulate renal perfusion and renal plasma flow or changes in glomerular hydraulic and oncotic pressures will lead to a reduction in GFR. A reduction in GFR results in the buildup of several substances and metabolites in the blood, which, under normal conditions, the kidney rapidly removes. The GFR is determined by the renal or plasma clearance of an ideal filtration marker, which is freely filtered by the kidney and is neither bound to plasma proteins nor reabsorbed, secreted, or metabolized by the * Author whom correspondence should be addressed: email
[email protected].
renal tubule and does not affect GFR. However, the classical reference method for estimation of GFR, the renal clearance of inulin, is not useful in routine clinical practice. Over the past few years, there has been an increasing interest in using iohexol (IOX), a nonionic low-osmolarity contrast medium, as a GFR marker in both animals (2–4) and humans (5). The effective renal plasma flow (ERPF) is, in contrast to GFR, seldom determined. An assessment of ERPF may help in understanding various pathophysiological events including alterations in GFR, delivery of substrate and hormones, and intrarenal distribution of blood flow, which occur in various experimental and spontaneous renal diseases (6). Another interest in assessing both GFR and ERPF is to assess the effects of drugs such as anthypertensive agents on renal hemodynamics and filtration in animal and human renal-impaired patients (7). For example, the angiotensin-converting enzyme inhibitors and nondihydropyridine calcium antagonists reduce the filtration fraction (i.e., the ratio of GFR to ERPF) and decrease proteinuria independent of changes in blood pressure (7). The clearance of IOX and p-aminohippuric acid (PAH), an ERPF indicator, from the plasma may be estimated by high-performance liquid chromatography (HPLC) (6), but this technique has problems. These problems include extensive extraction procedures, peak splitting with large volume injections, and lack of internal standards (8,9). Therefore, the principal aim of this study is to develop a rapid and simple HPLC method for the simultaneous determination of IOX and PAH in canine plasma.
Experimental Chemicals and reagents
IOX and iopentol (IOP) were supplied by Nycomed Amersham Sorin (Milan, Italy). PAH and p-aminobenzoic acid (PABA) were purchased from Sigma (St. Louis, MO). Water was doubly distilled and purified using a Sartorius cellulose acetate filter (Goettingen, Germany). Monobasic phosphate (H2PO4–), trichloroacetic acid
Reproduction (photocopying) of editorial content of this journal is prohibited without publisher’s permission.
107
Journal of Chromatographic Science, Vol. 42, February 2004
(TCA), perchloric acid (HClO4), and tetrabutylammonium chloride (TBA) were of analytical-reagent grade and were purchased from Merck (Darmstadt, Germany). Methanol, acetone, dichloromethane, and acetonitrile were of HPLC grade (Merck). Instrumentation
The HPLC system consisted of a Series 200 PerkinElmer gradient pump coupled to a Series 200 PerkinElmer variable UV detector (Wellesley, MA), which was set at 254 nm; this wavelength was chosen as a compromise among the four substances. The analytical column was a 25-cm C18 Luna reversed-phase column (particle size of 5 µm) purchased from Phenomenex (Torrence, CA). It was coupled to a Phenomenex guard column. The control of the HPLC system and data collection was by an IBM-compatible computer equipped with Turbochrome software (PerkinElmer). A 20-µL injection was used each time. Method development and optimization
and methanol (for PABA), stored at 4ºC, and prepared monthly. Preparation of plasma samples
Four different sample preparation methods were tested for the extraction of both IOX and PAH and the corresponding internal standard. Fifty microliters of a methanolic solution of PABA (50 µg/mL) was placed into a clean tube and dried at 40ºC. Plasma (50 µL) was added to dissolve the drug, spiked with 50 µL of IOP solution (50 µg/mL), and vigorously vortexed. The corresponding samples were split for parallel preparation. Percentage recoveries of each method were calculated to select the sample preparation that yielded the optimum recoveries for all drugs. Plasma samples were deproteinized by adding 100 µL of 5% HClO4 solution (A), 10% TCA solution (B), dichloromethane (CH2Cl2) (C), or acetone (D) (Table I) extracted with double-distilled water (1:1.5, v/v) and centrifuged at 3000 rpm for 10 min; 20 µL of each supernatant was injected into the HPLC system. The time estimated for one set of samples (n = 13) was 15–20 min.
Several parameters were varied to determine the set of parameters that yielded optimum separation. With each change in the mobile phase, the column was re-equilibrated with the new solvent by washing with at least 20 column volumes before the next separation (10). The percentage of the mobile phase organic solvents was varied using different combinations of acetonitrile–phosphate buffer (30:70, 20:80, 10:90, and 5:95, v/v) and the methanol–phosphate buffer (30:70, 20:80, 10:90, and 5:95, v/v). Once the optimal combination of methanol–phosphate buffer was determined, the phosphate buffer concentration was further varied between 10 and 50mM. TBA was added to the mobile phase at concentrations of 0.25, 0.5, and 0.75mM. The pH of the mobile phase was varied between 2.5 and 7; higher pH values were not examined to prevent stripping of the bonded phase and preserve column life (10). Preparation of stock solutions
Stock solutions of IOX and PAH were prepared monthly as 2-mg/mL solutions in double-distilled water and methanol, respectively, and stored at 4ºC. IOX and PAH concentrations in the working standard solutions chosen for the calibration curves were 0.5, 5, 10, 25, 50, and 100 µg/mL. These working solutions were made by further diluting the stock solutions and were prepared fresh daily. Stock solutions of the internal standards (50 µg/mL each) were prepared in double-distilled water (for IOP) Table I. Percentage Recoveries of IOX, PAH, PABA, and IOP by Liquid Extraction Method Using Different Deproteinizing Agents* Deproteinizing Recovery agent of IOX (%) (A) HClO4 (B) TCA (C) CH2Cl2 (D) Acetone
63 ± 3† 71 ± 4† 92 ± 4 87 ± 5
Recovery of PAH (%)
Recovery of PABA (%)
Recovery of IOP (%)
65 ± 4 64 ± 5 80 ± 3 74 ± 3
63 ± 4 62 ± 4 81 ± 4 71 ± 5
62 ± 3† 71 ± 3† 92 ± 4 88 ± 5
* Extraction with doubly distilled water (1:1.5, v/v). † Collapsed peaks.
108
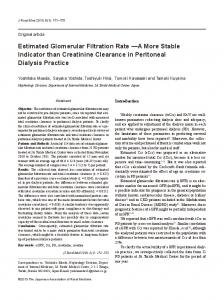
Figure 1. Chemical structures of iohexol, iopentol, p-aminohippuric acid, and p-aminobenzoic acid.
Journal of Chromatographic Science, Vol. 42, February 2004
Validation
Intraday reproducibility was evaluated by analyzing three blood samples with IOX and PAH to obtain three different concentrations (10, 25, and 50 µg/mL). Day-to-day reproducibility was determined by analysis of three replicate samples of the three concentrations (10, 25, and 50 µg/mL) on seven consecutive days. From the data obtained, intra- and interday relative standard deviations (RSDs) were calculated. Accuracy was expressed as the mean percentage of analyte recovered in the assay. Animal study
Three healthy mongrel male dogs, 2–3 years of age, weighing 15–20 kg were studied. The animals were individually caged in temperature-controlled rooms at a 12-h light cycle with a temperature of 20–22ºC and 50–60% relative humidity. They were fed standard laboratory chow and tap water ad libitum. Animal care and handling was in accordance with the indications of the European Union Council Directive 86-609, as recognized and adopted by the Italian Government (DL 27/01/1992, No. 116). The dogs were clinically healthy, as determined by a complete physical examination and routine hematological and clinical chemistry analyses. A commercially available IOX formulation (Omnipaque 300, Nycomed Amersham Sorin, Milan, Italy) was used. IOX exists in several isomeric forms because of chiral centers and restricted rotation (11). Two stereoisomers, exo-iohexol (quantitatively the most important) and endo-iohexol, were identified in the present study (Figure 1). The PAH solution was prepared just before administration by dissolving PAH in sterile 0.9% NaCl to obtain a final concentration of 33.3 mg/mL. The nominal doses of IOX and PAH were 64.7 (corresponding to 30 mg iodine/kg) and 10 mg/kg, respectively. The exact doses were determined from the difference between the weights of the syringe before and after the administration. IOX and, immediately afterward, PAH were administered over 60-s periods as intravenous bolus injections via an indwelling catheter placed in the left cephalic vein. The catheter was flushed with 4 mL of 0.9% NaCl after injection. One milliliter of blood was directly sampled from the right cephalic vein, placed in a heparinized tube, and centrifuged. Samples were obtained before (time 0) and at 0.08, 0.16, 0.25, 0.32, 0.5, 0.75, 1, 1.5, 3, 4, 5, and 7 h after administration of the markers.
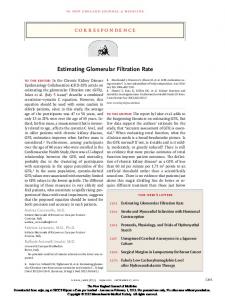
varied. PAH was greatly influenced in area counts, retention time, and band tailing at extreme pH (high and low), whereas IOX was poorly influenced only in retention time. Therefore, a pH of 4.1 was selected as optimum because it yielded the best area count for both substances with the least band tailing. Average retention times for IOX, PAH, PABA, and IOP were 7.22, 8.49, 10.53, and 19.31 min, respectively. To accelerate the IOP elution, a step gradient (methanol–phosphate buffer, 13:87) was created during the last 15 min of the 25-min chromatographic run [total HPLC run 30 min (25-min run time + 5 min re-equilibration time)] (Figure 2). Preparation of plasma samples
A 1:1.5 (v/v) combination of dichloromethane in water (CH2Cl2–H2O) was optimum for extraction of all four substances simultaneously (Table I) and was selected for our deproteinization and extraction method. When the pH of the plasma varied (as occurred after addition of 10% TCA or 5% HClO4), the resulting peaks collapsed. Therefore, conditions were maintained at plasma pH; this was accomplished by deproteinizing specimens with ace-
Figure 2. HPLC chromatogram of a representative plasma sample from a dog after intravenous administration of IOX and PAH, with the corresponding internal standards IOP and PABA.
Table II. Linearity Data for IOX- and PAH-Calibration Standard Response Values IOX Calibration
Results and Discussion Optimization of chromatographic conditions
Methanol–phosphate buffer combinations of 30:70, 20:80, 10:90, and 5:95 (v/v) yielded smaller area counts, with increases in organic composition. Therefore, the 10% methanol and 90% phosphate buffer combination was chosen. The choice of buffers that do not absorb at a low wavelength is limited, with the organic phosphates (such as phosphate buffer) being the most suitable (10). The 50-mM phosphate buffer was chosen because the concentration was sufficient to avoid band tailing. After TBA, asymmetry and retention time on the column were reduced; however, there was no additional improvement in peak symmetry at TBA concentrations greater than 0.5mM. IOX and PAH exhibited different behaviors when the pH was
Day 1 Intercept Slope Correlation coefficient (r2) Day 2 Intercept Slope Correlation coefficient (r2) Day 3 Intercept Slope Correlation coefficient (r2)
PAH
Set 1 (n = 7)
Set 2 (n = 7)
Set 1 (n = 7)
Set 2 (n = 7)
–34,440 55,510
–7253 55,322
8999 171,800
–54,323 170,577
0.9997
0.9987
0.9907
0.9982
–11,120 55,263
–24,533 55,841
–106,201 173,023
–107,243 169,300
0.9989
0.9992
0.9981
0.9971
–25,987 55,757
–31,528 55,936
–115,200 173,246
–24,323 174,234
0.9995
0.9989
0.9980
0.9990
109
Journal of Chromatographic Science, Vol. 42, February 2004
tone or CH2Cl2. The latter solvent yielded optimum extraction. Calibration graphs (n = 7) were constructed in triplicate over the concentration range of 0.5–100 µg/mL for IOX and PAH (Table II). The linearity of the calibration graphs was demonstrated by a high correlation coefficient (r2) obtained for the regression lines. The precision of the test was evaluated by determining the interand intraday relative standard deviation (RSD) of the measured peak area ratios for different concentrations. The accuracy was expressed as the mean percentage of analyte recovered in the assay (Table III). The limits of quantitation (LOQs), defined in the present experiment as the lowest plasma concentration in the calibration curve that can be measured routinely with acceptable precision (RSD < 20%), and accuracy (80–120%) were 2 and 0.5 µg/mL for IOX and PAH, respectively. In the present work, the limits of detection (LODs) were not defined in terms of two-, three, or tenfold noise levels, which is no longer practical, as noise levels vary from detector to detector (12). The LODs were found to be similar to the LOQs (2 and 0.5 µg/mL for IOX and PAH, respectively). The formal ruggedness test was conducted when the method was validated on a second HPLC system (Jasco, Easton, MD) by another analyst (results not shown). Using the optimized parameters, the method was found to be equally robust.
Figure 3 represents the mean plasma profile of PAH coadministered with IOX. The plasma concentration of PAH was below the LOQ 1 h after its intravenous administration. The PAH total plasma clearance was 302.68 ± 54.40 mL/min. Both GFR and ERPF were in the range previously reported for dogs (13). Several papers express GFR values as mL Kg–1 min–1, but it is not useful to compare big and little size dogs. In accordance to Frennby and Sterner (14), the present paper expresses GFR values as mL min–1 m–2. This approach considers the animal body surface and not the animal weight because little size animals have a major metabolic speed if compared with big size animals, and it is more correlated to body surface area than weight (15).
Conclusion The present study describes a new method for the measurement of IOX and PAH to evaluate GFR and ERPF simultaneously.
Animal study
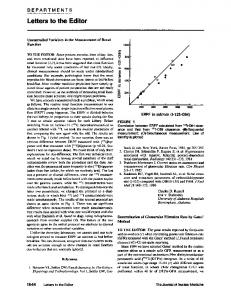
The method was applied to the analysis of plasma samples in a pharmacokinetic study involving three dogs. Pharmacokinetic curves (mean ± standard deviation) of IOX and PAH are reported in Figures 3 and 4. Figure 3 represents the mean plasma profile of IOX coadministered with PAH. Plasma clearance of IOX was 70.26 ± 4.30 mL/min and, when adjusted for body surface area of each dog, the GFR was calculated to be 77.16 ± 7.86 mL/min × m2. Table III. Intra- and Interday Precision and Accuracy of IOX and PAH Estimation in Plasma Samples from Three Dogs Concentration (µg/mL) Mean IOX Interday (between batch) 10 9.97 25 23.60 50 46.90 Intraday (within batch) 10 9.73 25 24.10 50 46.70 PAH Interday (between batch) 10 8.87 25 21.60 50 43.50 Intraday (within batch) 10 9.02 25 22.10 50 42.70 * SD = standard deviation.
110
SD*
Precision RSD (%)
Accuracy (%)
0.69 2.60 4.20
3.99 4.34 2.87
0.99 0.94 0.94
0.71 3.00 4.30
6.23 4.22 2.56
0.97 0.96 0.93
1.53 3.60 7.20
7.58 7.36 4.67
0.88 0.86 0.87
1.41 4.68 8.78
8.65 6.78 4.34
0.90 0.88 0.85
Figure 3. Plasma profile of IOX coadministered with PAH. Values represent the mean ± standard error of the mean (SEM) of IOX concentrations at each time point obtained in plasma samples from three dogs.
Figure 4. Mean plasma profile of PAH coadministered with IOX. Values represent the mean ± SEM of PAH concentrations at each time point obtained in plasma samples from three dogs.
Journal of Chromatographic Science, Vol. 42, February 2004
The current method employs two internal standards: IOP for IOX and PABA for PAH. The method has been validated in three healthy dogs and shows that both GFR and ERPF can be rapidly estimated with minimal blood sampling.
Acknowledgments The present work has been presented at the International Conference on Antimicrobal Agents in Veterinary Medicine (AAVM) in Helsinki, Finland, August 4–8, 2002. The authors thank Nycomed Amersham Sorin (Milan, Italy) for the generous gifts of IOX and IOP.
6.
7. 8. 9.
10.
References 1. F. Gaspari, N. Perico, and G. Remuzzi. Measurement of glomerular filtration rate. Kidney Int. 52: S151–54 (1997). 2. S.A. Brown, D.R. Finco, F.D. Boudinot, J. Wright, S.L. Tarver, and T. Cooper. Evaluation of a single injection method, using iohexol, for estimating glomerular filtration rate in cats and dogs. Am. J. Vet. Res. 57: 105–10 (1996). 3. A. Gleadhill and A.R. Michell. Evaluation of iohexol as a marker for the clinical measurement of glomerular filtration rate. Res. Vet. Sci. 60: 117–21 (1996). 4. M. Nesje, A. Flaoyen, and L. Moe. Estimation of glomerular filtration rate in normal sheep by disappearance of iohexol from serum. Vet. Res. Comm. 21: 29–35 (1997). 5. F. Gaspari, N. Perico, M. Matalone, O. Signorini, N. Azzolini, M. Mister, and G. Remuzzi. Precision of plasma clearance of iohexol
11. 12.
13.
14. 15.
for estimation of GFR in patients with renal disease. J. Am. Soc. Nephrol. 9: 310–13 (1998). R.G. Narins, G.G. Krishna, and L.J. Riley. “Assessment of renal function: characteristics of the functional and organic forms of acute renal failure.” The Kidney: Physiology and Pathophysiology, 2nd ed. D.W. Seldin and G. Giebisch, Eds. Raven press, New York, NY, 1992, pp. 3063–84. D.D. Maki, J.Z. Ma, T.A. Louis, and B.L. Kasiske. Long-term effects of anthypertensive agents on proteinuria and renal function. Arch. Int. Med. 155: 1073–80 (1995). J. Edelson, G. Palace, and G. Park. High-performance liquid chromatographic determination of iohexol in plasma, urine and feces. J. Chromatogr. 274: 428–33 (1983). P.B. Jacobsen. High performance liquid chromatography with multiwavelength detection: a technique for identification of iodinated xray contrast agents in human body fluids and brain tissue. Am. J. Neuroradiol. 13: 1521–25 (1992). L.R. Snyder, J.L. Glajch, and J.J. Kirkland. Practical HPLC Method Development. John Wiley, New York, NY, 1988, pp. 35–60. T. Jacobsen. The preclinical development of iohexol (Omnipaque): a new X-ray contrast medium. Farmakoterapi 38: 45–77 (1982). Food and Drug Administration. Reviewer Guidance: Validation of Chromatographic Methods. Center for Drug Evaluation and Research (CDER). http://www.fda.gov/cder/guidance/cmc3/pdf (accessed November, 1994). V. Laroute, H.P. Lefebvre, G. Costes, and P.L. Toutain. Measurement of glomerular filtration rate and effective renal plasma flow in the conscious beagle dog by single intravenous bolus of iohexol and p-aminohippuric acid. J. Pharmacol. Toxicol. 41: 17–25 (1999). B. Frennby and G. Sterner. Contrast media as marker of GFR. Eur. Radiol. 12: 475–84 (2002). M. Haller, W. Muller, H. Binder, W. Estelberg, and P. Arnold. Singleinjection inulin clearance—a simple method for measuring glomerular filtration rate in dogs. Res. Vet. Sci. 64: 151–56 (1998). Manuscript accepted November 26, 2003.
111