No 2003 – 22 December
A New Look at the Feldstein-Horioka Puzzle using an Integrated Panel
_____________
Anindya Banerjee Paolo Zanghieri
A New Look at the Feldstein-Horioka Puzzle using an Integrated Panel
_____________
Anindya Banerjee Paolo Zanghieri
No 2003 – 22 December
A New Look at the Feldstein-Horioka Puzzle using an Integrated Panel
TABLE OF CONTENTS SUMMARY ..............................................................................................................................................4 ABSTRACT..............................................................................................................................................5 RÉSUMÉ ..................................................................................................................................................6 RÉSUMÉ COURT ....................................................................................................................................7
1.
INTRODUCTION ...........................................................................................................................8
2.
THE FELDSTEIN-HORIOKA PUZZLE .........................................................................................9
3.
UNIT ROOT AND COINTEGRATION TESTS .............................................................................12
4.
EMPIRICAL RESULTS ................................................................................................................15
5.
INTERPRETING THE RESULTS : HOW IMPORTANT IS CROSS -UNIT COINTEGRATION.......................................................................................................................19
6.
SENSITIVITY ANALYSIS ............................................................................................................20
7.
THE EVIDENCE FROM THE BAI AND NG FACTOR TESTS .....................................................21
8.
CONCLUSION..............................................................................................................................23
APPENDIX.............................................................................................................................................24 BIBLIOGRAPHY ...................................................................................................................................36 LIST OF WORKING PAPERS RELEASED BY CEPII ..........................................................................38
3
CEPII, Working Paper No 2003 - 22
A NEW LOOK AT THE FELDSTEIN -HORIOKA PUZZLE USING AN INTEGRATED PANEL
SUMMARY
The Feldstein-Horioka puzzle has been the subject of much recent empirical and theoretical attention in the literature. The empirical finding that savings and investment within a country are highly correlated with each other has been typically seen to run against the conventional hypotesis of perfect capital mobility. Various attempts to reconcile the theory with the empirical findings have been made. In particular, it has been observed that the series used for the estimation exercises display properties akin to series with unit roots. This has the implication that the correlations observed are in fact to be interpreted as cointegrating relationships and the literature relating to integrated and cointegrated processes thereby becomes relevant for the study of the puzzle. Recent studies have suggested that inference from commonly-used panel tests for integration and cointegration are harmed by the presence of cointegrating relations among the variables across the countries in the panel. These relations are typically not allowed for in the testing theory developed for the integrated panel tests, yet are very likely to be present. A proper consideration of the puzzle therefore requires combining the evidence from the country-by-country tests and the panel tests with the evidence on the presence or absence of cross-country cointegration. We tackle this issue by running unit root and cointegration test, using a sample of European countries for the period 1960-2002. We also tested other hypotheses, such as government and private sector solvency. Our main findings are the following: -
Cross country cointegration matters a lot. In particular it is likely to play a critical role in the finding that, when panel unit roots tests are employed, the current account turns out to be stationary. This should lead to a reconsideration of the results of previous studies on the Feldstein Horioka puzzle.
-
Cross country cointegration is also important in determining intertemporal solvency: once this phenomenon is taken into account it appears that overall government intertemporal budget constraint is not respected. The results for the private sectors are less clear cut and depend heavily on the group of countries considered
ABSTRACT
We use a panel of 14 European countries to take a fresh look at the so-called FeldsteinHorioka puzzle on the high correlations between savings and investment observed within countries. A large literature has emerged to investigate this issue, using both individual country-by-country data and panels constructed by pooling data from several countries although the answers remain by and large elusive. Since we argue that the savings and investment series in our panel are integrated of order one, we use the recently developed theory of panel unit roots and cointegration to look at the relationship between savings and investment. Our particular contributions are (a) to consider the puzzle comprehensively, using both time series and panel methods for integrated series; (b) to consider subsets of countries in the panel; and (c) to apply tests of the hypothesis to various disaggregates and 4
A New Look at the Feldstein-Horioka Puzzle using an Integrated Panel
transformations of the core datasets, with our particular interest centering on the implications for fiscal policy. We also interpret the findings of our tests in the light of the likely presence of cross-country cointegration (which is known to affect the properties of the tests for unit roots and cointegration. J.E.L. classification: Keywords:
C31, C33,F32, F41 saving, investment, capital mobility, panel cointegration
5
CEPII, Working Paper No 2003 - 22
UN NOUVEAU REGARD SUR LE PARADOXE DE FELDSTEIN -HORIOKA A PARTIR DE LA METHODOLOGIE “ PANEL INTÉGRÉ”
RÉSUMÉ
La constatation empirique que l’épargne et l’investissement d’un pays sont fortement corrélatifs est en contradiction avec l’hypothèse traditionnelle de mobilité parfaite des capitaux. Il en a résulté un grand nombre d’études visant à réconcilier la théorie avec les faits. Tout récemment, l’observation selon laquelle les deux séries ont normalement une racine unitaire a conduit à interpréter la corrélation observée comme une relation de cointegration, ce qui a amené à l’application de techniques pour l’étude de panel de séries non stationnaires. Les recherches plus récentes dans l’économétrie des données panel ont montré, néanmoins, que l’inférence obtenue par les test d’intégration et cointégration est affaiblie par la présence de cointégration entre les individus composant le panel. Ce type de relation n’est pas pris en compte par la théorie de l’intégration en panel, mais se retrouve très probablement dans les séries macro-économiques. Par conséquent, une analyse appropriée de la relation entre épargne et investissement rend nécessaire de combiner les résultats des test d’intégration et cointégration appliqués pays par pays et en panel, avec la vérification de la présence ou absence de cointégration entre les pays. Nous abordons cette problématique en appliquant plusieurs tests à un échantillon de pays européens sur la période 1960-2002. En même temps nous testons d’autres hypothèses, comme la solvabilité intertemporelle des secteurs public et privé. Les principaux résultats auxquelles nous arrivons sont les suivants: -
Les méthodes de panel montrent que la balance courante est stationnaire. La cointégration entre pays joue un rôle central dans cette conclusion et devrait amener à une reconsidération des résultats des études précédentes sur ce sujet.
-
Ce phénomène est important aussi pour ce qui concerne l’évaluation de la solvabilité intertemporelle. Notre conclusion est que, une fois considérée la cointégration entre pays, la contrainte budgétaire du gouvernement n’est pas respectée. Les résultats pour le secteur privé sont moins clairs et dépendent en large mesure du groupe de pays considérés.
RÉSUMÉ COURT
Nous utilisons un panel de 14 pays européens pour donner une nouvelle évaluation au paradoxe de Feldstein et Horioka, c’est-à-dire la forte corrélation qu’on observe entre épargne et investissement. Une vaste littérature s’est occupée du sujet, avec des analyses pays par pays, en coupe ou en panel. Les résultats ne sont pas encore unanimes. En partant de la constatation que les séries d’épargne et investissement sont normalement intégrées de premier ordre, nous utilisons des techniques récentes de racine unitaires en panel pour étudier la relation entre les deux variables. Nos apports originaux sont les suivants: (a) le paradoxe est analysé en utilisant en même temps des techniques de séries 6
A New Look at the Feldstein-Horioka Puzzle using an Integrated Panel
temporelles et de panel; (b) on considère plusieurs sous-échantillons de pays; et (c) on applique les tests à plusieurs transformations des données, avec un intérêt spécifique pour la politique fiscale. Finalement, nous interprétons les résultats ainsi obtenus à la lumière de la présence de cointégration entre les pays, ce qui influence de manière importante les propriétés des tests d’intégration et cointégration. J.E.L.: Mots-clés:
C31, C33,F32, F41 épargne, investissement, mobilité des capitaux, cointégration en panel
7
CEPII, Working Paper No 2003 - 22
A NEW LOOK AT THE FELDSTEIN -HORIOKA PUZZLE USING AN INTEGRATED PANEL ♣
♠
Anindya Banerjee , Paolo Zanghieri
1.
INTRODUCTION
The Feldstein-Horioka puzzle has been the subject of much recent empirical and theoretical attention in the literature. The empirical finding that savings and investment within a country are highly correlated with each other has been typically seen to run against the conventional wisdom that in a world of perfect capital mobility, where capital flows among countries should act to equalise the yields to investors, such correlations should not be observed. 1
Various attempts to reconcile the theory with the empirical findings have been made. In particular, it has been observed that the series used for the estimation exercises display properties akin to series with unit roots. This has the implication that the correlations observed are in fact to be interpreted as cointegrating relationships and the literature relating to integrated and cointegrated processes thereby becomes relevant for the study of the puzzle (Coakley, Kulasi and Smith, 1996, Jansen, 1998). Secondly, it has been argued that country-by-country analyses of the integration and cointegration properties of series are likely to be hampered by the low power of these tests (Ho, 2002a). Consequently the investigation has adopted recently developed techniques applicable to integrated and cointegrated panels to consider the puzzle using panels of data from a new database compiled by the European Commission2 . In our study reported below, we decide to narrow our focus to European Union countries, instead of considering the larger group of OECD members included in the database. This choice is made on the grounds that these countries are much more likely to be homogeneous in terms of savings and investment behaviour3 , thereby allowing the use of panel methodologies which typically rely on such homogeneity. ♣
Department of Economics, European University Institute, Via della Piazzuola, 43 – 50133 Firenze, Italy –
[email protected] ♠
Centre d’Etudes Prospectives et d’Information Internationales, 9, rue Georges Pitard, 75015 Paris –
[email protected] 1
See Coakley, Kulasi and Smith (1998) for a recent survey of the literature.
2
It is the European Commision’s Annual Macroeocomic Database of the Directorate General for Economic and Financial Affairs (AMECO), that combines data obtained from national sources as well as from the IMF and OECD. The countries we consider are : Austria, Belgium, Denmark, Finland, France, Germany, Greece, Ireland, Italy,Netherlands, Portugal, Spain, Sweden and United Kingdom. German data up to 1991 refers to West Germany. Time dummies for the reunification period have been used in the cointegration tests reported later. 3
See for example, Blanchard and Giavazzi (2002) for summary evidence in favour of this observation.
8
A New Look at the Feldstein-Horioka Puzzle using an Integrated Panel
In independent work, the first-named author of this paper and his co-authors have suggested that inference from commonly-used panel tests for integration and cointegration are harmed by the presence of cointegrating relations among the variables across the countries in the panel (Banerjee, Marcellino and Osbat 2003a, b). These relations are typically not allowed for in the testing theory developed for the integrated panel tests, yet are very likely to be present. The particular criticism is that while country-by-country tests tend to under-reject the null of a unit root (or of no cointegration between savings and investment), panel tests over-reject this null hypothesis. A proper consideration of the puzzle therefore requires combining the evidence from the country-by-country tests and the panel tests with the evidence on the presence or absence of cross-country cointegration. Our paper is a comprehensive consideration of all these issues. Section 2 sketches the most recent results on the Feldstein-Horioka puzzle, and presents an alternative explanation for the puzzle based on the interaction between fiscal policy and private savings and investment decisions. Section 3 presents the tests for unit roots and cointegration in panels used in this paper. Section 4 presents the data and we report the results of the tests for integration and cointegration of the relevant series, country-by-country and in panels. In Section 5, we estimate systems of equations (using subsets of countries from the panel) by maximum likelihood methods to look at the cross-unit cointegration present in the data. Section 6 considers various sensitivity analyses for the main findings, including reestimating the main results for different partitions of the dataset by groups of countries. Together with the results in Section 5, these help to interpret the findings of integration and cointegration derived in Section 4, attempting to reconcile the evidence from country-bycountry tests with those obtained from panel tests. The evidence presented in Banerjee, Marcellino and Osbat (2003a, b) is also used in this interpretation. Finally, Section 7 provides a combination of time series and panel methods by estimating the panel unit root tests and cointegration using a method due to Bai and Ng (2003) that allows for the presence of cross-unit cointegration. Section 8 concludes.
2.
THE FELDSTEIN -HORIOKA PUZZLE
The finding of a strong correlation between savings and investment within a given country, as reported by Feldstein and Horioka (1980), has sparked a huge literature on trying to explain this puzzle and to reconcile it with the overwhelming evidence of high capital mobility. The most recent contributions have stressed the role of the statistical properties of the savings and investment series. The investment and savings ratios (to gross domestic product (GDP)) are non-stationary for almost all the countries considered. Therefore regression analyses using standard methods are likely to deliver biased estimates and incorrect inference. Moreover in order to exploit the cross-sectional variability of the series, panel time series techniques have been employed, with mixed results. In particular, the strong correlation between saving and investment may be tough as the reflection of the stationarity of the current account balance. A simple accounting may help illustrating the argument. Ignoring income from foreign assets, the current account balance is the difference between GDP and absorption (i.e; the sum of consumption and investment CA = Y − C − G − I (1) Saving is defined as the difference between GDP and consumption, therefore 9
CEPII, Working Paper No 2003 - 22
CA = S − I
(2)
The stationarity of the current account implies thus cointegration with a unit coefficient between total saving and total investment. Coakley Kulasi and Smith (1996) claim that the strong association between savings and investment ratio is nothing but a statistical artefact, a reflection of the external solvency constraint requiring the current account to be stationary in order for the external debt to be bounded. Therefore a high correlation between savings and investment correlation can be consistent with high capital mobility. They use a panel of 23 OECD countries for the 1960-92 period and a test due to Im, Pesaran and Shin (2002) to check that the current account to deficit ratio is indeed stationary in the panel: the hypothesis of non-stationary is strongly rejected. They then estimate an error correction equation of the form
∆ I it = α i + α t + β∆Sit + γ ( Sit − I it ) + ε it where
(3)
Sit and I it denote respectively total (public and private) savings and investment in
country i in period t . The relation given by (1) is derived by them from a simple model of investment and savings-determination. Savings can be invested at the world real rate, whereas investment is financed at the same rate plus a risk premium reflecting default risk, which is linearly dependent on the current account deficit. Therefore the level of the current account deficit will influence investment only. Another way of looking at the issue is to test whether savings and investment cointegrate. Jansen (2000) estimates equations such as (1) for 22 OECD countries using cross-section and panel methods, and testing indirectly for cointegration: if the loading coefficient γ is negative and significant, savings and investment rates cointegrate with a unit coefficient, and therefore the current account to GDP ratio is stationary4 . Jansen claims that using this method it is possible to distinguish between a measure of short run capital mobility (the parameter β in equation (3)), which is determined mainly by short run fluctuations and a long run measure (γ), determined by the external solvency constraint. A small coefficient for γ highlights a much smoother return to the equilibrium, implying weak constraints to capital inflows or outflows. Jansen finds that short-run and long-run retention coefficients demonstrate very different behaviour. The long-run correlation decreases smoothly over time, consistent with the notion of increased international capital mobility, whereas the association in the short run fluctuates a great deal both over time and across countries, without showing a clear pattern. Taylor (1996, 2002) applies a similar methodology to century-long series for 12 countries, using both regression and simulation techniques, and shows that the behaviour of the 4
Argimon and Roldàn (1994) perform cointegration tests on the two variables for a sample of European countries and find that the null hypothesis of no cointegration can be rejected in only a few cases.
10
A New Look at the Feldstein-Horioka Puzzle using an Integrated Panel
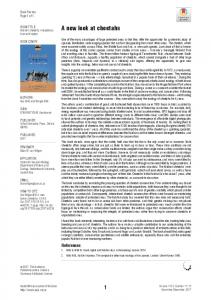
estimated parameters can be considered valid representations of underlying measures of capital mobility. In order to provide further evidence we estimated recursively equation (3) for a panel of European countries over the period 1970-2002. Figure 1 plots the coefficient β and γ . It is interesting to notice that, whereas short run correlation remains stable throughout the whole period (with a peak corresponding to the EMS crisis of the early 90s), long run association drops quickly starting from the mid-80, when most European countries fully liberalised their external accounts. Ho (2002a) applies fully modified and dynamic OLS estimators to a panel of 20 countries and shows that the acceptance or rejection of the cointegration between savings and investment depend critically on the estimation technique chosen. In a similar paper, the same author (Ho, 2002b), using a different database, applies the same methods and concludes that cointegration between the two variables is strongly rejected. All in all we can conclude that the application of panel and unit root techniques to savings and investment regressions delivers mixed results. When cointegration with a unit coefficient on the investment variable is measured indirectly, either by testing for the stationarity of the current account or the sign and significance of the loading coefficient in (3), it is not rejected. However, when cointegration is tested directly, i.e. by means of Johansen tests on saving and investment, it is normally rejected with a coefficient significantly lower than one, implying that the external budget constraint is not respected. We reconsider this evidence in the context of our dataset in Sections 4 to 6 below. The Feldstein-Horioka puzzle has been studied from another angle, one that requires the consideration of some disaggregate series. Summers (1988), for example, argues that the strong correlation can also be the result of specific governmental policies. The current account relationship can be written as:
CAt = S t − I t = SGt + SPt − IG t − IPt = ( SGt − IG t ) + ( SPt − IPt )
(4)
where “G” denotes government and “P” the private sector. The government may target the current account using fiscal policy, in order to have a government saving gap offsetting the public sector imbalances. Argimon and Roldàn (1994) inter alia test this hypothesis using cointegration and Granger causality tests, for some European countries, finding some evidence in favour of a long run relationship between the two gaps, but no conclusive evidence for causality. Cointegration between the two series can be also interpreted as evidence of Ricardian equivalence: private agents observe a budget deficit and foresee higher future taxes, and therefore increase their savings. In this paper we will perform cointegration tests on these series to determine whether the Summers (1988) hypothesis holds and, more generally, to see how the big fiscal retrenchment undertaken by many European countries in the run-up to ERM-III has influenced the gap between savings and investment.
11
CEPII, Working Paper No 2003 - 22
3.
UNIT ROOT AND COINTEGRATION TESTS
We begin by presenting the panel unit root and cointegration tests used in this paper. The country-by-country analyses reported below employ single equation unit root tests and Johansen (1995) maximum likelihood methods. Since both these latter techniques are well known, the details of their implementation are not presented in the paper but are assumed to be known by the readers. The panel methods are new enough to bear a brief repetition.
3.1.
Testing for unit roots in dynamic panels
Three panel unit root tests, proposed respectively by Levin and Lin (LL), Im Pesaran and Shin (IPS) and Maddala and Wu (MW), are used in the empirical analysis in our paper. Generally speaking, all the tests used are based on the following Dickey-Fuller (DF) regression (or in their augmented form (ADF) as in (4) below): ∆ yit = α i + δ i t + θ t + ρ i yit −1 + ζ it , i = 1, 2,.. N ; t = 1, 2,..., T , (5) which allows for fixed effects and unit-specific time trends. The error term is ζ it ~ IID ( 0, σ 2 ) and all models are based on the important assumption that E (ζ itζ js ) = 0, ∀ i ≠ j , s ≠ t , which implies effectively that the units of the panel are independent both in the short and in the long-run. In particular, the
yit series are not
allowed to be cointegrated with each other. When the units are interpreted as countries and the time series are macroeconomic variables such as those considered in this paper, the restriction implied by the assumption may turn out to be serious as we shall argue further below. The ‘independence’ assumption is frequently made after allowing for the common time effects θ t , which in practice can be concentrated out of the equation by taking deviations from cross-sectional means. For all tests, the null hypothesis of interest is of a unit root,
H 0 : ρ i = 0 ∀ i , but the tests allow different degrees of heterogeneity under the alternative hypothesis. 5
Levin and Lin (1992, 1993) consider an alternative hypothesis where the autoregressive coefficient is homogeneous across countries, i.e. H A : ρ i = ρ < 0 ∀ i . This imposes rather restrictive assumptions on the dynamics under the alternative hypothesis. They derive the asymptotic distributions of the panel estimator of ρ under different assumptions on the presence of fixed effects or also heterogeneous time trends. For example, if for fixed i , the errors are also assumed to be independent across the units of the sample,
αi = δi = 0 ∀ i
and there are no common time effects, then the asymptotic distributions of the ordinary least squares (OLS) pooled panel estimator and associated t-statistic have a Gaussian limiting distribution, after allowing for mean and variance adjustments, which are computed by Monte Carlo simulation and tabulated in their paper for three different specifications of the deterministic terms.
5
This research was published in updated form in Levin, Lin and Chu (2002). For convenience and ease of identification with the tests reported in the literature, we retain the references to the older papers.
12
A New Look at the Feldstein-Horioka Puzzle using an Integrated Panel
Following the critique of Pesaran and Smith (1995) on pooled panel estimators - such as those used by Levin and Lin (1992, 1993) - Im, Pesaran, and Shin (2002) extend the Levin and Lin framework to allow for heterogeneity in the value of ρ i under the alternative hypothesis. The alternative hypothesis for the IPS test is then specified as:
H A : ρ i < 0, i = 1, 2,... N1; ρ i = 0, i = N1 + 1,... N . IPS propose a group-mean t-bar statistic for ρ i = 0 based on the t-statistics
t i derived
from the N augmented Dickey-Fuller (ADF) regressions pi
∆ yit = α i + ρ i y it −1 + ∑ ∆ y it − j + ε it , t = 1,2,...T , j =1
(6)
The mean group estimator then yields the average t-statistic: N
Ψt = N −1 ∑ t i
(7)
j =1
adjusted for values of mean and variance obtainable by stochastic simulation, which are tabulated in the IPS paper using 50,000 replications for different values of T and pi . IPS show that under
H 0 : ρ i = 0 ∀ i , and after the above-mentioned mean and variance
adjustment: IPS t-bar =
Ψt − mu se
⇒ N (0, 1)
as N , T → ∞ , N / T → k ,
where k is a finite positive constant and mu and se are the corrections deriving from mean and variance adjustment. In an earlier version of their paper, IPS also propose the use of a group-mean Lagrange multiplier (LM) statistic, which is based on averaging the single-country LM -statistics for ρ i = 0 derived from (4). Allowing for mean and variance corrections provided by them, the convergence result stated for Ψ t holds also for Ψ LM , and consistency is guaranteed under the controlled rate of divergence of N and T to infinity. That is, defining: N
Ψ L M = N −1 ∑ LM i ,
(8)
j =1
Ψ L M − mulm selm
⇒ N ( 0, 1) as N, T
→∞
and mulm and selm are the corrections deriving from mean and variance adjustment for the LM-test.
13
CEPII, Working Paper No 2003 - 22
We shall refer to the two versions of the IPS test as IPS-t and IPS-LM and use them both in our empirical analysis. The assumption of independence across the units mentioned above is maintained within the IPS testing framework. Finally, Maddala and Wu, relying on Fisher (1932), suggest combining the p-values of a test-statistic for a unit root in each cross-sectional unit. The statistic is given by: N
MW :
− 2∑ ln π i ,
(9)
i =1
where
π i is the p-value of the test statistic in unit i, i.e. in this paper the p-value of the ADF
test statistic in each country, and is distributed as a χ 2 (2 N ) under the usual assumption of cross-sectional independence. The Fisher test is an exact and non-parametric test, and may be computed for any arbitrary choice of a test for the unit root in a cross-sectional unit. In this paper, however, we concentrate on the ADF test. The obvious simplicity of this test and its robustness to the choice of lag length and sample size make its use attractive.
3.2.
Testing for Cointegration in Dynamic Panels
In this section we describe the key features of the single-equation panel cointegration statistics developed by Pedroni (1999, 2000, 2001), to whom we refer the reader for additional details. The seven statistics we study and their computation are summarised in the appendix to this paper. The Pedroni cointegration tests are all single-equation methods based on estimating the static cointegrating regression given by
yit = α i + δ i t + z it ′ β i + eit , i = 1 , 2 ..., N ; t = 1, 2 ,...T ,
10)
where β i = ( β1i , β 2i ,... β ki ) ′ is the k -dimensional cointegrating vector (with the coefficient on
yit normalised to one and z it = ( z1t , z 2t ,... z kt ) is the vector of associated regressor (or
right-hand-side variables). The cointegrating rank in each unit, regardless of the number of regressors k, is either 0 or 1 with the unique cointegrating vector, if it exists, given by (1, − β ′ ) . i
Heterogeneity is permitted in the cointegrating relationships across the units of the panel (a feature which also applies to the deterministic terms unit by unit). The specification rules out all forms of cross-sectional dependence across the units (both in the short and in the long run) although a wide range of temporal dependence within each unit is allowed. In particular, no exogeneity restrictions are imposed on theregressors. These restrictions implicit within the Pedroni framework allow for the estimation of cointegrating relationships in large panels not permitted by more general maximum likelihood methods for panels (see for example Larsson and Lyhagen , 2000) due to degrees-of-freedom restrictions.
14
A New Look at the Feldstein-Horioka Puzzle using an Integrated Panel
The tests are constructed by using the estimated residuals
) eit from the cointegrating
regression (8) above. Pedroni proposes the use of seven panel cointegration statistics, four based on pooling along the within-dimension and three based on pooling along the between-dimension. Within the first category, three of the four tests use non-parametric corrections, the fourth is a parametric ADF test. In the second category, two use nonparametric corrections, the third is again an ADF test. Denoting the autoregressive coefficient of the residuals in the i-th unit by γ i , the within-dimension tests impose a common coefficient under the alternative hypothesis:
H 0 : γ = 1, H A : γ i = γ < 1 while the between-dimension tests allow for heterogeneous coefficients under
HA:
H 0 : γ = 1, H A : γ i < 1 In order to obtain statistics suitable for making inference, standardizations based on the vector of Brownian motion functionals are required. The standardized statistics tend in distribution to the normal density under the null hypothesis. Pedroni (1999) tabulates the required moments for the standard-ization by simulation, for different specifications of deterministics included in the models and dimension of k. We shall report the results of all seven tests for the cointegration analysis on our empirical dataset.
4.
EMPIRICAL ANALYSIS
4.1
The dataset and some preliminary considerations
The data are taken from the European Commision’s Annual Macroeocomic Database of the Directorate General for Economic and Financial Affairs (AMECO), that combines data obtained from national sources as well as from the IMF and OECD. The starting date for these series is mainly 1960 (until 2002) measured at an annual frequency. For some countries and for some series, the starting date available is later than 1960 and is noted in the relevant sections of Tables 1 and 2. 6 We consider the following series as the focus of our investigation: Primary series STY: total (private and public) savings to GDP ratio ITY: total (private and public) investment to GDP ratio SGY: government savings to GDP ratio SPY: private savings to GDP ratio
6
In order to account for german unification a dummy for 1991 has been included in all the regressions.
15
CEPII, Working Paper No 2003 - 22
IGY: government investment to GDP ratio IPY: private investment to GDP ratio Derived series 7
CA: current account balance, defined as difference between STY and ITY
GGAP: government savings gap, defined as the difference between SGY and IGY PGAP: private sector savings gap, defined as the difference between SPY and IPY Each of these series (for each of the countries) is tested for a unit root using the routine ADF test with automatic lag length selection. The countries are next considered as a whole in a panel8 and the series are tested for integration using the IPS, LL and MW tests. In a second step we look for cointegration between the following pairs of series: ITY and STY, to check if the external solvency constraint is respected; IGY and SGY, to check if the government intertemporal budget constraint holds; IPY and SPY, to check if it holds for the private sector; GGAP and PGAP, to look for evidence of current account targeting or Ricardian Equivalence. In common with the methodology for testing for integration, we first test for cointegration on a country-by-country basis, employing the Johansen (1995) maximum likelihood (ML) test, we then consider the panel of countries and use the Pedroni panel tests for cointegration. The key features to note in considering the results of the tests for unit roots and cointegration, country-by-country and in panels, are (a) the differences in the results if any between the two methodologies; (b) to attempt to understand the reasons for the differences; and (c) to discover if the findings for unit roots for series such as CA, GGAP and PGAP are consistent with the cointegration results for ITY and STY, IGY and SGY and IPY and SPY respectively.
7
The series for the current account balance obtained in this way sometimes does not correspond exactly to the reported data on current account for the early years of the sample. We decided nevertheless to analyse the features of the constructed current account series since these are the best consistent series available to us. 8
Sensitivity analyses with sub-groups of countries of the panel are reported in Section 6 of this paper. For now our attention is on panels composed of all the countries available; where the aim of the panel tests is to utilise for each series (for unit root tests) or for each pair of series (for the cointegration tests) as lengthy a balanced panel as possible.
16
A New Look at the Feldstein-Horioka Puzzle using an Integrated Panel
4.2
Results of unit root tests
The results of the tests for unit roots are reported in Table 1. For each data series, the country-by-country results (p-values) are accompanied by the results of the four unit-root tests in panels, for the longest available balanced panel. A p-value of less than 0.05 indicates rejection of the unit root null hypothesis at a 5% confidence level. Looking first at the evidence of the country-by-country tests, total savings appear to be I(1) in all the countries except for Portugal and, to a lesser degree, Finland. This is broadly consistent with the results obtained by previous studies. Considering private and government savings separately, our findings change only slightly for government savings for which the null of a unit root is accepted comfortably for all countries except for Spain and (although less so) Sweden. The picture for private savings is more mixed: the unit root null is rejected for Spain and United Kingdom, and marginally rejected for Ireland and Netherlands. Countries such as Denmark, Germany and Sweden also veer towards rejection, although for Germany one should bear in mind the impact of reunification and for Sweden the relatively short time span is likely to be an issue. Total investment is seen to be I(1) based on the country-by-country tests for all countries except Portugal and Spain. Considering private investment, the unit root hypothesis is rejected for UK, and Portugal only. Finally government investment appears to be stationary in France and Sweden only. Looking at the current account, defined as the difference between savings and investment, the null hypothesis is rejected for six of the fourteen countries considered. The null hypothesis is rejected for the government savings gap series, defined as the difference between government savings and investment, by Sweden and UK only. For the private sector gap however, the null hypothesis is rejected for six out of the fourteen countries. This suggests that the finding of stationarity of the current account may in part be driven by the stationarity of the private sector gap (thereby arguing against the ability of private agents to finance investment by borrowing freely on capital markets). Failure to reject the 5. null for the government sector gap is indicative of governments’ ability to run deficits more easily than private individuals. These findings lead to the following tentative conclusions: (a)
broadly speaking, the aggregate and disaggregate series for savings and investment accept the null hypothesis of a unit root. This justifies the use of unit root and cointegration analysis for these series.
(b)
the null hypothesis of a unit root in the current account and in the private saving gap is rejected by a large number of countries in the group. This result reaffirms the potential existence of a puzzle, and suggests that it is important to look at the disaggregate series when considering issues relating to the Feldstein-Horioka hypothesis. It also indicates the necessity of taking a closer look using panel tests for unit roots.
(c)
we are also led to expect that the null hypothesis of no cointegration should be rejected when looking at cointegration between STY and ITY and SPY and IPY. 17
CEPII, Working Paper No 2003 - 22
Turning to the results from the panel unit root tests, three of the four tests accept the null of a unit root strongly for total savings. For private savings, only the LL test accepts the null of a unit root. Results reported in Banerjee, Marcellino and Osbat (2003b) indicate that the LL test is likely to be the least distorted by the presence of cross-unit (country) cointegration and could be relied upon the most for correct inference on the presence or absence of a unit root within a unit. As we report below, cross-country cointegration for the private savings series is likely to be an issue and is likely to lead to distorted results for the IPS and MW tests. Similar conclusions can be drawn for the government savings series. The finding of a unit root for government investment is sustainable using panel unit root tests, as is the potential stationarity of the current account and private savings series. The latter result has been noted as an important finding above. The most significant divergences between the results derived from country-by-country testing and from the panel come for the total investment series, the private investment series and the government saving gap series where the ADF results country-by-country are contradicted strongly by the panel tests. Whereas in the country by country test, the unit root hypothesis is accepted in most cases, panel tests tend to reject it. These series appear to comprise important examples of where cross-unit cointegration is an issue and needs to be tested. These will also feature in some of the sensitivity analysis when we consider whether the integration results are being driven by groups of countries.
4.3
Results of cointegration tests
The country-by-country tests for cointegration between total savings and total investment broadly confirm the results on the unit root tests for the current account – with seven out of the fourteen countries tested rejecting the null hypothesis of no cointegration. Five of the seven panel unit root tests reject the null hypothesis. The results for government savings and government investment show, both in the countryby-country and panel versions, evidence in favour of the ability of governments to remain insolvent even in the long run. The absence of cointegration between these two series, reflects the unit root which appears to be present in the government savings gap as reported in the previous section (although the evidence from the panel unit root tests stand in contradiction to these findings and must be reconciled, possibly based on looking at crosscountry cointegration for the government savings gap series for these countries). The most surprising feature of the cointegration results however, is the strong acceptance by the panel unit root tests of the null of no cointegration between private saving and private investment, when five out of the thirteen countries appear to reject the null of no cointegration and there was in addition strong evidence of stationarity from both the country-by-country ADF tests and the panel tests for the private savings gap series. Since if anything panel tests are prone to over-rejection in the presence of cross-unit cointegration , this is a puzzling finding which may be reconciled with the evidence from unit root tests not by looking at cross-unit correlation but as part of a sensitivity analysis by looking at sub-groups of countries in the panel.
18
A New Look at the Feldstein-Horioka Puzzle using an Integrated Panel
There is little evidence of cointegration between the private gap and the government gap, and thus based on this paper little evidence to support current account targeting or Ricardian Equivalence
5.
INTERPRETING THE COINTEGRATION
RESULTS :
HOW
IMPORTANT
IS
CROSS -UNIT
Banerjee Marcellino and Osbat (2003a, b) show that one of the crucial assumption underlying all the tests of panel cointegration, namely the absence of cointegration across the units of the sample is likely to be violated in many macroeconomic time series. Therefore, any “automatic” application of this test (i.e. without pre-testing for cross unit cointegration) might lead to wrong inference and conclusion. Based on the evidence of the previous section, we argue that this can be also the case of Feldstein- Horioka regressions. To recall, we wish to look more closely at the following findings reported in Section 4: (a)
the divergences between the results of the unit root tests derived from country-bycountry testing and for the panel for (I) the total investment series, (II) the private investment series and (III) the government savings gap series where the ADF results (of the existence of unit roots) country-by-country are strongly contradicted by the panel tests.
(b)
the puzzling result from the cointegration analysis on the private solvency condition.
In order to account for the difference in (a)–I, we use Johansen maximum likelihood methodology in order to look for cross-country cointegration in the total investment series. Such a finding can be explained by the existence of common investment cycles across countries. The results are reported in Table 3 where we find several instances of cross-country cointegration of the total investment series. Many of the long-run relations reported in this table for the total investment series have intuitive economic explanations related to the large similarity in business cycle in core EU countries due to the high degree of economic integration. Since private investment is a component of total investment, the divergence highlighted as (a)-II may be offered a similar explanation, i.e the cross-country cointegration in the total investment series is driven at least in part by the cross-country cointegration in the private investment series. The critique offered by Banerjee, Marcellino and Osbat therefore also applies here. A related problem occurs if we consider the government savings gap, and in particular the series for government savings. It is not stationary for most of the countries, but it is so when the whole panel is considered. Once again we check for cross-country cointegration. The results reported in the second panel of Table 3 again show a fairly high degree of cointegration.
19
CEPII, Working Paper No 2003 - 22
9
One possible economic interpretation for this finding is the fact that most during the last decades the European countries’ cycles have become more synchronised. Therefore, given the big part automatic stabilisers’ play in government balances10 , a natural consequence is that government saving are increasingly correlated across countries. Another, somahow weaker explanation is related to the fact that before the euro EU countries pegged their currency to the Deutsche mark in one way or another. They were thus obliged to keep their fiscal deficit in check (i.e. not too distant with respect to the German one) in order for the domestic interest rates not to diverge too much. A possible explanation is that public investment being more difficult to trim, the bulk of the adjustment fell on expenditure and revenue, and, by construction, on savings. Result (a)-III is thus also reconciled with the evidence. Taken together, (a)-I to (a)-III show the importance of taking cross-country cointegration into account when applying panel methods to saving-investment regressions. We leave an explanation of (b) to the next section, where other sensitivity analysis is also reported.
6.
SENSITIVITY ANALYSIS
To start with (b), we return to a consideration of the unit root tests for the private saving gap series, where some of the country-by-country evidence and the panel tests support socalled intertemporal private solvency. The clue to the puzzle lies in considering the countries for which the unit root tests accept the null hypothesis. These include some of the key countries in the EU, and a tentative suggestion that can be made is to re-run the panel unit root tests but to do so over sub-groups of countries. For example, when the panel is partitioned into Group A consisting of Austria, Belgium, Denmark, Finland, France, Greece, Italy and the Netherlands and Group B consisting of Germany, Ireland, Portugal, Spain, Sweden and the United Kingdom, the results now indicate acceptance by three of the four panel tests (in particular acceptance with a p-value of 0.20 for the Levin and Lin test) of the unit root null for Group A and strong rejection of the null for Group B. Re-running the panel cointegration tests of private savings on private investment for roughly this partition (with France again in the Group A countries and Germany in the Group B countries) shows acceptance of the null hypothesis of no cointegration (i.e. private insolvency or equivalently a unit root in the private savings gap) for the Group A countries and rejection of the null by five of the seven tests for the Group B countries. This evidence is thus perfectly consistent with our conclusion that it is important to pay attention to subgroups of countries, with private solvency not being a universal phenomenon but applying to some groups of countries and not to others. When considered in sub-panels, the results of the unit-root tests country-by-country are seen to be consistent with the results from the panel tests. When the panel is considered as a whole, the heterogeneity in the panel (insufficiently controlled by the inclusion of country-specific fixed effects and common time-effects) may lead to puzzling results. A similar sensitivity analysis, applied to the current account deficit, demonstrates the same effects for the aggregate series with the finding of cointegration between savings and 9
We thank Agnès Benassy for suggesting this interpretation. 10
See for example van der Noord (2000).
20
A New Look at the Feldstein-Horioka Puzzle using an Integrated Panel
investment being affected by the choice of the groups of countries. The unit root tests in panels however are more robust in rejecting the unit root hypothesis for various sub-groups, suggesting the potentially strong influence of cross-country cointegration of the component series on the properties of the panel tests.
7.
THE EVIDENCE FROM THE BAI AND NG FACTOR TESTS
Many of the issues discussed above, and analysed by means of sensitivity analyses, can perhaps be decided more definitively if the panel tests used could account successfully for cross-country cointegration. Such a class of tests is now available from Bai and Ng (2003). The basic idea consists of thinking of the series comprising the panel as consisting of the sum of a set of common factors and idiosyncratic components. Both the factors and the idiosyncratic components can be integrated or stationary. The existence of one (or more) integrated factors, common to all units of the panel, is what allows this test to account for the possible presence of cointegrating relationships (as exemplified by the common factors or common driving trends) across the units. The heart of the test therefore consists of making the decomposition (between common factors and idiosyncratic terms) and then testing each of these components for a unit root. Thus, letting
X it = ci + λi 'Ft + eit , t = 1, 2,... T i = 1, 2,.. N
Ft is an r × 1 vector of ‘factors’ common to all the units (assuming that we allow for a maximum number r of factors), where
∆ X it = λ i' ft + z it t = 2,3,...T i = 1, 2,.. N where
ft = ∆Ft , t = 2,...T and
zit = ∆eit t = 2,...T . i = 1,2,.. N Next, defining
21
CEPII, Working Paper No 2003 - 22
X = ( X1 , X 2 ,... X n ) as X i = ( X i1, X i 2 ,... X iT )' )
the
T×N
matrix
of
all
observations
(where
and
x = ∆X = ( ∆X 2 , ∆X 3 ...X n ) as the corresponding (T − 1) × N matrix of first differences, the principal component estimator of f = ( f2 , f3 ,... fT )' , denoted
fˆ , is T − 1 times the r
largest eigenvectors corresponding to the r largest eigenvalues of the (T − 1) × (T − 1) matrix xx' . The estimated factors can now be recovered by summation: t
Fˆt = ∑ ˆfs , t = 2,...T s= 2
and tested for unit roots. Similarly t
eˆit = ∑ ∆zˆi s , i = 1,2... N s =2
and these too can be tested for unit roots. It is sufficient that at least one of the common factors has a unit root for all of the X it series to have a unit root. The integration properties of the idiosyncratic components however feed uniquely into each series (i.e. has a unit root if and only if
X it
e it has a unit root (if the common factors are all stationary).11
It is interesting to note that implementing these tests typically tend to confirm the postulated role of cross-unit cointegration relationships described in detail above. That is, for panels which display strong evidence of cross-unit cointegration, the Bai and Ng tests (by taking account of the common components driving these series) accept the null of a unit root in the factors – leading us to conclude in favour of I (1) in the series. Table 4 provides the results for each of the primary and derived series, when the Bai and Ng test is implemented (with six factors allowed, denoted Factor 1 to Factor 6, decreasing in order of importance). Each of the six factors is tested using an augmented Dickey-Fuller test (with a constant and automatic lag selection) for which the critical value is –2.86 for a 5% tests. It may be seen that in all cases the unit root hypothesis is accepted comfortably – i.e. there exists at least one factor for which the null of a unit root is accepted comfortably. This is in contrast with the evidence from the panel tests which by not taking account of cross-unit cointegration over-reject the null of a unit root. This finding taken with the others described above, leads to a consistent diagnosis of the integration properties of the
11
Further refinements of the Bai and Ng test are possble to allow for deterministic trend components instead of only a constant and to base tests that are more synthesised, in the sense of looking for independent stochastic trends underlying the common factors. We refer the reader to Bai and Ng (2003) for further details.
22
A New Look at the Feldstein-Horioka Puzzle using an Integrated Panel
component series and emphasise the role of cross-unit cointegration in determining the relevance of the Feldstein-Horioka puzzle 12 .
8.
CONCLUSION
All the results taken together, we emphasize the need when testing for intertemporal solvency of considering closely the sensitivity of the results to looking at groups of countries and to the possibility of cross-unit cointegration. A broad-brush set of conclusions (reconciling the evidence from the country-by-country tests and the panel analysis) would appear to suggest: (a)
the existence of a unit root in the current account at least for a number of countries in the panel, but the stationarity of the current account for a number of others. The results of the panel tests, which provide evidence in favour of stationarity, may in part be due to the presence of cross-country cointegration in the investment series. Once the existence of cross country cointegration is accounted for properly, the evidence thend to favour the existence of unit roots. Therefore we do not believe that the re-finding of the Feldstein-Horioka puzzle in most of the panel-based tests is merely a statistical artefact. Earlier results in the literature on cointegration should therefore be reconsidered and it may be better to look at the disaggregated series and the evidence from country-by-country13 and sub-group analysis;
(b)
once the influence of cross-country cointegration in government savings is taken into account, the evidence would broadly appear to support the finding of intertemporal insolvency of the government account;
(c)
the evidence of intertemporal solvency of the private account is more difficult to interpret, but sensitivity analysis indicates the need to consider the issue in a country-specific or group-of-countries-specific manner;
(d)
When the Bai and Ng panel tests for unit roots and cointegration are run, to take account of cross-country cointegration and short-run correlations across countries, the findings are generally more ambiguous and provide more evidence in favour of integration in the data series.
12
In order to save space details on the results of the Bai test are not shown, however they are available from the authors on request. 13
See for example Sarno and Taylor (1998) on the United Kingdom and Özmen and Parmaksiz (2003) for France.
23
CEPII, Working Paper No 2003 - 22
Appendix: Pedroni panel cointegration tests Panel Cointegration Statistics (Pedroni (1999)) 1. Panel v-statistic : 2
T N
3
≡T N 2
2Z
3
v^ N , T
2. Panel ρ-statistics:
TN
1
≡ TN
2Z v ^ N ,T
1
N T ^T ^2 ∑ ∑ L 1, l, i ei, t −1 i =1 t =1
^ ^ N T ^ T ^ ∑ ∑ L1, l ,i ei , t −1 ∆ ei , t −1− λi i =1t =1
N
T ^ T ^2 L1, l , i e i , t −1 i =1t =1
2
−1
2
∑∑
−1
3. Panel t-statistics (non parametric): 1
2 ^^ ^2 N T * Z tN ,T ≡ σ N , T ∑ i=1 ∑ t =1 L ei, t −1 4. Panel t- statistics (parametic): * 2 2 ~ ^ ^ N T Z *tTnN ≡ s N ,T ∑ i =1 ∑ t =1 L ei , t −1 5. Group ρ-statistics:
1
2
N T ^T ^ ^ ^ ∑ ∑ L 1,l , i e i,t −1 ∆ ei, t −1 − λi i=1 t =1
2
− 2 * * ^ N T ^ ^ ∑ i =1 ∑ t =1 L1l ,i ei , t −1 ∆ ei , t −1 −1
2 T ^2 ^ ^ T ^ −7 ~ ^ −1 N 2 2 TN Z ρ NT −1 ≡ TN ∑ ∑ e i, t −1 ∑ ei, t −1 ∆ e i, t −1 − λi t =1 i =1 t =1 6. Group t-statistics (non parametric):
2 ^ T 2 t N ,T ≡ ∑ σ i ∑ êi,t−1 i =1 t=1 7. Group t-statistics (parametric): −1 ~ N 2Z
−1
−1 N N 2
2
^ ^ ^ ∑ e i,t−1 ∆ e i,t−1 − λi t =1 T
−1
N
−1
~* 2Z t N ,T
*2 * 2 −1 N T ^ ^ ≡ N 2 ∑ ∑ s i ei , t −1 i =1 t =1
2 T ^*
^*
∑ ei, t −1 ∆ ei, t −1
t =1
24
A New Look at the Feldstein-Horioka Puzzle using an Integrated Panel
where êi,t is the OLS residual from equation (8) and: ^
λi =
^2
s =
^ ^ 1 ki s T ∑ t = s+1 µ i ,t µ î , t − s ∑ s =11 − T k +1
1 T
~2 σ N ,T
T ^2
∑µ t =1
^2 i, t σ i
^2
−2
^
=
1 N ^ ∑ L 1,l ,i σ i2 N i =1
=
1 N
∑ µ i,t
L1li =
1 T
∑ η i,t +
^ *2 si
^
^
= si + 2 λi
N ^ *2
i =1
T ^2
t =1
2 T
s =1 ki
∑ 1 −
2 T ^ ^ ∑µ µ k + 1 t = s +1 i , t i , t − s
and the residuals µi,t µ*i,t ηi,t are calculated from the following regressions respectively: ^
^
êit = µ i êi ,t −1 + µi ,t Ki ^
^
^
êi, t = γ î êi, t −1 + ∑ γ ik ∆êi, t −k + µi, t k =1
M ^
^
∆ yi , t = ∑ bmi ∆xi ,t + µî ,t m =1
25
CEPII, Working Paper No 2003 - 22
Figure 1: Recursive estimates of short (beta) and long (gamma) run saving-investment correlation Short run and long run S-I association 0.3
0.28
0.26
0.24
0.22
0.2
0.18
beta
gamma
0.16
19 75 19 76 19 77 19 78 19 79 19 80 19 81 19 82 19 83 19 84 19 85 19 86 19 87 19 88 19 89 19 90 19 91 19 92 19 93 19 94 19 95 19 96 19 97 19 98 19 99 20 00 20 01 20 02
0.14
26
A New Look at the Feldstein-Horioka Puzzle using an Integrated Panel
Table 1: Unit Root Tests The country by country analysis is done with an Augmented Dickey Fuller test with authomatic lag selection. * indicates acceptance at more than 10% ** indicates acceptance between 5 and 10% ** indicates acceptance at less than 5%
Total Saving to GDP Ratio Country Austria Belgium Denmark Finland France Germany Greece Ireland Italy Netherlands Portugal Spain Swedwen United Kingdom
Test * * * *** * * * * * * rejected * ** *
p-value 0.712 0.42 0.329 0.037 0.559 0.402 0.34 0.424 0.58 0.419 0.001 0.15 0.068 0.659
Start date 1960 1960 1960 1960 1960 1960 1960 1960 1960 1960 1960 1960 1960 1960
Panel test (p-values) IPS tbar 0.13 IPS LM 0.02 LL 0.19 MW 0.1
p-value 0.13 0.24 0.066 0.088 0.167 0.051 0.235 0.019 0.789 0.036 0.053 0.004 0.065 0.006
Start date 1960 1960 1960 1960 1960 1960 1960 1960 1960 1960 1960 1970 1972 1960
Panel test (p-values) IPS tbar 0.03 IPS LM 0.007 LL 0.2 MW 0.02 .
Private Saving to GDP Ratio Country Austria Belgium Denmark Finland France Germany Greece Ireland Italy Netherlands Portugal Spain Swedwen United Kingdom
Test * * ** ** * ** * *** * *** ** rejected ** rejected
27
CEPII, Working Paper No 2003 - 22
Government Saving to GDP Ratio Country Austria Belgium Denmark Finland France Germany Greece Ireland Italy Netherlands Portugal Spain Swedwen United Kingdom
Test * * * * * * * * * * * rejected *** *
p-value 0.554 0.32 0.264 0.154 0.608 0.39 0.67 0.776 0.502 0.397 0.399 0.008 0.029 0.107
Start date 1960 1960 1960 1960 1960 1960 1960 1960 1960 1960 1960 1970 1970 1962
Panel test (p-values) IPS tbar 0.03 IPS LM 0.02 LL 0.55 MW 0
p-value 0.577 0.666 0.584 0.252 0.675 0.474 0.218 0.24 0.553 0.707 0.016 0.049 0.514 0.181
Start date 1960 1960 1960 1960 1960 1960 1960 1960 1960 1960 1960 1960 1960 1960
Panel test (p-values) IPS tbar 0.03 IPS LM 0.007 LL 0.21 MW 0.02
p-value 0.149 0.251 0.153 0.167 0.428 0.186
Start date 1960 1970 1976 1960 1970 1960
Panel test (p-values) IPS tbar IPS LM LL MW
0.14 0.645 0.191 0.028 0.386 0.081 0.015
1974 1970 1970 1960 1970 1970 1960
Total Investment to GDP Ratio Country Austria Belgium Denmark Finland France Germany Greece Ireland Italy Netherlands Portugal Spain Swedwen United Kingdom
Test * * * * * * * * * * *** *** * *
Private Investment to GDP Ratio Country Test Austria * Belgium * Denmark * Finland * France * Germany * Greece non available Ireland * Italy * Netherlands * Portugal *** Spain * Swedwen ** United Kingdom ***
28
0.03 0.01 0.03 0.02
A New Look at the Feldstein-Horioka Puzzle using an Integrated Panel
Government Investment to GDP Ratio Country Test Austria * Belgium * Denmark * Finland * France *** Germany * Greece non available Ireland * Italy * Netherlands ** Portugal * Spain * Swedwen *** United Kingdom *
p-value 0.999 0.623 0.113 0.491 0.03 0.943
Start date 1960 1970 1970 1960 1970 1960
Panel test (p-values) IPS tbar 0.2 IPS LM 0.16 LL 0.3 MW 0.15
0.526 0.77 0.058 0.499 0.531 0.015 0.936
1974 1970 1970 1960 1970 1970 1960
p-value 0.064 0.803 0.367 0.632 0.217 0.038 0.051 0.448 0.047 0.51 0.015 0 0.534 0.036
Start date 1960 1960 1960 1960 1960 1960 1960 1960 1960 1960 1960 1960 1964 1960
Panel test (p-values) IPS tbar IPS LM LL MW
p-value 0.128 0.83 0.938 0.114 0.322 0.076
Start date 1960 1970 1970 1960 1970 1960
Panel test (p-values) IPS tbar 0 IPS LM 0 LL 0.08 MW 0
0.869 0.623 0.401 0.487 0.356 0.011 0.0134
1974 1970 1970 1960 1970 1970 1962
Current account to GDP Ratio Country Austria Belgium Denmark Finland France Germany Greece Ireland Italy Netherlands Portugal Spain Swedwen United Kingdom
Test ** * * * * *** ** * *** * *** rejected * ***
0.06 0.01 0.04 0.05
Government Saving Gap to GDP Ratio Country Test Austria * Belgium * Denmark * Finland * France * Germany ** Greece not available Ireland * Italy * Netherlands * Portugal * Spain * Swedwen *** United Kingdom ***
29
CEPII, Working Paper No 2003 - 22
Government Saving Gap to GDP Ratio Country Test Austria * Belgium * Denmark * Finland * France * Germany ** Greece not available Ireland * Italy * Netherlands * Portugal * Spain * Swedwen *** United Kingdom ***
p-value 0.128 0.83 0.938 0.114 0.322 0.076
Start date 1960 1970 1970 1960 1970 1960
0.869 0.623 0.401 0.487 0.356 0.011 0.0134
1974 1970 1970 1960 1970 1970 1962
Panel test (p-values) IPS tbar 0 IPS LM 0 LL 0.08 MW 0
Private Saving Gap to GDP Ratio Country Test Austria * Belgium * Denmark * Finland * France * Germany rejected Greece not available Ireland ** Italy * Netherlands * Portugal ** Spain ** Swedwen ** United Kingdom rejected
p-value 0.332 0.486 0.171 0.298 0.635 0.003
Start date 1960 1970 1970 1962 1970 1960
0.073 0.794 0.596 0.1 0.083 0.082 0.002
1975 1970 1970 1960 1973 1972 1960
30
Panel test (p-values) IPS tbar 0 IPS LM 0 LL 0.02 MW 0
A New Look at the Feldstein-Horioka Puzzle using an Integrated Panel
Table 2: Johansen and Pedroni cointegration tests
Total Saving and Total Investment Number of Cointegrating Relations at the 5% level: trace test (in bracket the result form the Max-Eigenvalue test if it differs) model with intercept only Country Start date Pedroni test (p-value) Austria 0 1960 v test 0.003 Belgium 0 1960 rho test 0.031 Denmark 0 1960 non par t 0.036 Finland 0 1960 par t 0.01 France 0 1960 group rho 0.325 Germany 0(1)* 1960 non par group t 0.161 Greece 1 1960 par group t 0.037 Ireland 0 1960 Italy 0 1960 Netherlands 0 1960 Portugal 2* 1960 Spain 1** 1960 Swedwen 0 1960 United Kingdom 0 1960 * Saving is nearly I(0) ** Investment is nearly I(0)
Government Saving and Government Investment Number of Cointegrating Relations at the 5% level: trace test (in bracket the result form the Max-Eigenvalue test if it differs) model with intercept only Country Start date Pedroni test (p-value) Austria 0 1960 Panel Belgium 0 1970 v test Denmark 0 1971 rho test Finland 0 1960 non par t France 0 1970 par t Germany 1 1960 group rho Greece not available non par group t Ireland 0 1974 par group t Italy 1 1970 Netherlands 1 1970 Portugal 0 1960 Spain 0 1970 Swedwen 0 1970 United Kingdom 1 1960
31
0.092 0.426 0.435 0.264 0.735 0.628 0.321
CEPII, Working Paper No 2003 - 22
Private Saving and Private Investment Number of Cointegrating Relations at the 5% level: trace test (in bracket the result form the Max-Eigenvalue test if it differs) model with intercept only Country Start date Pedroni test (p-value) Austria 0 1960 Panel Belgium 0 1970 v test Denmark 1 1971 rho test Finland 0 1960 non par t France 0 1970 par t Germany 1 1960 group rho Greece not available non par group t Ireland 1 1974 par group t Italy 0 1970 Netherlands 0 1969 Portugal 0 1960 Spain 1 1970 Swedwen 0 1970 United Kingdom 2* 1960 * Saving is I(0) and investment almost so
Private Gap and Government Gap Number of Cointegrating Relations at the 5% level: trace test (in bracket the result form the Max-Eigenvalue test if it differs) model with intercept only Country Start date Pedroni test (p-value) Austria 0 1960 Panel Belgium 0 1960 v test Denmark 0 1971 rho test Finland 0 1960 non par t France 0 1970 par t Germany 1(0)* 1960 group rho Greece not available non par group t Ireland 0 1974 par group t Italy 0 1970 Netherlands 0 1969 Portugal 0 1960 Spain 0 1970 Swedwen 0 1970 United Kingdom 2** 1960 * Private saving gap is I(0) ** Private and government saving gap are almost I(0)
32
0.086 0.567 0.635 0.527 0.747 0.728 0.452
0.235 0.742 0.788 0.635 0.944 0.943 0.78
A New Look at the Feldstein-Horioka Puzzle using an Integrated Panel
Table 3: (PANEL A) Cross-Country Cointegration in Total Investment Series
Greece and Spain ITY_GRC ITY_SPA LR test (pvalue)
alpha -0.422 0
t-stat -3.681
beta 1 -1.116
t-stat -2.331
0.99
Belgium and Germany alpha ITY_BEL -0.198 ITY_GER 0 LR test (pvalue) Belgium and France alpha ITY_BEL -0.416 ITY_FRA 0 LR test (pvalue)
t-stat -3.179
beta 1 -0.567
t-stat -1.799
0.05
t-stat -5.597
beta 1 -0.493
t-stat -4.011
0.062
Italy and France ITY_ITA ITY_FRA LR test (pvalue)
alpha -0.382 0
t-stat -4.219
beta 1 -1
t-stat
beta 1 -1
t-stat
beta 1 -0.196 -0.357
t-stat
0.097
Italy and Belgium ITY_ITA ITY_BEL LR test (pvalue)
alpha -0.382 0
Spain Belgium and Italy alpha ITY_SPA -0.533 ITY_ITA 0 ITY_BEL 0 LR test (pvalue)
t-stat -4.219 0.374
t-stat -2.677
0.228
33
-2.032 -2.677
CEPII, Working Paper No 2003 - 22
Table 3: (PANEL B) Cross-country cointegration in Government Savings Series Belgium and Italy SGY_BEL SGY_ITA LR test (pvalue)
alpha -0.269 0
t-stat -4.855
beta 1 -1
t-stat
beta 1 -1
t-stat
beta 1 -1
t-stat
beta 1 -1
t-stat
beta 1 -0.683
t-stat
0.258
Denmark and France alpha SGY_DNK -0.406 SGY_FRA 0 LR test (pvalue)
t-stat -3.057 0.228
Denmark and UK SGY_DNK Sgy_GBR LR test (pvalue)
alpha -0.361 0
Denmark and Netherlands alpha SGY_DNK -0.41 SGY_NLD 0 LR test (pvalue) Spain and Germany alpha SGY_SPA -0.345 SGY_GER 0 LR test (pvalue) France and Germany alpha SGY_FRA -0.343 SGY_GER 0 LR test (pvalue) Austria and Germany alpha SGY_AUT -0.339 SGY_GER 0 LR test (pvalue) Swedwen and Germany alpha SGY_SWE -0.331 SGY_GER LR test (pvalue)
t-stat -3.057 0.143
t-stat -3.539 0.29
t-stat -3.798
-2.303
0.98
t-stat -3.318
beta 1 -1
t-stat
beta 1 -1
t-stat
beta 1 -1
t-stat
0.073
t-stat -2.442 0.129
t-stat -2.01 0.69
34
A New Look at the Feldstein-Horioka Puzzle using an Integrated Panel
Table 4: Integration Properties of the Common Factors
Series
Factor 1
Factor 2
Factor 3
Factor 4
Factor 5
Factor 6
STY
-2.111
-1.844
-1.612
-1.142
-2.542
-1.972
SPY
-2.290
-1.404
-1.327
-1.670
-1.308
-0.804
SGY
-1.965
-0.770
-2.664
-1.791
-1.741
-1.882
ITY
-0.827
-1.979
-2.004
-2.107
-2.097
-1.786
IPY*
-1.870
-2.948
-2.233
-2.182
-1.116
-2.702
IGY*
-2.540
-3.038
-3.255
-1.960
0.760
-1.597
CA
-1.987
-3.072
-1.677
-0.687
-2.277
-1.053
GGAP*
-3.595
-0.701
-2.192
-2.954
-1.128
-2.110
PGAP*
-1.866
-3.560
-1.734
-1.457
-2.042
-1.831
Note: Each entry of the table gives the value of the ADF t-statistic. * indicates that Greece was not included in the panel.
35
CEPII, Working Paper No 2003 - 22
BIBLIOGRAPHY
Argimon and Roldàn (1994). «Saving, Investment and International Capital Mobility in EC Countries», European Economic Review, 38, 59-67. Bai, J. and Ng,. S. (2003). « A PANIC Attack on Unit Roots and Cointegration », forthcoming Econometrica. Banerjee, A., Marcellino, M. and Osbat, C. (2003a). «Some Cautions on the Use of Panel Methods for Integrated Series of Macro-Economic Data», (previous version issued as IGIER Working Paper 170). Banerjee, A., Marcellino, M. and Osbat, C. (2003b). «Testing for PPP: Should We Use Panel Methods? », mimeo., Department of Economics, European University Institute. Blanchard, O. and Giavazzi, F. (2002). «Current Account Deficits in the Euro Area : The End of the Feldstein-Horioka Puzzle?», Brookings Papers on Economic Activity, 2, 147-186. Chang, Y. (2003). «Panel Unit Root Tests in the Presence of Cross-sectional Dependency and Heterogeneity», mimeo., Rice University, Texas. Coakley, J., Kulasi, F. and Smith, R (1996). «Current Account Solvency and the FeldsteinHorioka Puzzle», Economic Journal, 106, 620-627. Coakley, J., Kulasi, F. and Smith, R. (1998). «The Feldstein-Horioka Puzzle and Capital Mobility : a Review», International Journal of Finance and Economics, 3, 169-188. Feldstein, M. and Horioka, C. (1980). «Domestic Saving and International Capital Flows», Economic Journal, 90, 314-29. Fisher, R.A. (1932). Statistical Methods for Research Workers, Oliver and Boyd, Edinburgh. Ho, T, (2002a). «The Feldstein Horioka Puzzle Revisited», Journal of International Money and Finance, 21, 555-564. Ho, T, (2002b). «A Panel Cointegration Approach to the Saving-Investment Correlation», Empirical Economics, 27, 91-100. Im, K. S., Pesaran, M.H. and Shin, Y. (2002). «Testing for Unit Roots in Heterogeneous Panels», Journal of Econometrics, forthcoming. Jansen, W.J. (1998). «Interpreting Saving-Investment Correlations», Open Economies Review, 9, 205-217. Jansen, W.J. (2000). «International Capital Mobility : Evidence from Panel Data», Journal of International Money and Finance, 19, 507-511.
36
A New Look at the Feldstein-Horioka Puzzle using an Integrated Panel
Johansen, S. (1995). Likelihood-Based Inference in Cointegrated Vector Autore-gressive Models, Oxford University Press, Oxford and New York. Larsson, R., and Lyhagen, J. (2000). «Likelihood-Based Inference in Multivariate Panel Cointegration Models», Discussion Paper 1313, Econometric Society World Congress 2000 Contributed Papers. Levin, A., and Lin, C. F. (1992). «Unit Root Tests in Panel Data: Asymptotic and Finite Sample Properties», Discussion Paper 92-93, Department of Economics, University of California at San Diego. Levin, A., and Lin, C. F. (1993). «Unit Root Tests in Panel Data: New Results» Discussion Paper 93-56, University of California at San Diego. Levin, A., Lin, C. F. and Chu, C-S. J. (2002). «Unit Root Tests in Panel Data: Asymptotic and Finite-Sample Properties», Journal of Econometrics, 108, 1-24. Maddala, G., and S. Wu (1999). «A Comparative Study of Unit Root Tests and a New Simple Test», Oxford Bulletin of Economic and Statistics, 61, 631-652. Özmen, E. and Parmaksiz, K. (2003). «Exchange rate Regimes and the Feldstein Horioka Puzzle: the French Evidence» Applied Economics, 35, 217-222. Pedroni, P. (1999). «Critical Values for Cointegration Tests in Heterogeneous Panels with Multiple Regressors», Oxford Bulletin of Economics and Statistics, 61, Special Issue, 653-70. Pedroni, P. (2000). «Fully Modified OLS for Heterogeneous Cointegrated Panels», in Advances in Econometrics. Nonstatonary Panels, Panel Cointegration and Dynamic Panels, edited by B. Baltagi, and C. D. Kao, pp. 93-130. Elsevier Science, New York. Pedroni, P. (2001). «Purchasing Power Parity Tests In Cointegrated Panels», The Review of Economics and Statistics, 83, 727-731. Pesaran, M. H., and Smith, R.J. (1995). «Estimating Long-Run Relationships from Dynamic Heterogeneous Panels», Journal of Econometrics, 68, 79-113. Sarno, L. and Taylor, M.P (1998). «Exchange Controls, International Capital Flows and Saving-Investment Correlation in the UK: an Empirical Investigation», Weltwirtschaftliches Archiv, 134, 169-198. Summers, L.H. (1988). «Tax Policy and International Competitiveness», in J. Frankel (editor), International Aspects of Financial Policies, Chicago University Press, Chicago. Taylor, A.M. (1996). «International Capital Mobility in History : the Saving-Investment Taylor, A.M (2002) «A Century of Current Account Dynamics», NBER Working Paper 8927.
37
CEPII, Working Paper No 2003 - 22
Van der Noord, P. (2000). «The Size and the Role of automatic fiscal stabilisers in the 90s and Beyond» OECD working paper No 230, January
LIST OF WORKING PAPERS RELEASED BY
No
CEPII
Title
14
Authors
2003-21
Trade Linkages and Exchange Rates in Asia : The A. Bénassy-Quéré & Role of China Aminal Lahrèche-Révil
2003-20
Economic Implications of Trade Liberalization Under the Doha Round
2003-19
Methodological Tools for SIA – Report of the CEPII Worshop held on 7-8 November 2002 in Brussels
2003-18
Order Flows, Delta Hedging and Exchange Rate Dynamics
2003-17
Tax competition and Foreign Direct Investment
2003-16
Commerce et transfert de technologies : les cas comparés de la Turquie, de l’Inde et de la Chine
2003-15
The Empirics of Agglomeration and Trade
2003-14
Notional Defined Contribution: A Comparison of the French and German Point Systems
2003-13
How Different is Eastern Europe? Structure and Determinants of Location Choices by French Firms in Eastern and Western Europe
C. Disdier & T. Mayer
2003-12
Market Access Liberalisation in the Doha Round: Scenarios and Assessment
L. Fontagné, J.L. Guérin & S. Jean
2003-11
On the Adequacy of Monetary Arrangements in SubSaharian Africa
A. Bénassy-Quéré & Maylis Coupet
2003-10
The Impact of EU Enlargement on Member States : a CGE Approach
H. Bchir, L. Fontagné & P. Zanghieri
J. Francois, H. Van Meijl, F. Van Tongeren N. Kousnetzoff B. Rzepkowski A. Bénassy-Quéré, L. Fontagné & A. Lahrèche-Révil F. Lemoine & D. Ünal-Kesenci K. Head & T. Mayer F. Legros
14
Working papers are circulated free of charge as far as stocks are available; thank you to send your request to CEPII, Sylvie Hurion, 9, rue Georges-Pitard, 75015 Paris, or by fax : (33) 01 53 68 55 04 or by e-mail
[email protected]. Also available on: \\www.cepii.fr. Working papers with * are out of print. They can nevertheless be consulted and downloaded from this website. 14
Les documents de travail sont diffusés gratuitement sur demande dans la mesure des stocks disponibles. Merci d’adresser votre demande au CEPII, Sylvie Hurion, 9, rue Georges-Pitard, 75015 Paris, ou par fax : (33) 01 53 68 55 04 ou par e-mail
[email protected]. Egalement disponibles sur : \\www.cepii.fr. Les documents de travail comportant * sont épuisés. Ils sont toutefois consultable sur le web CEPII.
38
A New Look at the Feldstein-Horioka Puzzle using an Integrated Panel
2003-09
India and the World Economy : Specialisations and Technology Niches
Traditional
S. Chauvin & F. Lemoine
2003-08
Imination Amongst Exchange-Rate Evidence from Survey Data
Forecasters :
M. Beine, A. Bénassy-Quéré & H. Colas
2003-07
Le Currency Board à travers l’expérience de l’Argentine
S. Chauvin & P. Villa
2003-06
Trade and Convergence : Revisiting Ben-David
2003-05
Estimating the Fundamental Equilibrium ExchangeRate of Central and Eastern European Countries the EMU Enlargement Perspective
B Egert & A. Lahrèche-Revil
2003-04
Skills, Technology and Growth is ICT the Key to Success
J. Melka, L. Nayman, S. Signano & N. Mulder
2003-03
L’investissement en TIC aux Etats-Unis et dans quelques pays européens
G. Cette & P.A. Noual
2003-02
Can Business and Social Networks Explain the Border Effect Puzzle?
2003-01
Hyperinflation and the Reconstruction of a National Money: Argentina and Brazil, 1990-2002
P.P. Combes, M. Lafourcade & T. Mayer J. Sgard
2002-18
Programme de travail du CEPII pour 2003
2002-17
MIRAGE, a Computable General Equilibrium Model for Trade Policy Analysis
2002-16
Evolutions démographiques et marché du travail : des liens complexes et parfois contradictoires
M.H. Bchir, Y. Decreux, J.L. Guérin & S. Jean L. Cadiou, J. Genet & J.L. Guérin
2002-15
Exchange Rate Regimes and Sustainable Parities for CEECs in the Run-up to EMU Membership
V. Coudert & C. Couharde
2002-14
When are Structural Deficits Good Policies?
J. Chateau
2002-13
Projections démographiques de quelques pays de l’Union Européenne (Allemagne, France, Italie, Royaume-Uni, Pays-Bas, Suède)
R. Sleiman
2002-12
Regional Trade Integration in Southern Africa
2002-11
Demographic Evolutions and Unemployment: an Analysis of French Labour Market with Workers Generations
2002-10
Liquidité et passage de la valeur
2002-09
Le concept de coût d’usage Putty-Clay des biens durables
G. Gaulier
S. Chauvin & G. Gaulier J. Château, J.L. Guérin & F. Legros P. Villa
39
M.G. Foggea & P. Villa
CEPII, Working Paper No 2003 - 22
2002-08
2002-07 2002-06
Mondialisation et régionalisation : le cas des industries du textile et de l’habillement
M. Fouquin, P. Morand R. Avisse G. Minvielle & P. Dumont The Survival of Intermediate Exchange Rate Regimes A. Bénassy-Quéré & B. Coeuré Pensions and Savings in a Monetary Union : An A. Jousten & F. Legros Analysis of Capital Flow
2002-05
Brazil and Mexico’s Manufacturing Performance in International Perspective, 1970-1999
2002-04
The Impact of Central Bank Intervention Exchange-Rate Forecast Heterogeneity
2002-04
The Impact of Central Bank Intervention on Forecast Heterogeneity
2002-03
Impacts économiques et sociaux de l’élargissement pour l’Union européenne et la France
M. Beine, A. Benassy-Quéré, E. Dauchy & R. MacDonald M. Beine, A. Benassy-Quéré, E. Dauchi & R. MacDonald M.H. Bchir & M. Maurel
2002-02
China in the International Segmentation of Production Processes
F. Lemoine & D. Ünal-Kesenci
2002-01
Illusory Border Effects: Distance Mismeasurement Inflates Estimates of Home Bias in Trade
K Head & T. Mayer
2001-22
Programme de travail du CEPII pour 2002
2001-21
Croissance économique mondiale : un scénario de référence à l’horizon 2030
N. Kousnetzoff
2001-20
The Fiscal Stabilization Policy under EMU – An Empirical Assessment
A. Kadareja
2001-19
Direct Foreign Investments and Productivity Growth in Hungarian Firms, 1992-1999
J. Sgard
2001-18
Market Access Maps: A Bilateral and Disaggregated Measure of Market Access
A. Bouët, L. Fontagné, M. Mimouni & X. Pichot
2001-17
Macroeconomic Consequences of Pension Reforms in Europe: An Investigation with the INGENUE World Model
Equipe Ingénue
2001-16* La productivité des industries méditerranéennes 2001-15
Marmotte: A Multinational Model
40
on
N. Mulder, S. Montout & L. Peres Lopes
A. Chevallier & D. Ünal-Kesenci L. Cadiou, S. Dees, S. Guichard, A. Kadareja, J.P. Laffargue & B. Rzepkowski
A New Look at the Feldstein-Horioka Puzzle using an Integrated Panel
2001-14
The French-German Productivity Comparison Revisited: Ten Years After the German Unification
L. Nayman & D. Ünal-Kesenci
2001-13* The Nature of Specialization Matters for Growth: An Empirical Investigation
I. Bensidoun, G. Gaulier & D. Ünal-Kesenci
2001-12
Forum Economique Franco-Allemand - DeutschFranzösisches Wirtschaftspolitisches Forum, Political Economy of the Nice Treaty: Rebalancing the EU Council and the Future of European Agricultural Policies, 9th meeting, Paris, June 26th 2001
2001-11
Sector Sensitivity to Exchange Rate Fluctuations
2001-10* A First Assessment of Environment-Related Trade Barriers
M. Fouquin, K. Sekkat, J. Malek Mansour, N. Mulder & L. Nayman L. Fontagné, F. von Kirchbach & M. Mimouni
2001-09
International Trade and Rend Sharing in Developed and Developing Countries
L. Fontagné & D. Mirza
2001-08
Economie de la transition : le dossier
2001-07
Exit Options for Argentina with a Special Focus on Their Impact on External Trade
S. Chauvin
2001-06
Effet frontière, intégration économique et 'Forteresse Europe'
T. Mayer
2001-05
Forum Économique Franco-Allemand – DeutschFranzösisches Wirtschaftspolitisches Forum, The Impact of Eastern Enlargement on EU-Labour Markets and Pensions Reforms between Economic and Political Problems, 8th meeting, Paris, January 16 2001
2001-04
Discrimination commerciale : une mesure à partir des flux bilatéraux
G. Gaulier
2001-03* Heterogeneous Expectations, Currency Options and the Euro/Dollar Exchange Rate
B. Rzepkowski
G. Wild
2001-02
Defining Consumption Behavior in a Multi-Country Model
O. Allais, L. Cadiou & S. Dées
2001-01
Pouvoir prédictif de la volatilité implicite dans le prix des options de change
B. Rzepkowski
2000-22
Forum Economique Franco-Allemand - DeutschFranzösisches Wirtschaftspolitisches Forum, Trade Rules and Global Governance: A long Term Agenda and The Future of Banking in Europe, 7th meeting, 41
CEPII, Working Paper No 2003 - 22
Paris, July 3-4 2000 2000-21
The Wage Curve: the Lessons of an Estimation Over a Panel of Countries
S. Guichard & J.P. Laffargue
2000-20
A Computational General Equilibrium Model with Vintage Capital
L. Cadiou, S. Dées & J.P. Laffargue
2000-19
Consumption Habit and Equity Premium in the G7 Countries
O. Allais, L. Cadiou & S. Dées
2000-18
Capital Stock and Productivity in French Transport: An International Comparison
B. Chane Kune & N. Mulder
2000-17
Programme de travail 2001
2000-16
La gestion des crises de liquidité internationale : logique de faillite, prêteur en dernier ressort et conditionnalité
2000-15
La mesure des protections commerciales nationales
2000-14
The Convergence of Automobile Prices in the European Union: An Empirical Analysis for the Period 1993-1999
G. Gaulier & S. Haller
2000-13* International Trade and Firms’ Heterogeneity Under Monopolistic Competition
S. Jean
2000-12
Syndrome, miracle, modèle polder et autres spécificités néerlandaises : quels enseignements pour l’emploi en France ?
S. Jean
2000-11
FDI and the Opening Up of China’s Economy
2000-10
Big and Small Currencies: The Regional Connection
2000-09* Structural Changes in Asia And Growth Prospects After the Crisis
J. Sgard
A. Bouët
F. Lemoine A. Bénassy-Quéré & B. Coeuré J.C. Berthélemy & S. Chauvin
2000-08
The International Monetary Fund and the International Financial Architecture
M. Aglietta
2000-07
The Effect of International Trade on Labour-Demand Elasticities: Intersectoral Matters
S. Jean
2000-06
Foreign Direct Investment and the Prospects for Tax Co-Ordination in Europe
A. Bénéssy-Quéré, L. Fontagné & A. Lahrèche-Révil
2000-05
Forum Economique Franco-Allemand - DeutschFranzösisches Wirtschaftspolitisches Forum, Economic Growth in Europe Entering a New Area?/The First Year of EMU, 6th meeting, Bonn, January 17-18, 2000
2000-04* The Expectations of Hong Kong Dollar Devaluation 42
B. Rzepkowski
A New Look at the Feldstein-Horioka Puzzle using an Integrated Panel
and their Determinants 2000-03
What Drove Relative Wages in France? Structural Decomposition Analysis in a General Equilibrium Framework, 1970-1992
S. Jean & O. Bontout
2000-02
Le passage des retraites de la répartition à la capitalisation obligatoire : des simulations à l’aide d’une maquette
O. Rouguet & P. Villa
2000-01* Rapport d’activité 1999 1999-16
Exchange Rate Strategies in the Competition for Attracting FDI
A. Bénassy-Quéré, L. Fontagné & A. Lahrèche-Révil
1999-15
Groupe d’échanges et de réflexion sur la Caspienne. Recueil des comptes-rendus de réunion (déc. 97- oct. 98)"
D. Pianelli & G. Sokoloff
1999-14
The Impact of Foreign Exchange Interventions: New Evidence from FIGARCH Estimations
M. Beine, A. Bénassy-Quéré & C. Lecourt
1999-13
Forum Economique Franco-Allemand - DeutschFranzösisches Wirtschaftspolitisches Forum, Reduction of Working Time/Eastward Enlargment of the European Union, 5 th meeting, Paris, July 6-7 1999
1999-12* A Lender of Last Resort for Europe
M. Aglietta
1999-11* La diversité des marchés du travail en Europe : Quelles conséquences pour l’Union Monétaire ; Deuxième partie : Les implications macroéconomiques de la diversité des marchés du travail
L. Cadiou, S. Guichard & M. Maurel
1999-10* La diversité des marchés du travail en Europe : Quelles conséquences pour l’Union Monétaire ; Première partie : La diversité des marchés du travail dans les pays de l’Union Européenne
L. Cadiou & S. Guichard
1999-09
The Role of External Variables in the Chinese Economy; Simulations from a macroeconometric model of China
S. Dees
1999-08
Haute technologie et échelles de qualité : de fortes asymétries en Europe
L. Fontagné, M. Freudenberg & D. Ünal-Kesenci
1999-07
The Role of Capital Accumultion, Adjustment and Structural Change for Economic Take-Off: Empirical Evidence from African Growth Episodes
J.C. Berthélemy & L. Söderling
1999-06
Enterprise Adjustment and the Role of Bank Credit in Russia: Evidence from a 420 Firm’s Qualitative Survey
S. Brana, M. Maurel & J. Sgard
43
CEPII, Working Paper No 2003 - 22
1999-05
Central and Eastern European Countries in the International Division of Labour in Europe
1999-04
Forum Economique Franco-Allemand – Economic Policy Coordination – 4 th meeting, Bonn, January 1112 1999
1999-03
Models of Exchange Rate Expectations: Heterogeneous Evidence From Panel Data
1999-02
Forum Economique Franco-Allemand Market & Tax Policy in the EMU
1999-01
Programme de travail 1999
44
–
Labour
M. Freudenberg & F. Lemoine
A. Bénassy-Quéré, S. Larribeau & R. MacDonald
CEPII, Working Paper No 2003 - ? ?
CEPII DOCUMENTS DE TRAVAIL / WORKING PAPERS Si vous souhaitez recevoir des Documents de travail, merci de remplir le coupon-réponse ci-joint et de le retourner à : Should you wish to receive copies of the CEPII’s Working papers, just fill the reply card and return it to:
Sylvie HURION – Publications CEPII – 9, rue Georges-Pitard – 75740 Paris – Fax : (33) 1.53.68.55.04 M./Mme / Mr./Mrs ................................................................................................................................ Nom-Prénom / Name-First name ......................................................................................................... Titre / Title ............................................................................................................................................... Service / Department.............................................................................................................................. Organisme / Organisation ..................................................................................................................... Adresse / Address................................................................................................................................... Ville & CP / City & post code ............................................................................................................. Pays / Country...................................................................... Tél. ........................................................... Désire recevoir les Document de travail du CEPII n° : Wish to receive the CEPII’s Working Papers No: .......................................................................... ................................................................................................................................................................... ................................................................................................................................................................... ................................................................................................................................................................... ................................................................................................................................................................... ................................................................................................................................................................... ................................................................................................................................................................... ...................................................................................................................................................................
c
Souhaite être placé sur la liste de diffusion permanente (pour les bibliothèques) Wish to be placed on the standing mailing list (for Libraries).