A New measurement system for large bandwidth NPR characterization of satellite transponders SSPAs. D. Barataud *, A. Mallet*, J.C. Lalaurie*, L. Lapierre*, J. Sombrin* T. Reveyrand **, J.M. Nebus ** **
CNES – 18, Av. E. Belin 31401 Toulouse Cédex (France) Phone (033) 561-283268, Fax (033) 561-61282613, e-mail:
[email protected], WWW: http : //cnes.fr * IRCOM - Faculté des Sciences – UMR n°6615 – 123, Av. A.THOMAS 87060 LIMOGES Cédex (France) Phone (033) 555-457517, Fax (033) 555-457514, e-mail:
[email protected], WWW: http : //ircom.unilim.fr
Abstract – Nowadays, the large expansion of the telecommunication market has an important impact on the space segment. In the satellite payloads, transponders SSPAs are the most critical element for the power dissipation budget. To optimize the trade off between output power, efficiency and linearity, a new accurate experimental tool is increasingly required to test and characterize the linearity of power amplifiers implemented by the different French agencies (CNES, France Télécom and DGA) in the technological program STENTOR. The linearity characterization of multicarrier power amplifiers is based on Noise Power Ratio (NPR) measurements. In the last past years, to realize NPR measurements power amplifiers are driven with a signal coming from an analog band pass noise source with a notch in the center bandwidth. This paper presents a new NPR measurement system based on a numerical generation of band-pass Gaussian noise. It uses an Arbitrary Waveform Generator (AWG) to generate the input signal with the notch and a digital sampling oscilloscope to measure the output envelope of the signal supplied by the Device Under Test (DUT). This characterization technique provide valuable information to validate NPR simulation techniques since the measurement principle is similar as the NPR simulation approach using the envelop transient method. A comparison between NPR measurements realized with the new characterization system and the conventional analog noise source technique is presented. Moreover, the great interest of this new characterization system lies in that any kind of modulated test signals can be generated (QPSK, QAM, CDMA…). The conclusion of the paper presents other measurement applications allowed by the same new measurement system. I. INTRODUCTION It is now well known that non linear devices such as power amplifiers used for large bandwidth multi-carrier
amplification in satellite communications systems exhibit distortions due to their non linear dynamic behavior. Non linear memory effects must be taken into account, and classical prediction of distortion by using classical AM/AM and AM/PM conversion characteristics is no longer sufficient. Moreover, the characterization of power amplifier linearity by using two tone test signals becomes obviously not suitable in the case of multi-carrier amplification [1]. The characterization of non-linear devices in terms of noise power ratio (NPR) is of prime importance, since the test signals are representative of complex modulated signals encountered in real applications. So, the NPR becomes a criteria as important as the output power and the power added efficiency [2]. As the future satellite telecommunication systems will be defined to work with signals bandwidth equal to 125 or 250 MHz, a large bandwidth NPR criteria will be required. In such a context, to ensure a sufficient quality of service, the design and the final test of satellite transponders SSPAs (as those used for STENTOR) requires the use of a novel accurate measurement system of non-linear devices driven by complex modulated signal. Gaussian band-limited noise is a representative and a well suited signal to determine the Noise Power ratio criterion. Conventional NPR measurement systems are based on the use of an analog white noise source as depicted in the global overview of the analog system (Figure 1) developed by ALCATEL Space Industries [3].
Analog Noise generator 27,3 MHz
SAW Filter -23 dB f0 =160 MHz ∆f=17,8 ∆ MHz
B (MHz)
Yig Filter -3 dB 2-8GHz
SSPA 2-8 GHz Ps = 33 dBm
Amplifier G=20 dB Ps=26 dBm
50 dBc
bnotch (kHz)
Mixer
Source 132,7 MHz
SSPA 2-8 GHz Ps = 33 dBm
Band-pass Filter (f0)
Attenuator
Source 2-8 GHz
bandwidth analysis NPR
Powermeter
NPR
zoom
D.U.T.
Spectrum Analyzer
Powermeter
Fig. 1. : Overall architecture of the traditional analog NPR measurement system
Isolator 2-4 GHz
Power Divider 1-4 GHz CH1 SYNC
AWG Ch 1 12 bits 250MHz 2 canaux Arbitrary Waveform Generator 12bit - 250 MS/s - 2 channels
IQ modulator
Step Variable Attenuator DC-18 GHz
f RF A
f ol
fol
Amplifier 2-4 GHz
B Narrow Band-pass Filter 2-4 GHz
Band-pass Filter
3 dB
Pin 10 dB Coupler 1-4.2 GHz
3 dB Coupler 2-4GHz 3 dB Coupler 2-4GHz
The test-bench is composed of : an analog white noise source, a band-pass filter and a notch filter to realize the spectral shape of the noise stimuli, a first mixer is used with a 132.7 MHz local oscillator to enhance the frequency conversion from 27.3 MHz to 160 MHz. a SAW Filter is then used to eliminate the spurious frequencies resulting from the frequency conversion, a linear amplifier with a 20 dB power gain amplifies the filtered signal without degrading the NPR signal, a second mixer allows the frequency conversion from 160 MHz up to a microwave frequency from 2 to 8 GHz depending on the value of frequency imposed by the second local variable C. W source, a Yig filter is used to eliminate the spurious frequencies resulting from this second frequency conversion, One or two linear amplifiers can be used to have a sufficient power to drive the device under test. The noise power is measured in the “quiet” channel (notch) thanks to an accurate spectrum analyzer. The NPR is the ratio between the noise power measured in a specific bandwidth (a hundred kHz) determined with the spectrum analyzer without the notch filter to that measured with the notch filter. The difference between these two values is directly displayed by the spectrum analyzer. The input and output noise powers are measured thanks to two powermeters. Such a measurement system is only dedicated to NPR characterization. Other kind of useful modulated signals like QPSK, QAM, CDMA signals cannot be synthesized and cannot be used as test signals for the device under test. For that purpose, a new characterization tool has been developed. II. DESCRIPTION OF THE NEW NPR AND MODULATED COMPLEX SIGNALS MEASUREMENT SYSTEM. The principle of the measurement system is described in Fig. 2.
Power Divider
f ol
22 dB Bidirectional Coupler 2-18 GHz
fol
Variable Variable Attenuator phase shifter 15 dB
fRF
Digital sampling oscilloscope
Isolator
2 Channels Powermeter
C
DeviceUnder Test
VISUALISATION
22,5 dB
f ol LO Rejection
Microwave Sourcef o l
RF OUT
IQ Demodulator Aux Trigger Input
Scope : 500 MHz 1Gsa/s 8 bit 4 Channels
fFI fO L fRF
D 22 dB Bidirectional Coupler 2-18 GHz
fRF 26 dB Channel 1
2
3
4
Pout
f FI 10 dB Coupler 0.5-10 GHz 10 dB Coupler 0.5-10 GHz
10 dB
Spectrum analyzer
E
50 Ω Ω
Fig. 2. : Configuration of the new measurement system for NPR measurements
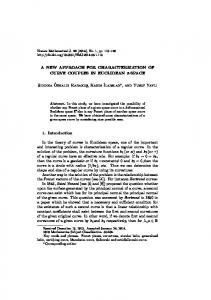
The measurement system is based on the use of : an Arbitrary Waveform Generator (AWG) to generate base-band test signal, a module for the up-conversion from the baseband frequencies to the RF frequencies, a module for the down-conversion from the RF frequencies back to the base-band frequencies, a digital sampling oscilloscope for the envelope measurement. Covering frequency band from 1GHz to 4 GHz, this system simplifies characterizations by automatically sweeping the input power applied to the device under test because of a computer controlled step attenuator. The Arbitrary Waveform Generator has a 250 Msample/s Clock that provides up to 125 MHz Waveforms. The 12 bits vertical resolution authorized the generation of 72 dBc NPR test signals. With this controlled AWG, the base-band signals are easily generated. An example of the power spectrum of a test signal used for the NPR characterization is shown in Fig. 3. This is a coarse representation of a Band-pass gaussian white noise with a notch usually impressed around the center carrier frequency. Practically the spectrum is made of a large number (1000 to 10000 CW carriers from DC to 125 MHz) of equi-amplitude and regularly spaced frequency carriers (between f1 and f4) having independent random phases with a uniform distribution.
White Gaussian Noise Bandwidth notch
f3
Power (dBm)
f1
f2
f4
Time domain representation of I[k]
Gaussian Distribution of the magnitude of I[k]
Fig. 4. : Example of test signal f0
f
Fig. 3. : Power spectrum of the input NPR test signal
An ideal notch is realized by removing few carriers (W notch equal to 1 to 10 %) within a channel bandwidth between f2 and f3. The notch is centered around the low frequency f0. The resulting NPR test signal can be written as : N freq
I [k ] =
∑ A sin 2π f i =1
k e
f i + ϕi
The basic measurement principle which consists in generating a large number of carriers with random different phases is very attractive because it’s similar as the computation of NPR (ADS) using the transient envelope analysis [4]. When this NPR test signal is fed into the power amplifiers, intermodulation products fill up the notch, as depicted in Figure 5, so that the ratio of the average output power within the notch to the average output power outside the notch defines the NPR.
(1)
White Gaussian Noise Bandwidth
The value of the index k is dependent on the sampling frequency fe, the number of frequencies, Nfreq , taken into account in the gaussian noise bandwidth, BWGN. It means that k varies between 0 and M-1 where M is equal to the number of samples or data points in the time domain : f e N freq − 1 M = E and 0 < k < M-1 (3) B WGN
(
As an example, the
)
I [k ] signal with the following
parameters is sketched in the Figure 4 : f0 =45 MHz BWGN = 30 MHz W notch = 1% Nfreq = 4000 Fe =250 MHz M = 33325
f1 Power (dBm)
magnitude of each frequency component of interest fi : frequency of interest ϕi : random phase fe : sampling frequency k: sample index f and where f i ≤ e (2) 2
notch
where A :
f3
f2
f0
f4
f
Fig. 5. : Power spectrum of the output signal
The second important instrument in the set-up of the Fig. 2 is the digital oscilloscope. This instrument has a bandwidth of 500 MHz, a maximum sampling frequency of 1 Gsamples/s and a 8 bits vertical resolution allowing the analysis of maximum 48 dBc NPR test signals. A DFT is performed once the output signal is recorded to compute the NPR as define above. The up-conversion from the base-band frequencies to RF frequencies is realized by mixing the test signal with the CW signal generated by an local oscillator. The same mixing principle and the same local oscillator is used for the down-conversion, from the RF frequencies to the FI frequencies. The mean input and output power of the test signal is measured at both ports of the device under test thanks to a 2 channels powermeter.
A classical power calibration, once the device under test is removed, is required before measurements. III. COMPARISON OF NPR MEASUREMENT RESULTS. The SSPA used for the comparison has been realized by ALCATEL Space Industries under a CNES contract with PHEMT (pseudomorphic high electron mobility) field effect transistors. The features of this amplifier sketched in Figure 3.1 and composed of a variable attenuator (MMIC), an amplifier driver (MMIC + Hybrid PHEMT 1 mm), a power amplifier (2 PHEMT) and an isolator are the following ones : 2180MHz 40MHz > 50 dB > 36.3 dBm
45
40
35 NPR (dBc)
Frequency Frequency bandwidth Nominal gain RF Output Power at 14dB NPR Associated Power added efficiency weight Input overdrive lifetime
VG2 = -0.94 V IG2 = 15 mA VCTRL = 0 V VD1 = 5 V ID1 = 27 mA VD2 = 6 V ID2 = 61 mA VD3 = 6 V ID3 = 1.99 A The Figure 7 represents the different following results obtained with the SSPA : the top figure is the NPR measured with the two systems as a function of the noise output power, the bottom figure is the multicarrier gain and the mean output power as a function of the mean input power.
> 35 %
30
25
20
< 75 g 20 dB 10 years min.
15
10 22
24
26
28
30
32
34
36
38
Pout (dBm)
S-Band GPAD SSPA
Attenuator
Amplifier pHEMTs 2x16mm
64
36 34
VD2 = 6 V VG2 = -0.1 V ID2 = 58 mA
VD3 = 6 V VG3 = -0.94 V ID3 = 1,4 à 2,1 A
62
32
Gain (dB)
OUT VD1 = 5 V ID1 = 27 mA
38
Isolator
pHEMT 1mm
IN Vctrl = 0 V (atten min)
NPR Alcatel B=16MHz b=0,4%
30 28 60
26
Driver
24 22
Fig. 6. : Overview of the SSPA and its biasing 58
20 -45
The NPR measurements were realized with the following different configurations : F Traditional analog NPR measurement system : B = 16 MHz around 2.18 GHz bnotch = 0.4 % (64 kHz) Bandwidth analysis : 20 kHz around 2.18 GHz in the 64 kHz notch bandwidth F New measurement system : f0 = 2.18 GHz BWGN = 20 MHz W notch = 1% (200 kHz ⇔ 10 carriers removed) Nfreq = 1000 Fe =250 MHz M = 12488 Bias parameters of the amplifier are the following ones : VG1 = -0.1 V IG1 = 0 mA
Pout (dBm)
Amplifier Amplifier HBT
NPR CNES Nfreq = 1000 B=20 MHz Wnotch=1%
-40
-35
-30
-25
-20
P i n (dBm)
Gain CNES Nfreq = 1000 B=20 MHz Wnotch=1% Gain Alcatel B=16MHz b=0,4% AM/AM CNES Nfreq = 1000 B=20 MHz Wnotch=1% AM/AM ALCATEL B=16MHz b=0,4%
Fig. 7. : Noise power performance and power performance of the SSPA
There’s a good agreement between the different results. The discrepancy between “analog” NPR and “digital “NPR can be explained by the discrepancy between the excitation signals that feed the amplifier. For instance the results will be better if the number of carriers (Nfreq = 10000 ) is increased in the case of the NPR measurement with the new measurement system. IV CONCLUSION A novel approach for the characterization of power amplifier linearity in terms of NPR has been proposed. It
provides valuable information in the sense that this method based on a numerical generation of a gaussian noise is similar to what can be done in the field of NPR simulations using the envelop transient technique. Another important point is that the proposed system can be applied to other investigations. For example, other test signals like digital modulation can be synthesized for non linear amplifier characterization and black box modeling. Investigations on linearization of amplifiers can also be performed as base-band signals can be computed and or pre-distorted. The principle of this new approach at L and S band can be easily extended to upper frequency bands (Ku, Ka, X…). REFERENCES [1] R.J. WESTCOTT " Investigation of multiple f.m./f.d.m. carriers through a satellite t.w.t. operating near saturation ", Proc. IEEE, Vol. 114, N°6, pp.726-740, June 1967. [2] J. SOMBRIN " Critère de comparaison, d’optimisation et d’utilisation optimale des amplificateurs de puissance nonlinéaires ", CNES report, Réf. CNES DT-96-16-CT/AE/TTL/HY, May 1989. [3] F. BRASSEAU , L. CHAPUS, G. MICHAUD, A.DARBANDI " Réalisation d’un banc de mesures NPR large bande ", 10èmes Journées Nationales Microondes, 4D20, pp. 454-455, Saint-Malo, Mai 1997 [4] J. LAJOINIE, E. NGOYA, D. BARATAUD, J.M. NEBUS, J. SOMBRIN, B. RIVIERRE " Efficient simulation of NPR for the optimum design of satellite transponders SSPAs ", IEEE MTT-S Digest, Baltimore, 1998, pp. 741-744.