Of Electrical Eng. & Computer Science, Vanderbilt University, Nashville, TN, USA ... Of Neurosurgery, Vanderbilt University Medical Center, Nashville, TN, USA.
A New Method for Creating Electrophysiological Maps for DBS Surgery and Their Application to Surgical Guidance Srivatsan Pallavaram1, Pierre-Francois D’Haese1, Chris Kao2, Hong Yu2, Michael Remple2, Joseph Neimat2, Peter Konrad2, and Benoit Dawant1 1
Dept. Of Electrical Eng. & Computer Science, Vanderbilt University, Nashville, TN, USA 2 Dept. Of Neurosurgery, Vanderbilt University Medical Center, Nashville, TN, USA {sri.pallavaram, pierre-francois.dhaese, chris.kao, hong.yu, mike.remple, joseph.neimat, peter.konrad, benoit.dawant}@vanderbilt.edu
Abstract. Electrophysiological maps based on a Gaussian kernel have been proposed as a means to visualize response to stimulation in deep brain stimulation (DBS) surgeries. However, the Gaussian model does not represent the underlying physiological phenomenon produced by stimulation. We propose a new method to create physiological maps, which relies on spherical shell kernels. We compare our new maps to those created with Gaussian kernels and show that, on simulated data, this new approach produces more realistic maps. Experiments we have performed with real patient data show that our new maps correlate well with the underlying anatomy. Finally, we present preliminary results on an ongoing study assessing the value of these maps as pre-operative planning and intra-operative guidance tools. Keywords: Deep brain stimulation, electrophysiological efficacy maps, preand intra-operative guidance, surgical navigation.
1 Introduction Deep brain stimulation (DBS) is widely used to provide symptomatic relief in patients with movement disorders like Parkinson’s disease. Electrodes are placed in specific targets deep within the brain. Such functional neurosurgical procedures require precise targeting. Traditionally, such targeting is performed in two steps. An approximate target location is first selected preoperatively by a neurosurgeon based on preoperative imaging. The target position is then adjusted intra-operatively using multiple electrodes to map the electrophysiology of the brain around the planned target. The intra-operative adjustment is based on micro-electrode recordings and response to stimulation. The goal is to find a location where symptom reduction (efficacy) occurs at a low stimulation voltage, while any side effects occur at much higher voltage. It has been reported [1] that there are multiple regions in the brain where efficacy for a given movement disorder can be achieved by DBS. For instance, for Parkinson’s disease it is reported that both the dorsal part of the subthalamic nucleus (STN) and D. Metaxas et al. (Eds.): MICCAI 2008, Part I, LNCS 5241, pp. 670–677, 2008. © Springer-Verlag Berlin Heidelberg 2008
A New Method for Creating Electrophysiological Maps for DBS Surgery
671
zona inserta (ZI) provide symptom relief. Unfortunately, these areas are not easily visualized on pre-operative imaging. Targeting could be facilitated by a map containing the high efficacy locations in a particular patient. One way to provide the surgical team with such information is to create probabilistic maps that show the efficacy zones based on intra-operative data recorded in a population of patients. D’Haese et al [2] and Guo et al [3] have used a truncated Gaussian (referred in this document as trunc-Gaussian) function as an approximation to the distribution of the electric field around a point of stimulation. They have also used this as the basis to generate maps of stimulation efficacy and side effects. We note that such a function may be appropriate as an approximation to the electric field but is not the appropriate kernel to represent the underlying physiological phenomenon caused by stimulation. The problem at hand can be considered as an inverse problem where the objective is to find loci of points that are likely to have caused the observed stimulation response. We propose the use of a new kernel; a spherical shell, that is representative of this cause and effect relationship between stimulation and the response observed. We present results we have obtained with a total of 95 stimulation points obtained from 19 patients and we show that the areas of high efficacy we identify with our method correspond to or are proximal to target points selected intraoperatively.
2 Method 2.1 Registration A key component of the method is our ability to map information acquired from a population of patients onto one reference image volume, termed the atlas. Two types of registration algorithms are needed to perform such mapping; rigid and non-rigid. The rigid registration algorithm is required to register preop MRI and preop CT (preop CT scans are acquired at our institution because the stereotactic frame we use, which is described in section 2.2, requires it). Non-rigid registration is required to register each patient’s data to an MRI atlas, which serves as a repository of information from a population of patients. In this study, non-rigid registration is always performed on MRI volumes using the adaptive bases algorithm proposed by Rhode et al [4]. Briefly, this algorithm computes a deformation field that is modeled as a linear combination of radial basis functions with finite support. This results in a transformation with several thousands of degrees of freedom. Two transformations (one from the atlas to the subject and the other from the subject to the atlas) that are constrained to be inverses of each other are computed simultaneously. Both the rigid and non-rigid registration algorithms are mutual information based. 2.2 Data Preparation At our institution DBS is performed with a miniature stereotactic frame, the StarFix microTargeting Platform® (501(K), Number K003776, Feb. 23, 2001, FHC, INC; Bowdoin, ME). During surgery, a micropositioning drive (microTargeting® drive system, FHC Inc., Bowdoin, ME) is mounted on the platform. Recording and stimulating leads are then inserted using the microdrive. Details on the platform, including
672
S. Pallavaram et al.
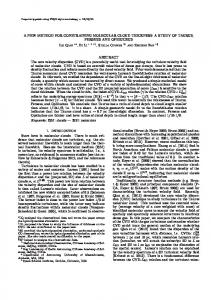
a study of its accuracy demonstrating it to be at least as accurate as standard frames can be found in [5]. The depth of the electrode is read from the micropositioning device and converted into X, Y, and Z coordinates in preop CT coordinates . A set of pre-operative CT and MRI scans is acquired for each patient. CT and MRI volumes are acquired with the patient anesthetized and head taped to the table to minimize motion. Typical CT images were acquired at 120 kVp, exposure time of 350mAs and 512x512x256 voxels. In-plane resolution and slice thickness were approximately 0.5mm and 0.75mm respectively. 3D-SPGR MRI images (TR 12.2ms and TE 2.4ms) were acquired with a 1.5T Philips scanner. Typical MRI volumes consist of 256x256x170 voxels, with voxel resolution 1x1x1 mm³. Intra-operative stimulation data used in this study include efficacy assessment by a neurologist (expressed in percentage) at various points in the brain and the voltage at which the efficacy was observed. We used a total of 95 stimulation data points from 19 patients to build the maps shown in this study. 2.3 Justification for a Spherical Shell Kernel Butson et al [6, 7] have used diffusion tensor based finite element models (FEM) of electric field, coupled to multi-compartment cable axon models, to predict the volume of tissue activated by DBS as a function of the stimulation parameter settings. However, in the absence of diffusion tensor imaging data and sophisticated FEM solver software, a three dimensional Gaussian can be used to approximate the electric field. This is the model we have used in this work to generate field maps. At a point where stimulation response is evaluated, the stimulating voltage is increased from zero until a response is observed. The observation and the corresponding voltage are recorded. As voltage increases, the region affected by the electric field also grows. Therefore, a response that was observed at a certain voltage V2 but not at the previously tested lower voltage V1 occurs due to the activation of tissue in the region that was not activated by V1 but activated by V2. For example, in Fig. 1(b), Q is a point whose activation causes efficacy. With the electrode at P, the electric field does not reach Q at 1V or 2V and thus no efficacy is observed. But, at 3V the electric field activates Q to produce efficacy. Assuming isotropic tissue properties and the tip of the electrode as a point source, Q would exist on a circle whose radius is a function of the stimulation voltage. Therefore, all points inside this circle; including the point where the electrode is placed should have almost zero (if not zero) probability of causing the response. On the contrary, a Gaussian kernel centered at P, assigns the highest probability value to P itself and a smaller value to Q. Furthermore, in the absence of additional information, all points on the circle where Q lies can be considered to be equally likely to have caused the response and therefore should have equal probability. In 2D discrete space, Q would lie on an annulus kernel. In 3D space, the equivalent kernel can be visualized as the region between two concentric spheres; or as a spherical shell. Since intra-operative stimulation at our institution is provided using the tip of the cannula that holds the recording micro electrodes it is considered a point source suggesting isotropic field distribution in all three directions. A comparison of the two kernels in discrete 2D space is shown in Fig. 2. Both the kernels are normalized such that their values sum to 1 so that they represent a
A New Method for Creating Electrophysiological Maps for DBS Surgery
Q
P
1V
(a)
673
2V 3V
(b)
Fig. 1. (a.) A two dimensional Gaussian function, (b.) Diagrammatic representation of the extent of the electric field around a stimulating electrode for different stimulation voltages (1V, 2V and 3V). The electrode tip (located at the point P being tested) is assumed to be a point source. Stimulation of point Q results in reductions in symptoms (efficacy).
probability density function (pdf). All the values on the annulus (Fig. 2(b)) have equal probability. The radius of the outer circle of the annulus is the same as that for the trunc-Gaussian kernel (r1) and corresponds to stimulation voltage V Volt. The radius of the inner circle (r2) of the annulus corresponds to voltage (V – 1) Volt. Computing a precise relationship between the stimulation voltage (V Volt) and the distance (r mm) from the electrode up to which this voltage causes activation is difficult and requires knowledge of material conductivity, which varies from patient to patient.
(a)
(b)
Fig. 2. Example of (a) Annulus pdf kernel (b) Truncated Gaussian (trunc-Gaussian) pdf kernel
Here we rely on a heuristic approach, i.e., we define r = k*V, where k is some proportionality constant. By using various values of k from 0.25 to 3, we determined that k = 1 produced maps that correlated the best with the underlying anatomy. 2.4 Creation of Field and Efficacy Maps In order to minimize the variability among neurologists in their subjective assessment of efficacy, we included only those data points that recorded efficacies of at least 75% at 4V or less. Let P1 be a stimulation point with image coordinates (X, Y, Z) be one
674
S. Pallavaram et al.
such point. At our institution the assessment of efficacy by neurologists during DBS surgery is a personal subjective measure. It is expressed as percentage improvement in symptoms compared to the baseline measured at the beginning of the surgery or evaluation process. In order to reduce the variability in this subjective assessment across various neurologists, we have used a threshold of 75%. Our neurosurgical team agreed that a minimum assessment of 75% across various neurologists would in general represent good symptomatic relief. The 4V cutoff is used because the linear relationship assumed between V and r may not be valid at high voltages. Let Efficacy represent the percentage efficacy observed at P1 by applying voltage V. For the creation of a Gaussian kernel based field map, a truncated 3D Gaussian is placed at P1. Let Ω1 be the set of all points inside a sphere centered at P1 having a radius r1 mm (equation (1)). The value of the Gaussian kernel based map at any point with coordinates (x, y, z) in the image due to the observation at P1 is FP1(x, y, z) defined in equation (2). The map values FP1(x, y, z) are normalized so that they result in a probability density function (equation (3)).
Let :1
^(x, y, z) `
3
`
( x � X )2 � ( y � Y )2 � ( z � Z )2 d r12 , wherer1 V
{
⎧ ⎛ − ( x − X )2 + ( y − Y )2 + ( z − Z )2 1 ⎪ ∗ exp ⎜ ⎪σ ∗ 2 ∗ π ⎜ 2 ∗σ 2 ⎝ ⎪ FP 1 ( x , y , z ) = ⎨ when ( x , y , z ) ∈ Ω 1 ⎪ ⎪ ⎪ ⎩ 0, otherwise
(1)
} ⎞⎟
⎫ , ⎪ ⎟ ⎪ ⎠ ⎪ ⎬ ⎪ ⎪ ⎪ ⎭
(2)
FP1 (x, y, z)
FP1 (x, y, z) =
∑
(x′, y′, z′)∈Ω1
FP1 (x′, y′, z′)
(3)
For the same point P1, a spherical shell based efficacy map is created as follows. Let Ω 2 be the set of all voxels inside the spherical shell (equation (4)). Every point in
Ω 2 is assigned the same probability of causing the observed efficacy (equation (5)). :2
^( x, y, z) `
3
r22 � ( x � X ) 2 � ( y � Y ) 2 � ( z � Z ) 2 d r12
where r1 V and r2 r1 �1 ⎫ ⎪ ⎬ ⎪ ⎭ where n(Ω 2 ) is the number of elements in the set Ω 2 ⎧ 1 when ( x, y , z ) ∈Ω 2 ⎪ FP1 ( x, y , z ) = ⎨ n(Ω 2 ) ⎪ 0, otherwise ⎩
`
(4)
(5)
When multiple points P1, P2… PN are used in building a map, the overall efficacy map is defined as in equation (6). For any point with coordinates (a, b, c) in the image:
A New Method for Creating Electrophysiological Maps for DBS Surgery
F (a, b, c) =
⎞ 1 ⎛ N ∗ ⎜ ∑ F (a, b, c) ⎟ N ⎝ i =1 P i ⎠
675
(6)
Efficacy maps attain greater significance when they can be created for a new patient using data from a number of other patients. To create such a map for a new patient, efficacy data from a population of previously treated patients is first projected onto an atlas using non-rigid registration between each patient and the atlas. This data is then projected onto the new patient using non-rigid registration between the atlas and the new patient. Using these projected data points a map can be created on the new patient by the method described above.
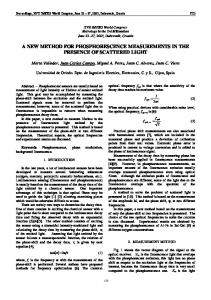
3 Validation Results and Discussion We simulated both Gaussian field maps and annulus based efficacy maps. The results are shown in Fig. 3. On a grid with voxel dimensions 0.5x0.5 mm2, Gaussian and annulus kernels were placed at measurement points (marked by gray circles) as shown in Fig. 3(a) and Fig. 3(b) respectively. Let the stimulation voltage at all the points be 2V. Thus, the radius of the Gaussian kernel was 2 mm (4 pixels). The outer radius of the annulus kernel was also 4 pixels while the inner radius was 2 pixels (equivalent to 1V). The two maps were created using the procedure described in section 2.4. Low probability values are represented by dark pixels while higher probability values are represented by brighter pixels. It would be expected from the positions of the points that stimulation response observed at each of the points is likely due to stimulation of the common region enclosed by the points (shown by large dotted circle). This is exactly what the annulus map suggests. The figure also shows that the field map does not permit localizing this point easily. On a number of real patient datasets (not shown here for lack of space), our neurosurgical team has validated the spherical shell based maps and concluded that their locations are anatomically valid. We have also started a prospective study where we create an efficacy map for a patient undergoing surgery and validate it as the surgery progresses. Two such maps created for recent surgeries are shown in Fig. 4. Low probability of efficacy values are represented by dark pixels while higher probability values are represented by brighter pixels. It can be seen that these spherical shell efficacy maps overlap well with the location where the implant was placed. The four contacts of the Medtronic 3389 implant are shown as four squares with the center of the implant (mid-point of the four contacts) labeled as the final electrode position (FEP). The point marked planned target refers to the target selected manually by the neurosurgeon preoperatively based on anatomical information (the efficacy map was not presented to the surgeon at the time of planning). Atlas predicted target refers to the point selected by the atlas using the method proposed by D’Haese et al [8]. It can be seen that at least two contacts of the implant are inside the hot zone (brighter areas) of the efficacy maps. In Fig. 4(b), it can be seen clearly that the planned target was outside the efficacy zones in the map, but intraop adjustment moved the final implant position inside the map. Similar results are shown in
676
S. Pallavaram et al.
(a)
(b)
Fig. 3. Simulation of maps using (a) Gaussian kernel, (b) annulus kernel; on a grid with voxel dimensions 0.5x0.5 mm2. At each measurement point (marked by a gray circle) efficacy is assumed to be recorded at 2V. The maps are created using the method described in section 2.4. Low probability values in the map are in dark while higher probability values are brighter.
PLANNED TARGET
ATLAS PREDICTED TARGET
FINAL ELECTRODE POSITION
FINAL ELECTRODE POSITION
PLANNED TARGET
(a)
(b)
PLANNED TARGET
(c)
ATLAS PREDICTED TARGET
FINAL ELECTRODE POSITION
(d)
Fig. 4. Spherical shell efficacy maps overlaid on patient MRI T1 coronal slices aligned to the axis of the Medtronic 3389 implant. The center of the implant (final electrode position - FEP), the planned target and the atlas predicted target are marked. (a) Left STN, (b) Right STN for one patient. For right STN on another patient (c) planned target, (d) FEP. Low probability values in the map are shown as dark while higher probability values are brighter.
Figs. 4(c) and 4(d) for another patient. However, it can be seen that the FEPs in the figures are still not centered on the efficacy maps. One of the reasons is that the final implant is placed at a location where efficacy is high at low voltage but also where side effects occur (if any) at higher voltages. Therefore, we are generating side effect
A New Method for Creating Electrophysiological Maps for DBS Surgery
677
maps using the same method described in this paper to use them in combination with the efficacy maps. Another reason could be intra-op brain shift. We are evaluating its significance and working on accounting for it while generating such maps. Submission rules for the conference required us to submit the manuscript in black and white. On a color scale the maps present more detailed information on the locations and topologies of high efficacy spots. These results, albeit preliminary, show that accurate efficacy maps superimposed to anatomic images could be of value when planning DBS surgery.
4 Conclusion In this work, we have shown that Gaussian kernels are not the best choice to create electrophysiological maps from discrete stimulation data points recorded during surgery. We have proposed a new spherical shell kernel consistent with the cause and effect relationship between stimulation and the response observed. Our simulation results confirm that spherical shell kernels are better than Gaussian kernels. On a number of real patient datasets, our neurosurgical team has validated the spherical shell based maps and concluded that their locations are anatomically valid. We also show the performance of our new maps on real patient data and report on a prospective study we have started to further validate our maps and to test their value as preoperative planning and intra-operative guidance tools. The framework provided here can also be used to create side effect maps, which are under construction. If accurate and patient-specific efficacy and side effect maps can be produced, the selection of the optimal DBS target will be greatly facilitated.
References 1. Plaha, P., et al.: Stimulation of the caudal zona incerta is superior to stimulation of the subthalamic nucleus in improving contralateral parkinsonism. Brain 129(7), 1732–1747 (2006) 2. D’Haese, P.-F., et al.: Deformable Physiological Atlas-Based Programming of Deep Brain Stimulators: A Feasibility Study. In: Pluim, J.P.W., Likar, B., Gerritsen, F.A. (eds.) WBIR 2006. LNCS, vol. 4057, pp. 144–150. Springer, Heidelberg (2006) 3. Guo, T., Parrent, A.G., Peters, T.M.: Automatic target and trajectory idetification for deep brain stimulation (DBS) procedures. In: Ayache, N., Ourselin, S., Maeder, A. (eds.) MICCAI 2007, Part I. LNCS, vol. 4791, pp. 483–490. Springer, Heidelberg (2007) 4. Rhode, G.K., Aldroubi, A., Dawant, B.M.: The adaptive bases algorithm for intensity-based nonrigid image registration. IEEE Trans. On Medical Imaging 22(11), 1470–1479 (2003) 5. Fitzpatrick, J.M., et al.: Accuracy of Customized Miniature Stereotactic Platforms. Stereotactic and Functional Neurosurgery 83, 25–31 (2005) 6. Butson, C.R., McIntyre, C.C.: Role of electrode design on the volume of tissue activated during deep brain stimulation. Neural Eng. 3, 1–8 (2006) 7. Butson, C.R., McIntyre, C.C.: Current steering to control the volume of tissue activated during deep brain stimulation. Brain Stimulation 1, 7–15 (2008) 8. D’Haese, P.-F., et al.: Computer-Aided Placement of Deep Brain Stimulators: From Planning to Intraoperative Guidance. IEEE Trans. on Medical Imaging 24(11), 1469–1478 (2005)