have shown to fool most commercial fingerprint systems. This paper proposes a new method of anti-spoofing using reliable liveness detection. The proposed ...
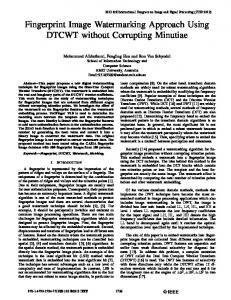
A New Method for Fingerprint Antispoofing using Pulse Oximetry P. Venkata Reddy, Ajay Kumar, S. M. K. Rahman, Tanvir Singh Mundra Biometrics Research Laboratory Department of Electrical Engineering Indian Institute of Technology Delhi, New Delhi, India live human being who was originally enrolled in the system and not just any live human being. Many users believe that the current biometric systems can detect liveness in the presented biometric. Some manufacturers of biometric system also claim to have liveness detection in their system. It has however been shown that fingerprint systems can be fooled with artificial fingerprints, that static facial images can be used to fool face recognition systems, and that static iris images can be used to fool iris recognition systems [5]. 2. PROPOSED SYSTEM The block diagram of the proposed anti-spoofing system for online liveness estimation is shown in figure 1. The most important part of the system is the pulse oximeter sensor, which will be having a mechanism with a finger and two LEDs for emitting different wave lengths of light, red (660nm) and near infra-red (940nm).
1. INTRODUCTION Near IR 940 nm
Timing & Control
Amp
Channel Separation Enrolled Fingerprint
Visible Red 660 nm
Recent researches and tests show that with negligible-tomodest effort many leading biometric technologies are susceptible to attacks in which fake fingerprints, static facial images, and static iris images can be used successfully as biometric samples. These fraudulent samples are processed by the biometric system to generate templates and to verify enrolled individuals. Methods of attack include fashioning fingerprints from gelatin, superimposing iris images atop human eyes, even breathing on a fingerprint sensor. All biometrics are vulnerable to spoofing from the smartly faked copies. • Hand Geometry and Palm print acquisition devices can be easily spoofed. • Biometric samples are vulnerable to spoof attacks and should no longer be considered a secret. • The survival of biometric identification technologies will depends on its ability to reject fake samples. The answer to the above problems lies in Liveness Detection Countermeasures. The objective of our work is to introduce a new capability in the biometric system to detect during enrollment and identification or verification, whether the biometric sample presented is alive or not. Furthermore, since our system is designed to protect against the attacks from artificial fingerprints, it must also check that the presented biometric sample belongs to the
Driver
Photo detector
Abstract - The deployment of fingerprint sensors is increasingly becoming common and has now gained high user acceptance. However, fingerprint sensors are susceptible to spoofing using artificial materials or in worst case to the dismembered fingers. Fake/gummy fingerprints have shown to fool most commercial fingerprint systems. This paper proposes a new method of anti-spoofing using reliable liveness detection. The proposed method of liveness detection is based on pulse oximetry and involves the known source of light originating from a probe at two wavelengths. The light is partly absorbed by haemoglobin, by amounts which differ depending on whether it is saturated with oxygen or deoxygenated haemoglobin. We then perform the computations for the absorption at two wavelengths to estimate the proportion of haemoglobin which is oxygenated. The computed percentage of oxygen in the saturated blood, along with the heart pulse rate, determines the liveness of enrolled biometric. Our experimental results demonstrate that the developed prototype can successfully thwart the spoof attacks (including those based on dismembered fingers).
Signal Processing
Calculate O2% & Heart beat rate fhb
O2% & fhb are normal
Live
Spoof
Figure 1: Block diagram of the proposed anti-spoofing system
The pulses generated by the timing and control circuit are given to the driver circuit, which drives the two sources of light. These sources are excited alternatively at high speed. The matched photo detector detects the reflected signal and the photo current is converted into voltage by current to voltage converter. The voltage signal corresponding to each reflected light is being separated by channel separation mechanism in synchronization with the emitted light pulses. The separated signals are filtered to remove noise and unwanted high frequency components and are further processed to get the AC and DC
components in each signal. These components are used to estimate R, which we refer as Liveness Factor in this paper. The Liveness Factor is essentially the representation of the proportion of oxygen saturated blood (SPO2%) and is detailed in the following section. The magnitude of R is compared with the threshold to decide the liveness of the introduced biometric sample.
I = I 0 e −ε ( λ ) cd
(1)
The arterial SpO2 is a parameter measured with oximetry and is normally expressed as a percentage. The difference in the absorption spectra of HbO2 and Hb can be utilized for the measurement of arterial oxygen saturation in vivo. The wavelength range between 600 nm and 1000 nm is also the range for which the attenuation offered by the body tissues is minimal. The intensity of light transmitted through the arterial blood decreases logarithmically with path length, as illustrated by the Beer-Lambert law [6], if we assume that transmission of light is only influenced by the relative concentrations of HbO2 and Hb and their absorption coefficients at the two measurement wavelengths. If the artery is of length la through which light, initially of intensity Iin is passed, then this law suggests that:
I 1 = I 1in * 10 − ( α 01 C 0 + α r 1 C r ) l a I 2 = I 2 in * 10 − ( α 02 C 0 + α r 2 C r ) l a
4. SIGNAL ACQUISITION AND FILTERING The fast Pulse Width Modulation (PWM) mode of AT90USB1287 [10] provides a high frequency PWM waveform generation option. The PWM channe1 with the Timer1 is programmed by loading the Output Compare Registers (OCR1A and OCR1B) to generate a PWM pulses with ON time of 500 µs and OFF time of 7500 µs, the clock count is started with the time period of 8msec. PulseOximeterSensor VCC
To ADC
7
+
1
+ -
6
3 2
11
-
5
(2)
where, C0 is the concentration of oxyhaemoglobin (HbO2), Cr is the concentration of reduced haemoglobin (Hb), αon is the absorption coefficient of HbO2 at wavelength λ1 and αrn is the absorption coefficient of Hb at wavelength λ2. The I1 and I2 represent the intensity of light at wavelengths λ1 and λ2 respectively. With the light at 660 nm, deoxygenated haemoglobin has a higher absorption, whereas at 940 nm, oxygenated haemoglobin has a higher absorption. Once the absorption
VCC 1
]
6 5 4 3 2 1
2
6 5 4 3 2 1
HbO 2 + HbO
COMAnode
1
[Hb
where, I0 is the original intensity of the light, ε(λ) is the extinction coefficient of absorbability at a specific wavelength λ, c is the concentration of the substance absorbing the light, and d is the optical path length. The pulsatile flow of arterial blood results in the varying component. The pulsatile flow occurs at the cardiac cycle systole phase and the light absorption varies proportionately to the flow of blood. This varying component due to absorption of light through tissue is called the pulsatile component and it is the "AC" component. The AC component is proportional to the absorption of the change in the volume of arterial blood flow. Therefore, AC component represents the absorption of light by oxygenated and deoxygenated haemoglobin of the arterial blood. The DC component in the reflected signal is affected primarily by the absorption of light due to tissue bed, venous blood, non pulsatile arterial blood and the intensity of the light from the incident source, ambient light. The number of beats per minute is calculated, yielding the pulse rate.
2
The liveness detection method proposed and implemented in this paper is based on pulse oximetry, in which the saturation of oxygen of haemoglobin is measured; heart pulse from the tip of the finger is detected; and used as liveness detection. The absorption of visible light by a haemoglobin solution varied with oxygenation. This is because the two common forms of the molecule, oxidized haemoglobin (HbO2) and reduced haemoglobin (Hb) have significantly different optical spectra in the wavelength range from 500 nm to 1000 nm [2]. The oxygen chemically combined with haemoglobin inside the red blood cells makes up nearly all of the oxygen present in the blood. The oxygen saturation SpO2 is defined as the ratio of oxyhaemoglobin (HbO2) to the total concentration of haemoglobin present in the blood.
(3)
4
3. LIVENESS DETECTION
SpO 2 =
levels are detected, it is possible to determine the ratio of the absorption between the deoxygenated and oxygenated haemoglobin at the different wavelengths. The photons from the emitter pass through the skin. Although, some scattered light escapes through the finger, it will be assumed that the light emitted is absorbed solely by the anatomy of the finger and the photo detector [5].
1 REDLED 3
PWM RED
2 1
3
1 IR LED
2 1
PWM IR
Figure 2: Implementation of PWM and signal acquisition
Emitter of the sensor gets the excitation signal from the PWM output at I/O port pins PB6 and PB4 of AT90USB1287. In order to increase the intensity of light that the emitter of the pulse oximeter sensor can emit, an increased amount of current is passed through the sensor for a short duration of time. The timer pulses (figure 2) are given to the base of the driving transistor through a series capacitor, which acts as a high pass filter, to protect the sensor from being spoilt by controller hang-up.
makes the averaging of 10 neighborhood samples. The samples from the acquired signal are also reproduced in figure 5. The convolution of the red and infra-red samples, sequences with the filter sequence gives a moving average filtered sequence by removing the noise components.
y[n] = x[n]Θh[n]
(4) where, y[n] is the filtered sequence, x[n] is the input sequence, and h[n] is the impulse response of the low pass filter. 5. IMPLEMENTATION 5.1 AC-DC components Extraction
Figure 3: Development of interfacing board The matched photo detector detects the light in the range 300-1100 nm and it has its peak response at 660 nm and 940 nm. The signal from the matched photo detector corresponding to red (660 nm) wavelength light has to be separated from the infra-red (940 nm) wavelength light without intervention. This is achieved by synchronization between the emitter excitation and the acquiring of detected signal. The time duration between the 660 nm pulse and the 940 nm excitation pulse is 500 µs with 660 nm pulse followed by 940 nm. The photo current is converted into voltage by a current to voltage converter. This voltage signal comprises of high frequency components i.e. signals due to noise induced by ambient light. The high frequency noise is removed by low pass filtering with a cutoff frequency of 1.59 kHz. The signal after low pass filtering is given to one of the ADC channels with a buffer in between to decrease the loading effect. The on-chip ADC is a successive approximation analog to digital converter, with a reference voltage of 2.56 V and a conversion time of 70 us. 4.1 Filtering The smoothing filter is to be applied to remove the noise components from the digital samples corresponding to the acquired signals. In the implemented process a filter sequence of 10 samples is taken, each value of 0.1 which
The AC and DC component extraction in the filtered samples for red (660 nm) and infra-red (940 nm) includes measuring the minimum and maximum values of the samples. The difference of minimum and maximum is calculated and this is the peak to peak amplitude of each sequence. The average of the samples in each case is calculated for both the sequences which represent the absorption of light due to tissue, fat and non pulsatile part of the haemoglobin. The peak-to-peak amplitudes contribute to the AC component of the signals and some part of the DC components. These are AC660, DC660, AC940 and DC940 and are calculated as follows: vm = vp − p ;
vdc = v min + vm / π ; vac = vm / 2 ;
(5)
νac and νdc are the AC and DC components of the samples. 5.2 Calculation of R In order to determine the Liveness Factor R, from the pulsatile light intensities to non-pulsatile light intensities, the constant DC component of the light intensity must be factored out. The amplitudes of both the AC and DC components are dependent on the incident light intensity. Dividing the AC level by the DC level gives a ‘corrected’ AC level that is no longer a function of the incident light intensity. Thus the Liveness Factor R, as illustrated in equation 6, is an indicator of arterial SpO2. The AC component at each wavelength divided by the DC component at the same wavelength results R, which is uniquely related to the arterial saturation of haemoglobin. The ratio of the AC and DC components for the red (660nm) and infra-red (940nm) is measured with the following equation.
R =
( AC 660 ( AC 940
/ DC 660 ) (V AC / V DC )r = / DC 940 ) (V AC / V DC )ir
(6)
VAC and VDC are the AC and DC components for red (660 nm) and infra-red (940 nm) samples correspondingly. The Liveness Factor R essentially represents the saturated
oxygen (SPO2%) in haemoglobin. An empirically derived calibration curve [1] for the relationship between R and SaO2% provides the pulse oximetry oxygen saturation level SpO2%.
6. RESULTS
5.3 Integration by Negotiation The decision on liveness of the introduced sample by the liveness detection device (host controller) determines whether the negotiation has to be done or not. If the host controller decision is live then the activation of the fingerprint device is performed. If the decision is non-live the activation for the fingerprint device to capture the finger print and Identification is not being done. In the process of the activation of the fingerprint sensor the host controller communicates with the fingerprint device by a full-duplex serial communication protocol for initialization of the finger print device and performing the operation specified by the command in the command field of the packet sent by the host controller. 5.4 Setting up Communication
the
fingerprint
Success, or Failure, or Capture Timed out from the fingerprint device then it determines whether the user is to be accepted or rejected.
device
for
The fingerprint sensor is powered up by the power source of 5V which comes either from the USB bus power or external power supply. One of the RS232 channel is connected to the serial interface of the host controller (liveness detection device). The RS-232C communication setup is with a baud rate 9600 bps (1 start-bit, 8 data-bits, 1 stop-bit and no parity bit). The fingerprint device performs an action given by the command in the command field of the packet sent by the host controller. Each acknowledgement packet is compared with the predefined packets to determine the response from the finger print sensor. If the host controller gets the Identification
The implementation of the proposed liveness detection module was carried out as detailed in section 4-5. This device was integrated with the available fingerprint sensor. The rigorous testing results from the implemented system have illustrated the success of the device in detecting spoof attempts. In order to ascertain the promising features, some of the experimental results and observations from the developed system are reproduced in this section. The acquired signal samples for an interval of 1.6 seconds for the Live and Non-Live cases are shown in the figure 4. These samples are having superimposed noise which causes small variation in the envelope of the signal and which was taken care by applying averaging filter with 10 samples to smooth the acquired signal. With the smoothing filter the signal is good to measure AC and DC components. In the Live case the presence of heart pulse along with the change in amplitude with the IR and Red signals results in variation of the signal. But in the case of Non-Live the pulsing nature of the signal is absent and the variation in the samples is very less. The AC values for the Non-Live case are not varying even with slight change in the position of its placement. The experimental results in table 2 suggest the regular variation in the AC and DC components among different persons from the Live fingerprints. However, the relative change between IR and Red is quite small among different live fingerprints and therefore a threshold of 30% is judicious. The AC and DC components for the Non-Live are also displayed in table 1.
igna using Live and Non-Live samples
Figure 4: Unfiltered and filtered samples from red and infra-red signal using Live and Non-Live samples
The Liveness Factor R calculated using (6) with Nonlive samples is very high and it doesn’t come within the range of R values from Live samples. The AC and DC component from live samples are in a far different range from with non-live samples, especially with IR light as it is color independent and varies very little. This is despite the fact that the reflected light from red light is color dependent on the sample and changes the factor R calculated by equation (6). The estimated R expected is the non-live range from the non-live samples and cannot fall below the threshold, which is empirically selected as 3.0 for R at 3.0 and its corresponding SPO2% at 30% as shown in figure 5. 7. CONCLUSIONS Figure 5: Live Vs Non-live estimation of SPO2%
values in an interval of 22 seconds
A new anti-spoofing technique for fingerprint identification systems, using liveness detection has been proposed and implemented. The proposed liveness
detection technique is based on the physiological behavior of the arterial blood volume and oxygen saturation level changes (principle of pulse oximetry). The oxygen saturation level of arterial blood (SPO2%) is measured and which is taken for the liveness decision of an introduced sample. This Liveness detection is integrated with the fingerprint device to develop a standalone liveness integrated fingerprint sensor. As a first step the design and development of a device for liveness detection is considered and as a second step the integration with fingerprint sensor is illustrated. In our earlier design of the prototype device for liveness detection, an analog approach was investigated. However, with analog components the response of the device was very sluggish, due to the slow charging of the capacitors at the low pass filter stages, and the complexity of the device was high to extract a low amplitude biomedical signal in the presence of noise. The phase shift between the red and infra-red signals has been the cause to introduce the peak detectors, which are causing the response to be slow when the capacitor charged to a peak level has to come back. In order to speed up the response and to facilitate the integration with the fingerprint sensor the implementation was initiated using the microcontroller. We firstly began the integration of this device using the ATtiny861V microcontroller and ATSTK500 as the programmer, and implemented the entire steps of signal processing for the acquired signals and filtering to remove the associated noise. The standalone implementation using AT90USB1287 Microcontroller has been rigorously tested. In order to make the device standalone, and to integrate with the fingerprint sensor, an interfacing programming board shown in figure 3 was developed. The integration of this device with the fingerprint device is achieved by serial communication with this device and the decision of the fingerprint identification is being delivered to the host controller (AT90USB1287). The percentage of SPO2 for the live fingers was observed from several live (18) persons and non-live gummy fingers (7) which was used to estimate a reliable threshold to reject non-live fingerprints. The developed device detects the liveness based on the SPO2% and decides to activate the fingerprint sensor for fingerprint identification for live samples and deactivates the sensor for non-live samples. This device also displays the fingerprint identification status. The gummy fingers employed in the experiments are made with the play-doh and the M-Seal as mold by a simple procedure. Conclusively, the developed prototype of the liveness detection module, which is based on the estimation of the saturated oxygen level in the haemoglobin, has significantly higher anti-spoofing reliability as compared with several image or illumination based approaches, e.g. [11]-[12], presented in the
literature. Our efforts are currently focused to miniaturize the liveness detection module. 8. ACKNOWLEDGMENT This work is supported by the research grant from Department of Information Technology, Ministry of Information and Communication Technology, Government of India, grant no. 12(54)/2006-ESD. 9. REFERENCES [1] M. Drahansky, R. Notzel and W. Funk, “Liveness Detection based on Fine Movements of the Fingertip Surface”, Proc. IEEE Workshop on Information Assurance United States Military Academy, West Point, pp. 42-47, NY, Jun. 2006. [2] A. B. Borreto, L. M.Vicente and I. K. Persad, “Adaptive Cancellation of Motion Artifact in Photoplethysmyographic Blood Volume Pulse Measurements for Exercise Evaluation,” Proc.IEEE 17th Annual Conference on Engg. in Medicine and Biology Society, vol. 2, pp. 983-984, 1995. [3] S. T. V. Derakhshani, R. Hornak, L. A. Parthasaradhi and S. A. C. Schuckers, “Time-series detection of perspiration as a liveness test in fingerprint devices” IEEE Trans. systems, man, and cybernetics, vol.35, no.3, pp. 335 – 343, Aug. 2005. [4] N. K. Ratha, “Enhancing security and privacy inbiometricsbased authentication systems, “IBM Syst. J., vol. 40, no. 3, pp. 614–634, 2001. [5] T. Matsumoto, H. Matsumoto, K. Yamada, and S. Hoshino, “Impact of Artificial Gummy Fingers on Fingerprint System”, Proc. SPIE, vol. 4677, pp. 275-289, 2002. [6] Y. Shimada, K. Nakashima, Y. Fujiwara, T. Komatsu, M. Kawanishi, J. Takezawa and S. Takatani, “Evaluation of a new reflectance pulse oximeter for clinical applications”, J. of Med. & Biol. Eng & Comp., vol. 29, pp. 557-561, Sep. 1991. [7] H. Shimazu, H. Ito, and K.Yamakoshi, “Noninvasive method for estimating the mean capillary pressure and pre- and post capillary resistance ratio in human fingers”, Medical & Biological Engineering & Computing, vol. 24, pp. 585-590, 1986. [8] T.Vander Putte and J. Keuning, “Biometrical fingerprint recognition: don't get your fingers burned”, Proc. of IFIP TC8/WG8.8 Fourth Working Conference of Smart Card Research and Advanced Applications, pp. 289-303. Kluwer Academic, Sep. 2000. [9] Barbagelata, Melissa and H. Asada, “Wireless Fingernail Sensor for Continuous Long Term Health Monitoring”, MIT Home Automation and Healthcare Consortium Phase 3, Report 3-1, Oct. 1, 2000. [10]http://www.atmel.com/dyn/resources/prod_documents/doc75 93.pdf [11] K. Brownlee, Method and apparatus for distinguishing a human finger from a reproduction of fingerprint, US Patent No. 6, 292, 571, Sep. 2001. [12] D. R. Setlak, Fingerprint sensor having spoof reduction features and related methods, US Patent No. 5, 953, 441, Sep. 1999.