A NEW METRIC FOR STOCHASTIC LANGUAGE MODEL EVALUATION Akinori Ito †, Masaki Kohda † and Mari Ostendorf † Yamagata University 4-3-16 Jonan, Yonezawa 992-0038 Japan {aito,kohda}@ei5sun.yz.yamagata-u.ac.jp ABSTRACT Though Perplexity shows good correlation with word error rate within simple n-gram framework like Wall Street Journal task, it has been reported that perplexity have poor correlation with WER when more complicated LM is used. In this paper, a global measure for language model evaluation is proposed which achieves higher correlation between word accuracy. The metric is based on difference of LM score between a word in the evaluation text and the word that gives the maximum score at that context. Two experiments were carried out to investigate the correlation between word accuracy and the proposed measure. In the first experiment, LMs in this paper were created using n-gram adaptation by n-gram count mixture. 47 LMs were created for the experiments by changing mixture weight and vocabulary cut-off threshold. Correlation betwen perplexity and word accuracy was very poor (correlation coefficient -0.36). On the other hand, the proposed metric gave much higher correlation (correlation coefficient 0.82). In the second experiment, a simple mixture trigram model was employed to recognize Switchboard task data. The highest correlation between word accuracy and the proposed method was 0.81, which was much higher than the correlation between PP and accucary 0.59. 1. INTRODUCTION In the field of language model research for continuous speech recognition, goodness of an LM have been measured by the inverse of average word occurrence probability, i.e. perplexity. Perplexity shows good correlation with word error rate within simple n-gram framework like WSJ task. However, it was reported that perplexity has poor correlation with WER when more complicated LM is used [2,4]. Several efforts have been done for finding better alternatives of perplexity. In [2], decision-tree based evaluation metric is proposed and the metric has very good correlation between WER improvement. One problem with this metric is that this metric incorporates many factors such as word length, relative difference in word n-gram likelihood for different n, etc. This methodology makes it difficult to understand what factor is important for evaluation. Moreover, as the tree is obtained by learning from the data, it is
‡
‡ Boston University 8 Saint Mary’s St., Boston MA 02416 USA
[email protected] unclear whether the tree can be used for any other LM. In [4], Chen et al. proposed a metric called M-ref , which is based on likelihood-error curve of words learned from data. They proposed another method to estimate WER based on simulation of speech recognition process. Both methods outperformed perplexity to predict WER from linguistic feature.However, they stated that other than WER itself is not useful because correlation between a metric and WER is not perfect. We think perplexity is quite insufficient to predict WER, but we don’t think an LM should be evaluated only through recognition experiment. An evaluation metric of LM which uses only linguistic feature is indispensable for LM development. For example, mixture model and cache model combine different models using coefficients, which are optimized to minimize perplexity calculated from heldout data. If any metric other than WER would not be useful, these optimization could be done only by thousands of recognition experiments. In this paper, we propose another metric for evaluation of LM. This metric is based on difference of LM score between a word in the evaluation text and the word that gives the maximum score at that context. The difference is normalized using the standard deviation of the probability, and a sigmoid-like function is applied to the normalized difference. We carry out experiments using simulated and real data to see correlation between PP, the proposed metric and WER. 2. EXPERIMENTAL PARADIGM We carried out two kinds of experiments. The first one (experiment 1) used very small corpora for in-domain text, plus an out-of-domain text consists of 96K words. These texts are mixed using n-gram count mixture. Then simulations of speech recognition were carried out using phoneme sequences with error and phoneme error probability [5]. The second experiment (experiment 2) used Switchboard corpus as an in-domain corpus and CNN news text as an out-of-domain text. After creating trigram models for each text, these models were combined linearly (n-gram level mixture [3]). N-best recognition hypotheses obtained from BBN speech recognizer were rescored according to the mixture model.
2.1. Experiment 1 Transcriptions of dialogs from ASJ continuous speech database were used for the experiment 1. Four dialogs about sightseeing information task for Kyoto city were selected for adaptation and evaluation texts. The rest of transcriptions are used as an out-of-domain (OOD) text. Numbers of sentences and words for each text are shown in Table 1. LMs in this report are created using n-gram adaptation by n-gram count mixture [5]. This adaptation method creates LM from large OOD text and small in-domain text (ID text). let N o (x) be the number of occurrence of string x in the OOD text, and N i (x) be that in the ID text. Using mixture weight W, relative frequency of a word w at a context h is calculated as N (hw) + W N i (hw) f (w|h) = o . N o(h) + W N i (h) P(w|h) is calculated based on this relative frequency. Before the two n-gram counts are mixed, vocabulary restriction is applied for both texts. Using threshold count To and Ti for OOD text and ID text respectively, words in each text with fewer occurrence than the threshold are replaced with the single symbol UNK. The language models in this experiment were trigram models with Witten-Bell discounting. Weights and vocabulary restriction thresholds used in the experiments are shown in Table 2.
Table 1. Corpora used for the experiment 1 #sentence
#word
kind of words
3000
96776
3593
adaptation text
341
3976
569
evaluation text
117
1542
328
OOD text
Table 2. Mixture weights and vocabulary restriction thresholds TI
TA
weight
TI
TA
weight
4,8,12
1
1
18
2
1
Switchboard corpus was used as in-domain text for the experiment 2. For the out-of-domain text, we used CNN news corpus. Table 3 shows number of sentences and words of each corpora. Two trigram models with WittenBell discounting were created from each corpora and they were combined linearly: P(wi |wi − 2 wi − 1) = λPi (wi |wi − 2 wi − 1) + (1 − λ)Po(wi |wi − 2 wi − 1) where Pi was trigram probability from the in-domain model and Po was that from out-of-domain model. Eleven language models are created by changing λ from 0 to 1 by 0.1. Using these mixture models, n-best rescoring was carried out onto 100-best recognition result obtained by BBN Byblos system [1] with bigram LM. The word accuracy for the n-best data without rescoring was 53.9%.
2
4
4
8
4
1
16
2
32
8
1
64
2
128 18
1
Word accuracies for each language model were obtained through speech recognition simulation. We prepared phoneme symbol sequences of each test sentence, and gave 13% error according to phoneme confusion matrix. One-pass algorithm based decoder calculated recognition result from these phoneme sequence using the confusion matrix instead of acoustic models. Vocabulary size was 800. 2.2. Experiment 2
2
10
1
1
2
2
12
4
64
12
-
1
1
16
2
32
4
64
8
128 Table 3. Corpora used for the experiment 2 #sentence
#word
2189437
35986571
adaptation text
165003
2276027
evaluation text
684
7744
OOD text
3. A NEW MEASURE: WORD-BY-WORD SCORE DIFFERENCE 3.1. Definition of a new measure Let Pc (wi |wi − 2 wi − 1) be Pc (wi |wi − 2 wi − 1) = maxP(w|wi − 2 wi − 1). w w ≠
i
Pc (wi |wi − 2 wi − 1 ) is the best probability at context wi − 2 wi − 1 for other than wi. If P(wi|wi − 2wi − 1) is the best probability at context wi − 2 wi − 1, Pc (wi |wi − 2 wi − 1) is the second best probability. Otherwise, Pc (wi |wi − 2 wi − 1) is the best probability at
context wi − 2wi − 1. It is obvious that linguistic competitors of wi have probabilities of Pc(wi |wi − 2wi − 1) or lower. Using this ‘the competitor’s probability’, let us define d(wi |wi − 2 wi − 1) = logP(wi |wi − 2 wi − 1) − logPc (wi |wi − 2 wi − 1)
We used simple threshold function as f .
{
t1 if t1 < x
t1 x t2
Figure 1. Threshold function
85 84 83 82 81 80
word accuracy (%)
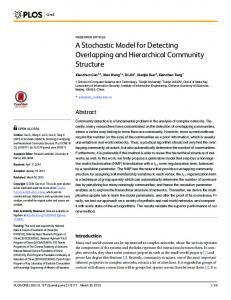
d(w |w w ) i i−2 i−1 G(f ) = 1∑ f ni σL where σL stands for the standard deviation of logP(wi |wi − 2 wi − 1), and f ( x ) is an arbitrary function. The role of f (x) is to evaluate the effect of the score difference to word accuracy. For example, if d(wi |wi − 2 wi − 1) had large positive value, wi would be recognized correctly. Therefore, further improvement of d(wi|wi − 2wi − 1) would not contribute to word accuracy improvement. The same argument can be applied when d(wi|wi − 2wi − 1) is negative. This aspect can be incorporated into the evaluation using sigmoid-like function as f (x).
f(x;t1 ,t2 )
f (x; t1, t2 ) = x if t2 ≤ x ≤ t1 t2 if x < t2
4.5
This function has two thresholds t1 and t2, where t1 is the upper threshold and t2 is the lower threshold. Figure 1 shows this function.
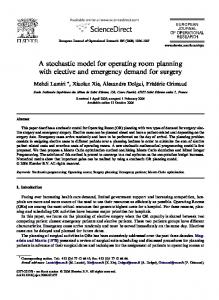
5.5 PP
6.0
6.5
Figure 2. PP vs. word accuracy Correlation coefficient
Though these thresholds were found through experiments in this paper, these thresholds should be determined from parameters of speech recognition system. Although any evidence has never been obtained yet, we predict that the upper limit t1 is relevant to variance of acoustic model and language model weight, and the lower limit t2 is relevant to beam width of a decoder, or number of n-best candidate for rescoring.
5.0
0.82 0.80 0.78 0.76 0.74 0.0
0.5
4. EXPERIMENTS
1.0
1.5
t1
4.1. Experiment 1
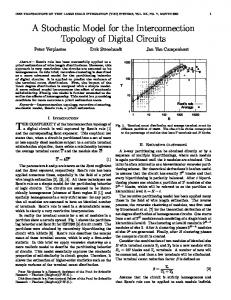
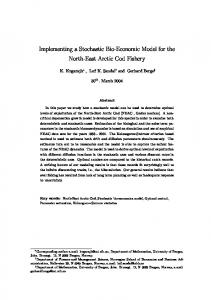
To investigate the relationship between the new measure and word accuracy, we started with t2 = − ∞ and changed only t1. Relationship between t1 and correlation coefficient is shown in Figure 3. From this result, it was found that t1 = 0.8 was optimum. Then we searched the optimum point changing t1 and t2 simultaneously. Figure 4 shows the relationship between t1, t2 and correlation coefficient. Figure 5 shows the correlation between word accuracy and G(f (x; 0.8, − 2.8)), which is the best case. Correlation coefficient at this point was 0.82.
Figure 3. Relationship between t1 and correlation coefficient
0.820
Correlation Coefficient
Sentence recognition experiments were carried out for each language model, changing language model weight from 0.8 to 15. Insertion penalty was not used. From results of the experiments, highest word accuracy was chosen for each language model. Figure 2 shows the correlation between perplexity and word accuracy. They had almost no correlation.Correlation coefficient between PP and accuracy was -0.36.
0.815 0.810 0.805 0.800 0.795 0.790 -2.5
0.5
0.816 0.6
0.7
0.8
t1
0.9
1
11 0.8 .807 3 0 .80 0 1.1 1.2
-3
t2
Figure 4. t1, t2 and correlation coefficient
word accuracy (%)
56.0 55.5 55.0 54.5 0.0
-0.65
-0.6 -0.55 -0.5 G(f (x; 0.8, − 2.8))
0.2
-0.45
0.4
λ
0.6
0.8
1.0
Figure 6. n-gram mixture weight λ and word accuracy
4.2. Experiment 2 N-best rescoring experiment was carried out using mixture trigram model. Language model weight and insertion penalty were optimized for each model. According to the optimization result, language model weight 17 and insertion penalty -15 were chosen, which gave the best word accuracy 55.8% at λ = 0.2. Figure 6 shows the relationship between n-gram mixture weight λ and word accuracy. As shown in Figure 7, correlation between PP and word accuracy was poor (Correlation coefficient 0.59). Then the proposed measure was calculated with various t1 and t2. The best correlation 0.811 was obtained when t1 was 3.1 and t2 was -0.1. Figure 8 shows the relationship between G(f ( x; 3.1, − 0.1)) and word accuracy. When language model weight 11 and insertion penalty -10 was used (which gave the second-best accuracy 55.7% at λ = 0.5), correlation coefficient 0.934 was obtained at t1 = 4.2 and t2 = − 0.6. The optimum t1 and t2 for experiment 1 and 2 were very different. It seems that this difference is caused by the difference of decoding and rescoring, but it is still unclear what determines these thresholds. 5. CONCLUSION A new measure is found which has high correlation to word accuracy. As it is easy to calculate for n-gram model, it is promising measure as an alternative of perplexity. However, there are at least two problems about this measure. First, this measure is difficult to calculate for a language model other than n-gram. Second, we can’t determine the thresholds beforehand. It seems that the thresholds are affected by acoustic model and decoder, the relationship should be investigated. REFERENCES [1] J. Billa et al.. Multilingual speech recognition: The 1996 Byblos Callhome system. Proc. Eurospeech ’97, pp. 363–367, 1997. [2] R. Iyer, M. Ostendorf and M. Meteer. Analyzing and Predicting Language Model Improvements. Proc. IEEE Workshop on Speech Recognition and Understanding, pp. 254–261, 1997.
word accuracy (%)
Figure 5. the proposed measure vs. word accuracy 56.0 55.5 55.0 54.5 100
150 200 perplexity
250
Figure 7. PP and word accuracy
word accuracy (%)
word accuracy (%)
85 84 83 82 81 80
56.0 55.5 55.0 54.5 0.21
0.215 0.22 0.225 G(f (x; 3.1, − 0.1))
0.23
Figure 8. G(f (x; 3.1, − 0.1)) and word accuracy [3] R. Iyer, M. Ostendorf and J. R. Rohlicek. Language modeling with sentence-level mixtures. Proc. ARPA Human Language Technology Workshop, pp. 82–87, 1994-3. [4] S. Chen, D. Beeferman and R. Rosenfeld. Evaluation metrics for language models. Proc. DARPA broadcast news transcription and understanding workshop, 1998-2. [5] A. Ito, H. Saitoh, M. Katoh and M. Kohda. N-gram language model adaptation using small corpus for spoken dialog recognition. Proc. Eurospeech ’97, pp. 2735–2738, 1997–9.