SERIES PAPER DISCUSSION
IZA DP No. 4822
A New Model for Equitable and Efficient Resource Allocation to Schools: The Israeli Case Iris BenDavid-Hadar Adrian Ziderman
March 2010
Forschungsinstitut zur Zukunft der Arbeit Institute for the Study of Labor
A New Model for Equitable and Efficient Resource Allocation to Schools: The Israeli Case Iris BenDavid-Hadar Bar-Ilan University
Adrian Ziderman Bar-Ilan University and IZA
Discussion Paper No. 4822 March 2010
IZA P.O. Box 7240 53072 Bonn Germany Phone: +49-228-3894-0 Fax: +49-228-3894-180 E-mail:
[email protected]
Any opinions expressed here are those of the author(s) and not those of IZA. Research published in this series may include views on policy, but the institute itself takes no institutional policy positions. The Institute for the Study of Labor (IZA) in Bonn is a local and virtual international research center and a place of communication between science, politics and business. IZA is an independent nonprofit organization supported by Deutsche Post Foundation. The center is associated with the University of Bonn and offers a stimulating research environment through its international network, workshops and conferences, data service, project support, research visits and doctoral program. IZA engages in (i) original and internationally competitive research in all fields of labor economics, (ii) development of policy concepts, and (iii) dissemination of research results and concepts to the interested public. IZA Discussion Papers often represent preliminary work and are circulated to encourage discussion. Citation of such a paper should account for its provisional character. A revised version may be available directly from the author.
IZA Discussion Paper No. 4822 March 2010
ABSTRACT A New Model for Equitable and Efficient Resource Allocation to Schools: The Israeli Case This paper sets out a new budget allocation formula for schools, designed to achieve a more equitable distribution of educational achievement. In addition to needs-based elements, the suggested composite allocation formula includes an improvement component, whereby schools receive budgetary allocations based on a new incentive measure developed in this paper (Improvement in the Educational Achievement Distribution, or IEAD). The development of the budget allocation formula is demonstrated utilizing Israeli data. Large scale, nationwide data sets relating students’ academic achievement to student background variables, teacher profiles and school characteristics, were analyzed to identify appropriate needs-based formula components and to estimate their weights. The results are compared with the funding formulas currently used in Israel.
JEL Classification: Keywords:
I22
school finance, formular funding, needs-based funding, schools resource allocation, Israel
Corresponding author: Adrian Ziderman Economics Department Bar-Ilan University 52900 Ramat Gan Israel E-mail:
[email protected]
1. Introduction
The method by which the state allocates the budget to the school system can serve as an important instrument for achieving desired improvements in levels of educational attainment, social equity and other social policy targets. In many school systems, the allocation of school budgets is done according to a needs-based funding formula. A needsbased formula allocates budgets differentially to schools on the basis of the socioeconomic background of the student body; schools with students whose parents have low levels of education, who have a large number of siblings, and those living in rural areas will be in receipt of larger budgetary allocations. A needs-based school funding formula distributes education resources on a per-pupil basis according to the student’s background. The allocation formula used in England (a statutory requirement of the School Finance Regulations) provides an example of a needs-based formula. This formula assigns high weights to student background factors such as whether or not a pupil is entitled to a free meal at school (Adnett et al., 2002). The formula used in Holland compensates for students of disadvantaged backgrounds; a larger compensation is allocated to non-Dutch students from a disadvantaged background than to Dutch students from a disadvantaged background (Ritzen et al., 1997; Canton & Webbink, 2002). A third example is that of the state of Florida, which allocates larger compensatory funds dichotomously, according to student background variables such as English as a Second Language (ESL) and eligibility for hot meals (Owens & Maiden, 1999). Similarly, the city of San Francisco’s resources are also distributed dichotomously, according to the specific needs of each student, such as special education, ESL, and socioeconomic status (Shambaugh, Chambers, & DeLancey, 2008) 1. Israeli allocation at the primary school level also compensates students according to their background, but unlike the dichotomous
1
compensation allocation in use in San Francisco and Florida, the compensation is ‘diagonally’ allocated. That is to say, the extent of compensation is positively correlated with the depth of the need (Shoshani, 2001). Needs-based formula funding is generally regarded as an improvement on traditional, evenly-based school funding (e.g., input-based methods). School funding formulas can be instruments of educational policy, including policies aimed at change and reform. Because formulas can operate at the school level, and because they can be sensitive to a wide variety of cost factors and inputs (e.g., different categories of students), they can be effective instruments for reform, provided that they are properly deployed (Cohn & Geske 1990; Ross & Levacic, 1999; Levacic & Vignoles, 2002). Evenly-based funding formulas offer horizontal equity, but do not provide differential levels of resources based on differing needs. Resource allocation to Israeli high schools is of this kind2. A funding formula designed to provide equality of inputs is regressive (i.e. it enlarges the achievement gap). This is so because evenly-based funding does not encourage vertical equity, considering that the needs of students vary according to their differing academic-achievement starting points; equality of inputs is actually regressive in that it allocates to schools the same resource amount, regardless of the average profile of academic starting points of the student body. While needs-based funding provides additional resources to low-achieving schools with greater needs, there is also an expectation that these additional budgets will be used to raise academic achievements in these schools. The outcome of the debate on whether “money matters” – whether additional school resources lead to educational attainment improvement – has been largely resolved positively. But if there are no incentives for improvement, many low-achieving schools, in receipt of additional, differential funding, may continue to tread water rather than improve. Under needs-based budgeting, the continuation of additional
2
differential funding is not contingent upon progress in academic achievement. Thus, an allocation formula based solely upon needs-based features will lead to greater vertical equity, but might also preserve the current achievement distribution, given that incentives for progress are lacking. Alternatively, a school budget allocation formula based solely on incentives for progress (incorporating improvement components) might lead to a widening of the achievement gap, because such a formula ignores vertical equity. The literature does not provide a definitive answer to the question of whether equity and efficiency in educational finance are mutually exclusive or compatible. Nevertheless this paper, rather than treating equity and efficiency as dichotomous concepts, attempts to combine them using a distributional approach. Woessmann (2006) claims that, efficient education systems can create economic growth, and that equitable systems can create social cohesion. This paper suggests that both efficiency and equity can be enhanced by distributional output-oriented reforms, in which the state generally sets a regulatory framework that ensures accountability and funding. When school funding formulas are designed this way, education systems can advance efficiency and equity in parallel. The paper argues that both equity and efficiency may be achieved by developing a composite budget allocation formula incorporating both needs-based and improvement elements. With this outcome in mind, we develop (in Section 4) a new concept: the “Improvement in the Educational Achievement Distribution” (IEAD). The new formula addresses issues of both horizontal and vertical equity, as well as offering schools rewards for educational improvement. The formula is developed using Israeli data; this setting is thought to be an appropriate one because Israel is a diverse society encompassing ethnic minorities and immigrant groups. Moreover, the budgetary allocation system currently in use is neither efficient nor equitable, and therefore in need of reform.
3
Dissatisfaction with the allocation mechanism is evident in Israel (Central Bank of Israel, 2008; Kopp, 2008; Dovrat commission report, 2005). For instance, in response to litigation concerning the inequity of Israeli school finance, the Israeli Supreme Court recently instructed policy makers to transform the primary-school funding formula. Klinov (2008) reports on deficiencies at all three schooling levels in the funding formulas currently in use in Israel; however, empirical research on the issue of resource allocation to the Israeli school system is scarce. In addition to including the IEAD improvement-based component, the new formula developed in this paper includes a needs-based component that improves on those used in the differential formula currently employed for primary schools, based on the recommendations of the Shoshani Committee (2001). Furthermore, in accordance with the recommendations of the Dovrat Commission (2005), which have hitherto not been adopted, the proposed formula is to be applied uniformly to all schooling levels. Based on an analysis of extensive national data sets, then unavailable to these two committees, the proposed formula encompasses changes both in the components of the needs-based element and in their relative weights. The plan of this paper is as follows. In the next section, some major features of the Israeli education system are described. The methodological Section 3 lays out the conceptual model, data sources and definitions of the variables used and regression analysis results. In Section 4, our new measure of educational progress – IEAD - is outlined; this constitutes the progress element in the new formula. Section 5 shows how the new allocation formula is designed and estimated on the basis of the regression analysis; the new composite formula is compared with those currently in use. Recent policy initiatives, not always positive, are discussed in the final Section 6.
2
Current practice
4
2.1 The school system Population diversity Throughout its sixty years of statehood, a key feature of Israel’s educational policy has been the achievement of high levels of, and equality in, educational attainment for its diverse population. Israel is a small country (about seven million residents), but its population is diverse. Seventy-six percent of its permanent residents are Jews, some of them immigrants from Western and Central Europe, North Africa and other Middle East countries, or their descendents. In the recent period 1990-2008, 1,035,200 new immigrants (fifteen percent of the population) came to Israel, 76,100 from Ethiopia and 799,590 from the former USSR. The rest of the population comprises ethnical minorities, mostly Arab residents (1,413,300)3. Diversity is also found in the differing levels of economic material well-being. Income inequality in Israel is high and increasing. The Gini coefficient of income inequality (0.3878) has increased and now even exceeds that of the US. In recent years, the average income of the highest decile has been increasing, while the average income of the lowest decile has declined. The average standard of living has increased, yet 24 percent of permanent residents are poor, as are 34 percent of Israeli children4. School structure5 The Israeli school system is primarily public and comprises primary, lower secondary (middle) and upper secondary (high) schools. Pluralism is a central feature of the system; alongside the system of state general education, there are separate systems of state-religious schools, education in Arabic for minority students and separate, independent ultra-orthodox religious schools. Approximately 77 percent of the total student population is enrolled in Hebrew education, and 23 percent in Arab education. Most of the official education system6 was restructured to be comprised of three levels: six years of primary education (grades 1 through 6), three years of lower secondary schooling (grades 7 through 9), and three years of
5
upper secondary schooling (grades 10 through 12); the remaining official schools, which have not undergone the restructuring, comprise two levels only - primary schools (grades 1 through 8) and secondary schools (grades 9 through 12). Israel’s official Hebrew education encompasses two divisions: state and statereligious7. Both these divisions belong to the state, but differ with regard to religious beliefs and practice. These differences were manifested by the establishment of separate schools, school curricula, and school personnel. The schools of the Ultra-Orthodox are separate from the main stream of state education, yet enjoy monetary support from the state. There are three post-primary level educational streams - regular-academic, technological-vocational and agricultural training. The comprehensive high school now is the most common type of schooling, accounting for some 70 percent of post-primary enrollments and including both academic and technological streams. Achievement distribution The Israeli student achievement distribution is characterized by a low level of achievement combined with a widening achievement gap, as evidenced in various international comparative examination studies. This is despite the declared policy goal of narrowing the achievement gap upwards. In Progress in International Reading Literacy Study (PIRLS, 2001), an international comparative study on literacy on the forth grade, Israeli students' level of achievement was ranked 23rd, out of 45 participating countries. The average score of Israeli students was 509 (compared with an overall average of 500). However, it should be noted that Arab and ultra-orthodox students were excluded from the sample; their inclusion would very likely have further lowered the Israeli average. In the Program for International Student Assessment (PISA, 2000), an international comparative study on literacy among 15 years old students, Israeli students were ranked in the 30th place, out of 41 countries.
6
In international comparative examinations on Mathematics and Science, Trends in International Mathematics and Science Study (TIMSS, 1999), the Israeli students’ level of achievement is lower than average. The Israeli students' level of achievement in Mathematics was ranked 28th, out of 38 countries participating in the test. Only five percent of Israeli students were “excellent” in Mathematics and only seven percent in Science. Again, only Jewish students were examined; if other minorities had been included, it is likely that the Israeli achievement level would have been lower. According to the Israeli Central Bureau of Statistics (2006), not all youth in the relevant age group are students – only some 80 percent of them attend school. Furthermore, only less than 50 percent of this age group (including both students and non-students) performed well enough on the matriculation exams to entitle them to a matriculation diploma; of these, only forty percent gained a diploma that is sufficient for acceptance to Israeli universities. The distribution of educational achievement in Israel is also characterized by wide gaps. Tsur and Zussman (2008) examined the differences between the matriculation examinations achievement of Israeli students from various socioeconomic backgrounds and found widening gaps in indicators of excellence between the achievement of students from weak socioeconomic backgrounds and those from strong backgrounds. Compared to OECD (Organization for Economic Co-operation and Development) countries, Israeli students exhibit the widest achievement gap. Amongst industrialized countries, the scholastic achievements level of Israeli students is among the lowest and the educational gaps among Israeli students are the widest. Furthermore, the achievements of the higher decile of Israeli students are below those of similar students in all of the industrialized countries (Ben-David, 2003; Dovrat, 2005; Dahan & Ben-Basat; 2004, Dahan, al el, 2002; Mevarech & Liberman, 2004). The achievement gap is related to ethnicity, socio-economic level, country of origin,
7
new immigrant status, and residence area, i.e. periphery versus the centre (Dahan et al., 2002; BenDavid-Hadar, 2008). Given this discouraging Israeli student achievement distribution, it is thought that a reshaped school resource allocation system may serve a key corrective role in narrowing the achievement gap and boosting the level of achievement, in line with policy makers’ goals. 2.2
Current funding formula
This section explains why it is necessary to develop a new needs-based element in the school funding formula. Differing budget allocation formulas are applied at the various schooling levels within the state system: an evenly-based allocation formula for high schools, separate needs-based formulas (with five elements) for Hebrew and for Arab education at the middle school level, and a needs-based formula (with seven elements) at the primary school level (see Table 1). The overall primary and middle school budget allocation comprises two components; the major component, the fixed budget, accounts for some 87 percent of the total budget allocation, while the remaining 13 percent constitute the compensating, needs-based budget component. The primary school budget allocation is the product of the number of students and the average differential (student) index for the school (Shoshani Committee, 2001); resources are allocated to schools in terms of instructional hours rather than in monetary terms. The differential index is a per-student index calculated according to a needs-based formula (i.e., a larger budget is allocated to needy students according to the depth of their needs), with an added “national priority” element (i.e., larger budget is allocated to students living in areas that were defined as 'national priority' areas, such as those near Israel’s borders). A common differential index is used for both Hebrew and Arab education. The elements and relative weights, as set out in Table 1, Column 1, are as follows: mother's level of education (15%), father's level of education (15%), number of siblings (10%), new immigrant status (20%),
8
immigrant from developing countries status (10%), national priority status (20%), and periphery location status, i.e., schools located in a distance from the nearest of the three largest cities in Israel (10%). Most of the weights were derived from regression analyses examining the correlates between students' background characteristics and students' achievement.
9
Table 1: Current and proposed needs-based formula elements and weights
Proposed formula weights
Current formula weights
Formula elements
Mother's education level Father's education level Number of siblings New immigrant status New immigrants from developing countries status Residence: Periphery SES School in mixed cities National priority status Ethnicity Income
(1) Primary schools
(2) Middle schools (School-based)
High schools
(3) Unified: all school levels (Studentbased)
(Studentbased)
Minorities
Jewish
15 15 10 20 10
-25 12.5 ---
-25 15 15 --
------
23 13 6 8 8
10 --
25 --
20 --
---
-3
-20 ---
12.5 --25
---25
-----
--19 --
` At the middle school level, a two-stage allocation mechanism is in place (Nesher, 1996). First, the total middle school budget is divided between the two ethnic groups, according to the total number of students in each group. As noted above, some thirteen percent of the basic standard budget is set aside for compensatory budget allocation; the remainder comprises the fixed budget allocation. The percentage of schools entitled to receive a differential budget is determined by the Ministry of Education (in 2006, 75% of Jewish schools and all non-Jewish schools were entitled to receive differential budgets). The compensating budget is differentially allocated to each eligible school at the second stage, after a deduction of ten percent accruing to the municipal authorities. Each eligible school within its respective ethnic group receives a relative, differential budget; separate differential
10
formulas are employed for each ethnic group. This two-step allocation mechanism has the undesirable effect of allocating lower budgets to the neediest (minority) student groups. The elements of the differential index for Jewish and Minority middle schools are set out in Table 1, Column 2. The elements of the formula for Jewish students are: percent of low-income families (25%); percent of fathers with low-level education (25%); percent of large families (15%); percent of new immigrants (15%); and a periphery index based on the distance from the nearest of the three largest cities (20%). The elements of the differential index for Arab students are: percent of low income families (25%); percent of fathers with low-level education (25%); percent of large families (12.5%); periphery element (25%), in this case referring to families from unrecognized localities (12.5%) and schools in small residences (12.5%); and schools in mixed cities8 (12.5%), (Nesher, 1996). Overall, the current system of school budgeting in Israel is in need of revision. High schools are budgeted on an even-basis system, which provides horizontal but not vertical equity, and there are no incentives for improvement in performance. Needs-based budgeting is in place for primary and middle schools, but the formulas employed are deficient, both in terms of the elements used in the formula and the weights assigned to them; this will be demonstrated in Section 5). For these schools as well, progress incentives are lacking. The cost, in terms of the overall quality of the educational system, is not small. Comparative international evidence attests to a relative decline in Israeli schools’ educational attainment and Israeli students display relatively low achievements in international examinations, as described in section 2.1. Together with the widening of the achievement gap (Ben-David, 2000), this portends ill for Israel’s long-term economic and social progress. The new composite funding formula developed in this paper may go some way towards a reversal of these trends.
11
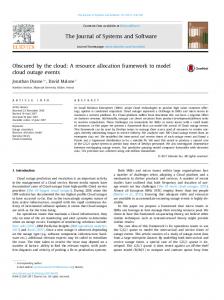
3 Methodology This section describes the methodology used in the design of an improved allocation formula, improved both in terms of better addressing school needs and of promoting progress in student academic achievement. The conceptual model underlying the statistical analysis is presented; this is followed by an account of the data sources and the variables used in the statistical analysis. 3.1 Conceptual model The conceptual model, shown in Figure 1, presents two kinds of relationships between the variables. The first is the direct relationships between student performance and various background features. This is shown by the solid-line arrows in Figure 1. This provides a direct measure of the contribution of each explanatory variable to variation in academic achievements. The beta coefficients for the student background variables are used to identify the needs-based components and size of weights to be included in the new funding formula, as will be explained in Section 5; they will also indicate which of the components used in the current formula need to be excluded, replaced or assigned different weights. Teacher profiles and school characteristics are employed as control variables because they are most likely to affect performance, but are not relevant elements in the need-based funding formula.
12
Student background
Teacher profiles
Performance School characteristics
Improvement in Education Attainments Distribution
Figure 1: The conceptual model OLS regression analysis is employed, a method widely used in the literature to measure the relationships between student performance and student background characteristics (Jenkins, Levacic, & Vignoles ,2006; Gould, Lavy, & Paserman, 2004; Carnoy, Gove, & Marshall, 2007). The dotted arrow represents a second kind of relationship, indicating a reward for academic improvement (to be explained in Section 4). 3.2 Data
13
Extensive data sets were obtained by special request from the records of the Israeli Ministry of Education, comprising three levels of schooling (i.e. primary, middle, and high school). However, only high school data were available on the student (individual) level. The data for the other two levels of schooling (primary and middle schools) were available only at the school level. Therefore, the regression results for these levels are not reported here, although they were taken into account in formulating the policy suggestions included in this paper; these results are available on request. High school data The data set contains nation-wide matriculation examination scores9, at the student level, for the year 2001. The matriculation examinations in Israel are centralized. The entire process is governed by the Ministry of Education. The exams on all compulsory subjects (see below) and most optional subjects are designed and written by the Ministry, thereby creating a standard measure of the students' knowledge throughout the country. All students who are Israeli citizens take one or more of the nation-wide matriculation examinations. The data relate to about 84,000 students (25% are minority students), in some 1,100 high schools. Included in the data base are all the students' scores at the final examinations for each subject in which students were tested, and the level of the subject material at which they were examined. The second part of the data set contains information on student background features such as the level of the mother’s and the father’s education, ethnicity, origin of birth, number of siblings and residence. The data also include teacher profiles (seniority and education level) and school characteristics such as school size and type of supervision (state or state-religious). 3.3
Variables
Two types of variables were defined: dependent (endogenous) variables, and independent (exogenous) variables.
14
Dependent (endogenous) variables The dependent variables relate to student performance. Two main types of high school performance data are used, one relating to performance level and the other to performance quality. The level of performance is represented by the Mathematics matriculation score, which was calculated with respect to the differing levels of Mathematics (i.e. number of study units, or “credit points”) in which individual students were examined. This is thought to be an improvement on the traditional measure of performance in terms of the overall matriculation (Bagrut) mean score. It was chosen as more representative of the level of high school achievement, because it is an obligatory subject in the matriculation examinations and the examinations are standard for all students; this facilitates student comparisons. A quality measure was introduced because of wide variations amongst students in the scope of their matriculation diploma. Individual diplomas vary because of a differing number of subjects taken and differing study levels within some subjects. Thus a diploma may relate to the minimum required credit points (twenty one) or to a more comprehensive study plan of up to fifty credit points. Quality of performance is defined as the summation of the products of every subject score by the number of points in each subject. This is thought to more reliable than the overall average matriculation score, because it reflects the variation in performance. For example, a student would be considered an excellent student if he or she scores 100 on the variable “overall matriculation mean score”. However, this score of 100 may correspond to a wide range of scores on the variable “quality”, from the lowest value of 2100 (100 * 21 credit points, the required minimum) to the highest value of 5000 (100 * 50 credit points), representing a different interpretation of “excellence”. Independent (exogenous) variables Four sets of independent variables were defined. Three vectors of need-based variables were used in the regression analysis: student background (to estimate the formula
15
weights) and teacher profiles and school characteristics (as controls). A fourth measure of academic progress, the IEAD improvement variable, was defined but not employed in the regression analysis, as explained subsequently. The student background category consists of three types of variables. First, some student variables were defined directly, relating to gender, origin of birth, immigration year, and ethnicity10. Second, the student socio-economic status variable (SES) was defined indirectly, in the absence of Ministry of Education information on student SES. The SES measure used is based on student residence location, using an SES index developed by the Israeli Central Bureau of Statistics (CBS, 2006). This index assigns to each local authority a number ranging from one to ten, where a lower number indicates lower average SES. Third, parental characteristics were defined, relating to fathers’ and mothers’ education level and to fathers’ and mothers’ origin of birth. The teacher profile variables (used as controls) comprise information on teacher's education (which is defined as a continuous variable, with the doctorate receiving the highest ranking) and seniority, defined by number of years in the teaching profession. School characteristic control variables were included: school size, average school SES level, supervision (state, state-religious), and school type (the new school structure consists of three schooling levels while the old structure comprises only primary and secondary schools).
16
Table 2: Variables Listing Dependent variables Primary schools: Fifth grade achievement in final examinations (Meitsav) Middle schools: Eighth grade achievement in final examinations (Meitsav) High schools: performance level and quality in the matriculation examination (Bagrut)
Independent variables Student background variables: Gender (dummy variable - value 0 assigned to male students and value 1 to female students. student’s origin of birth year of immigration ethnicity (dummy variable - value 1 assigned to Jewish students and value 0 otherwise) SES (residence) number of siblings father's education level mother's education level father's origin of birth mother's origin of birth Controls: Teacher profiles: education seniority School characteristics+: school size: number of students number of teachers number of classes student-teacher ratio average number of students per class school compensating decile (calculated by school average SES) school supervision (dummy variable - value 0 to state school and the value 1 to state religious) school type (dummy variable - value 0 to eight grades at a post primary school and 1 to eight grades at a primary school) school’s legal status (dummy variable - value 0 assigned to recognized but not official schools and value 1 to official schools)
+ Other control variables were also used
17
Table 2 lists the variables used in the regression analysis; the relationships amongst these variables are indicated in Figure 1. The analysis of high schools is at the student level. Since suitable data for measuring the improvement component (IEAD) is yet unavailable in Israel (though such information is currently in preparation), this component was not included as a variable in the regression analyses reported below. In the absence of a direct estimate of the size of this variable, a proxy measure for this formula component was used, based on the results of external, value-added research. When suitable Israeli data for the direct measurement of IEAD becomes available in the near future, the size of this formula element will be estimated directly from an extended regression model, based on a measure of school value-added in Israel. The IEAD concept is explained in detail in the following Section 4; meanwhile, we present the results of the regression analysis. 3.4 Regression Results The results of regression analyses measuring the direct relationship between student performance and student background variables are now presented. An explanation of how the regression beta coefficients for the student background variables are translated into new formula elements and weights is given in Section 5. In addition to regressions for the total sample, separate regressions by ethnicity were executed (Jewish versus Arab student performance), while others entailed separate analyses for each ethnic sub-group (Arabs, Druze, Bedouin). Separate regressions were also run including various interaction effects. Additional regressions were executed for other schooling levels. While we report only the findings of the total sample regressions on the high school level, including parental education interaction effects, some key results from other regression runs are referred to in the following discussion, as necessary. Full results from these other regression runs are available from the authors, on request.
18
Results for the student background variables are reported in Table 3; results for the controls are not reported. Amongst the student background variables, parental education and ethnicity make the greatest contribution to explaining the variations in student achievement.
Table 3: Regression analysis: Effect of student background variables on high school student performance Performance Explanatory variables+
Level
Quality
(Mathematics score) Gender
Ns
-0.07**
Number of years in Israel (for new immigrants)
0.07**
0.03**
Ethnicity
0.04**
0.07**
Residence (SES)
0.04**
Ns
Number of siblings
-0.04**
-0.04**
Parents' education interaction
0.23**
0.24**
Mother’s education level
0.06**
0.05**
Father's origin of birth
0.04** Israel
Ns
0.14
0.13
2
R
*p