St Joseph's College, Melbourne and University of Athens ... substantial investment in providing information technology to assist in teaching and learning ...
A New Scale for Monitoring Students’ Attitudes to Learning Mathematics with Technology (MTAS)1 Anastasios Barkatsas St Joseph’s College, Melbourne and University of Athens The Mathematics and Technology Attitudes Scale (MTAS) is a scale for middle secondary years students that monitors five affective variables relevant to learning mathematics with technology. The subscales measure mathematics confidence, confidence with technology, attitude to learning mathematics with technology and two aspects of engagement in learning mathematics. The paper reports the responses of 350 students from 6 schools to demonstrate the power of the MTAS to provide useful insights for teachers and researchers. ‘Attitude to learning mathematics with technology’ had a wider range of scores than other variables studied. For boys, this attitude is correlated only with confidence in using technology, but for girls the only relationship found was a negative correlation with mathematics confidence.
Technology provides an enormous spectrum of possibilities for new approaches to teaching and hence for learning across the curriculum. The research and professional literature suggests that the new approaches may enhance learning through cognitive, metacognitive and affective channels. The cognitive and metacognitive channels for improving learning by using technology are clearly strong and important to study. This paper provides a tool, the Mathematics and Technology Attitudes Scale (MTAS), to examine the role of the affective channel, which is also important in improving learning, and it reports some results from the use of MTAS in six schools. For learning and doing mathematics, technology in the form of ‘mathematics analysis tools’ (such as certain computer software, calculators, graphics calculators, computer algebra systems, spreadsheets, statistics programs) can assist students’ problem solving, support exploration of mathematical concepts, provide dynamically linked representations of ideas and can encourage general metacognitive abilities such as planning and checking. In addition, information technology in the form of ‘real world interfaces’ such as digital cameras, video cameras and data loggers can bring to life in the classroom those outside situations to which mathematics is applied (see, for example, Oldknow, 2003). With substantial investment in providing information technology to assist in teaching and learning mathematics, it is important to monitor students’ reactions and decide how best to use both forms of technology, the mathematics analysis tools and the real world interfaces. Reports of almost any major teaching innovation of the last twenty-five years include data on students’ attitudes to the innovation as well as their mathematical achievement. McLeod (1992), who provides a careful analysis of previous research on affect in 1
The research reported in this paper was a collaboration between the author, Kaye Stacey and Robyn Pierce, while he was the University of Melbourne Project Officer for RITEMATHS in 2004. The project is funded by the Australian Research Council, with Chief Investigators K. Stacey, G. Stillman and R. Pierce. A full report of the MTAS study by Pierce, Stacey & Barkatsas is currently in print in the International Journal ‘Computers and Education’.
129
mathematics education, is adamant that affective issues play a central role in mathematics learning and that ‘mathematics education research can be strengthened if researchers integrate affective issues into studies of cognition and instruction’ (p.575). The literature published since 1992 also affirms that affective factors and beliefs impact on student learning: in general positive attitudes and beliefs and intrinsic motivation are reflected in increased effort in learning and greater persistence. Ruffell, Mason and Allen (1998) are concerned that attitudes may not be sufficiently well defined conceptually or sufficiently stable to be reliable but “influenced by social and emotional context and personal construction of these” (p.15). We would agree with Ruffell et al. that attitudes can ‘flip’ from negative to positive and in particular that ‘good teaching’ can have such an effect, but we disagree that this means that monitoring attitude will not prove fruitful for mathematics education research. Attitudes are commonly distinguished from beliefs in that attitudes are moderate in duration, intensity and stability and have an emotional content, while beliefs become stable and are not easily changed (McLeod, 1992; Mayes, 1998; Pajares, 1992). In this paper, we do not make a strict distinction between attitudes and beliefs, but use the terms ‘attitude’ and ‘affective’ to encompass both feelings and opinions about doing and learning mathematics. This paper reports the development of a scale to monitor affective changes which result from technology use and which are likely to have an impact on improving learning. A hypothesized model has been proposed by Pierce, Stacey & Barkatsas (in print). This study is linked to the RITEMATHS project (HREF1), which is conducting a series of curriculum design experiments for middle secondary school teaching of mathematics. RITEMATHS aims to track changes in the attitudes and engagement of students in their learning of mathematics, in response to the altered learning environment and to consider how best this use of technology can be implemented. Five subscales have been developed which allow the researchers to monitor the following five variables: mathematics confidence (MC), affective engagement (AE), behavioural engagement (BE), confidence in using technology (TC) and attitude to the use of technology to learn mathematics (MT). The rest of this paper discusses some of the available scales and the psychometric analysis of the resulting Mathematics and Technology Attitudes Scale (MTAS), which is given in Appendix 1. Aspects of the power of MTAS to provide useful insights for teachers by reporting on differences between genders are also reported.
The Need for Another Scale Attitudes have been studied in various ways, with data collected from individual interviews, focus groups, diaries, observation and questionnaires. Since the research of Fennema and Sherman in the 1970’s, questionnaires have become standard tools for assessing student attitudes, especially when attitudes alone are not the focus of the study but rather viewed as one factor to be monitored when assessing the likely success of a curriculum or teaching innovation. The literature does not support one approach over another. We need an instrument that is suitable for students as young as fourteen, with widely varying scholastic abilities. Since the RITEMATHS project will monitor curriculum innovations, the instrument will need to be administered regularly without taking too much class time. For example, the classic Fennema and Sherman (1976) scale, which measures some constructs of interest the project team, has 108 items and according to Tapia and Marsh (2004) one needed to allow students up to 45 minutes. Scales also become dated.
130
Shades of meaning of words change and, while older scales provide most helpful models, new items need to be constructed which will be immediately understood by the current student cohort. Other recent research in the Australian context provides resources on which a suitable scale may be built. For example Galbraith and Haines (1998) provide a contemporary resource but their subjects were tertiary students and their focus, related to particular courses, meant that items were not immediately transferable to our study. Similarly Fogarty et al. (2001) validated a questionnaire to measure tertiary students’ mathematics confidence, computer confidence and attitudes towards the use of technology for learning mathematics. Their scale, focused on just these three constructs, has 37 items including a number of long statements, making it unsuitable for direct transfer to our setting. Vale and Leder (2004) report a study of the relationship between gender and attitudes to using computers for learning mathematics using a questionnaire as one source of data. While their scale is targeted at the same age range as the RITEMATHS study (early/middle secondary years), and the issue of gender may emerge as an important variable, the RITEMATHS team decided to look more broadly. While acknowledging the advantage of building on previous research without modification, none of the available scales was deemed suitable for repeated monitoring of students’ attitudes in a diversity of middle secondary years classes. However MTAS has many ideas and some items in common with other published scales.
Compiling the Scale The trial instrument consisted of 27 items. It was planned around five subscales: Mathematics Confidence [MC], Confidence with Technology [TC], Attitude to learning mathematics with technology (whether computers, graphics calculators or computer algebra systems) [MT], Affective Engagement [AE] and Behavioural Engagement [BE]. A Likert-type scoring format was used for each of the subscales: MC, TC, MT and AE. Students were asked to indicate the extent of their agreement with each statement, on a five point scale from strongly agree to strongly disagree (scored from 5 to 1). A different but similar response set was used for the BE subscale. Students were asked to indicate the frequency of occurrence of different behaviours. A five-point system was again used – Nearly Always, Usually, About Half of the Time, Occasionally, Hardly Ever (scored again from 5 to 1). This scale was trialled in 2004 with 350 students from 17 intact classes in grades 8-10 at 6 secondary schools. These schools are typical of the range of secondary schools in Victoria (Australia) and include two private co-educational schools, two state coeducational schools, one girls’ private school and one girls’ state school. The schools vary from upper middle to low socio-economic status.
Component Structure and Reliability of the Preliminary and MTAS Scale The items for the scale were constructed with 5 components in mind. Principal Component Analysis (PCA) of the preliminary scale confirmed the five-component structure, with all but a few items contributing as planned to the scale. However, the component and reliability analysis, together with examination of inter-item correlations, further suggested that the scale could be simplified to 5 components with 4 items per components. The final item set is the Mathematics and Technology Attitudes Scale (MTAS) and it is included as Appendix 1. Users of the MTAS can easily obtain each
131
subscale score by adding the responses to the 4 items. After the initial PCA and reliability analysis, seven items were deleted from the set. PCA and reliability analysis were then reapplied to the resulting 20 item MTAS. Statistical analysis using data from 350 complete students’ responses to the twenty items forming the MTAS indicates that this data satisfies the underlying assumptions of PCA and that together five components (each with eigenvalue greater than 1) explain 65% of the variance, with almost 26% attributed to the first component, MC (Table 1). Reliability analysis yields satisfactory Cronbach’s alpha values for each subscale (MC, 0.87; MT, 0.89; TC, 0.79; BE, 0.72 and AE, 0.65). This indicates a strong or acceptable degree of internal consistency in each subscale. Table 1 Component Structure of the Mathematics and Technology Attitudes Scale (MTAS). Principal Components Analysis with Varimax and component loadings > 0 .45 [The last item has loaded on the last component without a factor loading. This should be interpreted that the loading was marginally below the 0.45 cutoff score that was set for factor loadings.] a
Rotated Component Matrix
Component 1 (MC) I am confident with maths
.837
(MC) I know I can handle difficulties in maths
.803
(MC) I can get good results in maths
.787
(MC) I have a mathematical mind
.755
2
(MT) Maths is more interesting when using graphics calculators and computers
.875
(MT) Graphics calculators and computers help me learn maths better
.865
(MT) Using graphics calculators and computers in maths is worth the extra effort
.862
(MT) I like using graphics calculators and computers in maths
.801
3
(TC) I am good at using computers
.837
(TC) I can fix a lot of computer problems
.809
(TC) I am good at using things like VCRs, DVDs, MP3s and mobile phones
.729
(TC) I can master any computer programs needed for school
.657
4
(BE) If I make mistakes, I work until I have corrected them
.788
(BE) If I can't do a problem, I keep trying different ideas
.766
(BE) I try to anwer questions the teacher asks
.631
(BE) I concentrate hard in maths
.586
5
(AE) Learning maths is enjoyable
.731
(AE) I am interested to learn new things in maths
.713
(AE) I get a sense of satisfaction when I solve maths problems
.676
(AE) In maths you get rewards for your efforts Extraction Method: Principal Component Analysis. Rotation Method: Varimax with Kaiser Normalization.
Using the MTAS to Explore Gender Variation MTAS subscale scores can be calculated by simple addition of responses. With a maximum possible score on any subscale of 20 and a minimum of 4, we consider scores of
132
17 or above to be high, indicating a very positive attitude, 13 - 16 to be moderately high and 12 or below to be a low score reflecting a neutral or negative attitude to that component.
Gender Differences This section reports results on the five subscales by gender. In order to remove between-school influences from the data, only the responses from the four co-educational schools are considered in this section. This means that the boys and girls in the sample have experienced the same learning environments. One hundred and forty-one (70 boys and 71 girls) students completed all items although more students (152 total) completed all items of some subscales. 20
Subscale score
16
12 AE BE 8
TC MT MC
4 N=
70
70
70
70
70
71
Male
71
71
71
71
Female
Gender
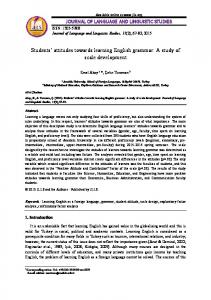
Figure 1. MTAS scores for subscales by gender.
The breakdown of these scores by gender, illustrated in Figure 1, reveals that boys have statistically significantly higher scores than girls for each subscale except BE (t=-0.005, df=151, p=0.996). The differences are greatest for TC (t=6.84, df=152, p=0.000) and MC (t=6.13, df=155, p=0.000) with MT (t=2.85, df= 149, p=0.005) and AE (t=2.56, df=152, p=0.011) demonstrating less difference. While 50% of boys score 16+ on MC, this was true for only 25% of girls. TC scores are even more strongly higher for boys, with approximately 75% of boys scoring 16+ and only 25% of the girls. These results reflect the common finding that boys express greater confidence than girls, but they contrast with those of Vale and Leder (2004) who found gender differences only on their variable corresponding to MT. It is important to note that not all the students with negative attitudes to learning mathematics with technology are girls. The distributions of MT have a long tail for both boys and girls and high inter-quartile ranges (the highest for the boys’ scores). The high variability in MT is therefore not explained by gender differences: we need to look beyond learning environment and gender to explain the range of students’ evaluations of the effectiveness of learning with technology. These explanations therefore warrant further investigation. Whereas boys may experience learning mathematics more positively simply because technology is present,
133
some girls may value it when they feel it has the potential to compensate for self-perceived shortcomings. In interpreting all the gender differences, it is important to note that only a few girls actually expressed negative responses (total score less than 12) to any of the factors. It is not that the girls’ scores are very low, rather that there was a more highly positive response from the boys. In every school, most students agreed rather than disagreed that it was better to learn mathematics with technology. These results suggest that this scale is proving to be suitable for discriminating differences between cohorts of students and hopefully for indicating change over time with repeated administration.
Conclusion This paper outlines the rationale for, construction, analysis and application of a simple scale for assessing students’ attitudes to mathematics, technology and the learning of mathematics with technology. The Mathematics and Technology Attitudes Scale (MTAS) questionnaire consists of only 20 short items and can be administered in less than 10 minutes. The scores on the items are simply added to get the subscale scores. Modification of the last four items tailors the scale for students who regularly use computers, graphics calculators or other mathematical analysis tools. If desired, the MT items can be repeated in different versions to measure attitudes to learning with another technology. They are placed last on the scale to make this easier. Administering the scale to students in 4 schools provided information about differences between genders, and also gave some clues as to what variables contribute or do not contribute to students’ evaluation of the effectiveness of learning mathematics with technology. As we work through the potential opportunities offered by technology for enhancing the teaching and learning of mathematics it is important that all aspects are monitored. This scale provides an instrument that can be used in classrooms by either teachers or researchers interested in trialing or investigating teaching innovations, which include the use of information and communication technologies.
References Fennema, E., & Sherman, J. (1976). Fennema-Sherman Mathematics Attitudes Scales. Instruments designed to measure attitudes toward the learning of mathematics by females and males. Abstracted in the JSAS Catalog of Selected Documents in Psychology, 6 (1), 31. (Ms No. 1225) Fogarty, G., Cretchley, P., Harman, C., Ellerton, N., & Konki, N. (2001). Validation of a questionnaire to measure mathematics confidence, computer confidence, and attitudes towards the use of technology for learning mathematics. Mathematics Education Research Journal, 13, 154-160. Galbraith, P., & Haines, C. (1998). Disentangling the nexus: Attitudes to mathematics and technology in a computer learning environment. Educational Studies in Mathematics, 36, 275-290. HREF1 RITEMATHS project http://extranet.edfac.unimelb.edu.au/DSME/RITEMATHS. University of Melbourne. Accessed 26 November 2004. McLeod, D. B. (1992). Research on affect in mathematics education: A reconceptualisation. In D. A. Grouws (Ed.), Handbook of research on mathematics teaching and learning (pp. 575-596). New York: MacMillan. Oldknow, A. (2003). Mathematics from still and video images. Micromath. Summe, 30 - 34. Pajares, M. F. (1992). Teachers’ beliefs and educational research: Cleaning up a messy construct. Review of Educational Research, 62 (3), 307-322. Pierce, R., Stacey, K., & Barkatsas, A. N. (in print). A scale for monitoring students’ attitudes to learning mathematics with technology. Computers and Education.
134
Ruffell, M, Mason, J., & Allen, B. (1998). Studying attitude in mathematics. Educational Studies in Mathematics. 35, 1-18. Tapia, M., & Marsh I, G. (2004). An instrument to measure mathematics attitudes. Academic Exchange Quarterly. 8 (2), 1-8. Vale, C., & Leder, G. (2004). Student views of computer-based mathematics in the middle years: Does gender make a difference? Educational Studies in Mathematics. 56, 287-312.
135
Appendix 1 Mathematics and Technology Attitudes Scale FIVE SUBSCALES: Mathematics Confidence [MC], Confidence with Technology [TC)], Attitude to learning mathematics with technology [MT], Affective Engagement [AE] and Behavioural Engagement [BE]. (MTg = MT - graphing calculators) To tailor MT items to a particular class, change the words “graphics calculators” to the technology used by that class (e.g. computers, graphics calculators, computer algebra systems). Do not change TC items.
1. 2. 3. 4.
I concentrate hard in mathematics [BE] I try to answer questions the teacher asks [BE] If I make mistakes, I work until I have corrected them. [BE] If I can’t do a problem, I keep trying different ideas. [BE]
Hardly Ever
Occasionally
About Half the time
Usually
Nearly Always
HE
Oc
Ha
U
NA
HE
Oc
Ha
U
NA
HE
Oc
Ha
U
NA
HE
Oc
Ha
U
NA
5.
I am good at using computers [TC]
SD
D
NS
A
SA
6.
I am good at using things like VCRs, DVDs, MP3s and mobile phones [TC]
SD
D
NS
A
SA
7.
I can fix a lot of computer problems [TC]
SD
D
NS
A
SA
8.
I am quick to learn new computer software needed for school [TC]
SD
D
NS
A
SA
9.
I have a mathematical mind [MC]
SD
D
NS
A
SA
10.
I can get good results in mathematics [MC]
SD
D
NS
A
SA
11.
I know I can handle difficulties in mathematics [MC]
SD
D
NS
A
SA
12.
I am confident with mathematics [MC]
SD
D
NS
A
SA
SD
D
NS
A
SA
SD
D
NS
A
SA
SD
D
NS
A
SA
SD
D
NS
A
SA
SD
D
NS
A
SA
SD
D
NS
A
SA
SD
D
NS
A
SA
SD
D
NS
A
SA
13. 14. 15. 16. 17. 18. 19. 20.
I am interested to learn new things in mathematics [AE] In mathematics you get rewards for your effort [AE] Learning mathematics is enjoyable [AE] I get a sense of satisfaction when I solve mathematics problems [AE] I like using graphics calculators for mathematics [MTg] Using graphics calculators in mathematics is worth the extra effort [MTg] Mathematics is more interesting when using graphics calculators. [MTg] Graphics calculators help me learn mathematics better [MTg]
136