MEASUREMENT SCIENCE REVIEW, Volume 1, Number 1, 2001
OSCILLOSCOPE TESTING BY MEANS OF STOCHASTIC SIGNAL Josef Vedral, Jan Holub Department of Measurement, Faculty of Electrical Engineering Czech Technical University, Technicka 2, CZ 166 27, Praha 6, Czech Republic tel. +420 2 2435 2131, fax: +420 2 311 99 29, e-mail:
[email protected]
1
INTRODUCTION
The key device of digitizing oscilloscope is its Analogue-to-Digital Converter (ADC) while it provides an interface between analogue and digital areas. It must be considered as a non-ideal device that errors are to be measured by manufacturers as well as by application engineers. There are several basic methods that are commonly used for ADC testing. Sine fit test [1], [5] stands for an example of time-domain testing while single- and dual-tone FFT test [5] can be considered as the frequency-domain test method. Such standard methods are well described in IEEE-STD-1241 Standard for Terminology and Test Methods for Analog-to-Digital Converters or in IEEE-STD-1057 Standard for Digitizing Waveform Recorder. Statistical approach should be mentioned besides the above mentioned methods. The typical example is histogram test that can use various input signals. Nevertheless, sine-wave full-scale input signal is mostly used, too. Not only sine wave but any deterministic input signal requires accuracy (linearity, signal to noise ratio, etc.) of such signal higher than expected accuracy of tested AD converter. This fact becomes problem when low sampling frequency, high-resolution AD converters (e.g. Σ-∆ or dither-based) or on the contrary very high-speed AD converters like these of digitizing oscilloscope are to be tested. In such cases, stochastic input signal must be used for test [2], [3], [4]. .
2
STOCHASTIC TESTING SIGNALS
The histogram test method [5] allows use noise as the input signal. One can use uniformly or Gaussian distributed noise. Uniformly distributed noise enables easier and more accurate histogram processing but it is difficult to generate such noise. There is not any suitable „physical source“ of large scale uniformly distributed noise and it is not possible to use DAC (Digital-to-Analogue Converter) for high resolution ADC testing. The reasons are the same as mentioned at the first paragraph: The used DAC should provide better linearity and resolution than the tested ADC. If Gaussian noise is applied, its variance must be rather high to cover all input code words with reasonable density. Moreover, such large signal is rather difficult to generate and, in addition, the histogram post-processing requires the recalculation of histogram values and provides different test accuracy for different code words.
3
PROPOSED STOCHASTIC TESTING SIGNAL
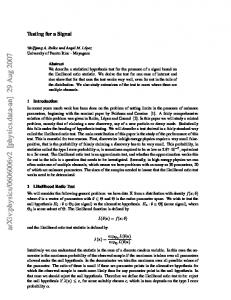
To overcome the above mentioned difficulties, new signal that is based on superposition of Gaussian distributed signals with equidistant DC shifts is proposed, see Fig. 1. Let us have Gaussian noise with probability density function (p.d.f.) fG(µ,σ) where µ is the mean value and σ means standard deviation. It is easy to show that
∞ 1 lim ∑ f G ( µ + k .∆,σ ) − = 0 ∆ →0 ∆ k = −∞
k integer
(1)
Independently on the value of µ and σ. In other words, the superposition of Gaussian distributed noises with the equidistantly spaced DC values by step ∆ is for suitably small values of ∆ an excellent approximation of uniformly distributed signal. Measurement is provided for each Gaussian noise separately but histograms are cumulated. Theoretical analysis of such signal has been provided in [4].
67
Theoretical Problems of Measurement ● J.Vedral, J. Holub
f[] Input range of ADC under test
Σ
∆
u [V]
Fig.1 Probability density function of the proposed stochastic signal The ENOB (Effective Number of Bits) calculation follows the usual way that is well described in [3] or in IEEE-STD-1241. In the concrete, DNL values are estimated from the measured histogram and INL values are then calculated using DNL:
DNLi =
Oi − O O
m −2
INLj = − ∑ DNLi
(2,3)
i =1
where Oi is the value of the i-th code of cumulative histogram and O is its ideal value that can be achieved by the following way (the common way of indexing of code words 0,1,…,m-1 is expected) : m −2
O=
∑O i =1
i
(4)
m−2
Assuming statistical independence of INL values and quantisation error, the standard deviation of ADC output can be calculated as
σc =
1 1 m− 2 + ∑ INL2i 12 m − 2 i =1
(5)
Then, ENOB can be calculated as
ENOB = log 2
m σ c 12
(6)
68
MEASUREMENT SCIENCE REVIEW, Volume 1, Number 1, 2001
4
PRACTICAL RESULTS
p.d.f. TRIG
Σ
Noise Source
DIG OSC PC/DSP
DC calibrator
DC voltmeter
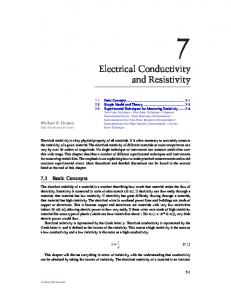
Fig.2 Block schematic of arrangement of stochastic test of digitizing oscilloscope The stochastic testing signal described above has been applied to the 8-bits, 200 MSa/s digitizer of the oscilloscope HP 54645D (Agilent), see Fig. 2. The calculated parameters (Differential and Integral Non-linearities, Signal-to-noise Ratio and Effective Number of Bits) are shown in Fig. 3 and 4 and summarized in Table 1. 0.8
0.2
0.6
0 -0.2
0.4
-0.4
0.2 -0.6
0 -0.8
-0.2 -1
-0.4
-1.2
-0.6 -0.8
-1.4
0
50
100
150
200
250
-1.6 0
300
50
100
150
200
250
Fig. 3 Differential (left) and Integral (right) non-linearities obtained by standard test method (static histogram test using ramp input signal)
5
CONCLUSION
A new type of test signal for ADC testing has been introduced. Its practical applicability has been proven for ADC of digitizing oscilloscope HP 54645D. The results are comparable to the ones obtained by standard tests. The future field of future interest will be a frequency point of view. In current state of work, “wide-band” results (ENOB) are obtained. Even it corresponds to many practical applications of ADCs, such “wide-band” description is officially stated nor in IEEE-STD-1241 nor in other similar standards.
69
Theoretical Problems of Measurement ● J.Vedral, J. Holub
0.8
0.2
0.6
0 -0.2
0.4
-0.4 0.2 -0.6 0 -0.8 -0.2 -1 -0.4
-1.2
-0.6
-1.4
-0.8 0
50
100
150
200
250
-1.6 0
300
50
100
150
200
250
Fig. 4 Differential (left) and Integral (right) non-linearities obtained by stochastic test (stochastic histogram test)
METHOD STATIC TEST SINUS CURVE FIT TEST [10 MHz] STOCHASTIC (STEP GAUSS TEST) [EBW = 15 MHz]
ENOB [Bits] 7,31 7,15 7,20
SNR [dB] 46,0 44,8 45,1
Tab.1 Test results comparison
ACKNOWLEDGEMENTS This project is supported by the Czech ministry of Education, project J04/98:210000015 Research of New Methods for Physical Quantities Measurement and Their Application in Instrumentation and by Grant Agency of Czech Republic No. 102/99/0775 Metrological Assurance of Precision Digitizers.
REFERENCES [1] [2] [3] [4] [5]
Seitzer,D., Pretzl, G., Hamdy, N.A.: Electronic analog-to-digital converters. John Wiley, Chichester 1983. ISBN 0471 901989 Carbone, P.,Petri, D.: Noise Sensitivity of the ADC Histogram Test, IEEE Instrumentation and Measurement Technology Conference, St. Paul, Minnesota, May 1998 Cruz Serra, A. M.: ADC Testing and Standardisation, Proposal of an European Project, DRAFT, Lisbon th Holub, J., Vedral, J.: Signal Source for Statistical Testing of ADC. XVI.Congress IMEKO. 5 Worshop on ADC Modelling and Testing. Wien 2000. IEEE-STD-1241 Standard for Terminology and Test Methods for Analog-to-Digital Converters
70