Journal of Energy & Environment 4 (2005) 37 – 47
A New Approach for Transmission Embedded Cost Allocation in Restructured Power Market R. Gnanadass* and N. P. Padhy** Department of Electrical Engineering *Pondicherry Engineering College, Pondicherry – 605 014, India **Indian Institute of Technology, Roorkee – 247 667, India Email:
[email protected] (Received on 4 Dec 2004, revised on 23 Mar 2005) ______________________________________________________________________________________ Abstract This paper presents an improved method for allocating embedded cost of transmission to its users by allowing feasible wheeling transactions under restructured power market. The effect of reactive power flow caused by the wheeling transaction has also been taken into consideration while allocating the embedded cost. The magnitude of feasible wheeling transactions is determined by computing the Available Transfer Capability (ATC) of the test systems. Determination of ATC with margins has been carried in combined economic emission dispatch (CEED) environment. The proposed embedded cost allocation methods have been applied to the IEEE-30 bus and the Indian utility - 62 bus systems, and the results obtained are expected to be useful for a restructured power market. ______________________________________________________________________________________
Introduction Throughout the world electrical power utilities are undergoing major restructuring process and are adopting the deregulated market environment [1]. This change has been prompted due to lack of adequate funds to set up the required generation, transmission and distribution facilities, and to bring the improvement in overall efficiency of operation. A key feature of transmission system in a deregulated environment is the need to charge all the users on a non-discriminatory basis. Even though transmission costs are small as compared to power production expenses, they represent a small percentage of the operating costs incurred to the major investor-owned utilities. The transmission system is the most important key to competition because it would provide prices that can create efficiencies in the deregulated power market. The main objective of pricing transmission services is to recover the capital and operating costs of the transmission system operator in addition to the cost of wheeling the power in the system. Shirmohammadi et al. [2] explained the major issues of transmission pricing. Pereira et al [3] presented an approach for the integrated analysis of generation and transmission systems in terms of production costing and wheeling rate calculations. Yu and David [4] have coordinated different pricing alternative to achieve an integrated pricing mechanism including appropriate price signals for bulk users of the transmission system. Lima [5] and Sood et al [6] presented the description and summary of all the existing methods for the allocation of the transmission cost. Embedded cost is defined as the revenue requirements needed to pay for all the existing facilities plus any new facilities added to the power system during the life of the contract for transmission service [7]. Many Independent System Operators (ISO) are using embedded cost approach to price the transmission system usage. Different methods have been used for allocating transmission cost to wheeling transactions under
R. Gnanadass et al./Journal of Energy & Environment 4 (2005) 37 – 47
38
deregulated environment [8-10]. Methods like postage stamp [8] and contract path [10] did not take into account the parallel power flows. The MW-mile method is based on the distance between generation source to the load, and the flow in each line resulted from the transaction [9]. This approach does not give credit for counter flows on transmission lines. The method is complicated because every change in transmission lines or transmission requirement requires a recalculation of flows and changes in all lines. But in this method the reactive power flow changes in the transmission facilities caused by the wheeling transaction have not been considered. Hence MVA-mile method was suggested by the researchers [11]. In the conventional embedded cost allocation approach under both MW-mile and MVA-mile methods, the changes in real and reactive power flow in each facility due to the transactions is multiplied by the length of each facility. It means that power flows in longer lines have more weightage than shorter lines. In practical power systems all the transmission lines are not made up of same conductor, and have different ratings and costs. Hence in this paper, improved embedded cost approaches are formulated such that instead of multiplying the length of the line, it should be multiplied by the average revenue requirement per hour of the facility. The proposed embedded cost allocation approach has been tested on IEEE-30 bus and Indian utility – 62 bus systems under both MW-mile and MVA-mile methods and compared with the conventional allocation approach. Problem Formulation Before computing the transmission pricing, it is necessary to determine the possibility of feasible transactions. The magnitude of feasible wheeling transactions is determined by computing the ATC of the test systems. Then by using the proposed embedded cost methods, the wheeling cost per MWh is computed for the feasible simultaneous bilateral/multilateral transactions. Modeling bilateral/multilateral transactions The conceptual modeling of wheeling transactions is that sellers and buyers encourage the trading between them without violating the transmission constraints. Mathematically, each bilateral transaction between a seller at bus-i and power purchaser at bus-j satisfies the following power balance relationship. Pgi – Pdj = 0
(1)
In the case of multilateral transaction, the summation of power injected in different buses (i) is equal to the summation of load powers taken out at various buses (j).
∑P −∑P k gi
i
k dj
=0
k = 1,2,…tk
(2)
j
where, Pgi and Pdj represent the power injection into the seller bus-i and the power taken out at buyer bus-j, tk is the total number of transactions. Determination of magnitude of feasible wheeling transactions To determine the magnitude of feasible wheeling transactions, initially ATC of the system must be found out. It is defined as the Total Transfer Capability less the Transmission Reliability Margin less the sum of existing transmission commitments (which includes retail customer service) and the Capacity Benefit Margin.
R. Gnanadass et al./Journal of Energy & Environment 4 (2005) 37 – 47
39
According to NERC report [12], ATC is given by ATC = TTC-TRM-Existing Transmission Commitments (including CBM) Transmission Reliability Margin is defined as that amount of transmission transfer capability necessary to ensure that the interconnected transmission network is secure under a reasonable range of uncertainties in system conditions. Capacity Benefit Margin is defined as that amount of transmission transfer capability reserved by load serving entities to ensure access to generation from interconnected systems to meet generation reliability requirements. Utilities would have to determine adequately their ATC’s to insure that system reliability is maintained while serving a wide range of transmission transactions. Determination of ATC will give an idea about the magnitude of feasible transactions allowed between the areas without violating the transmission constraints. In this paper, ATC is determined in the CEED environment. The CEED problem was solved using price penalty factor approach proposed by the authors in [13-14]. Flow-mile methods According to this method the embedded cost of transmission system is allocated based upon the changes in power flow caused by a transaction in a transmission line and length of the line. This method is also called as Line-By-Line Method. This method has been classified into two categories, MW-Mile method and MVA-Mile method as explained below. (i) MW-Mile Method According to MW-Mile method [9], embedded costs of transmission systems are allocated proportionally to the change in the real power flows caused by the transaction in the transmission line and length of the line. Two power flows executed successively, with and without the wheeling transaction T, yield the changes in MW flows in all transmission lines facilities. Only feasible wheeling transactions are encouraged to flow in the system. The transaction cost CCT in $/hr for a transaction T is given as follows.
CCT =
C * ∑ (∆MW f )T L f f
∑ (∑ (∆MW f )T L f ) T
f
where, C = Total transmission annual revenue requirement (∆MWf)T = Change in MW flow in facility due to Transaction T = ⏐MWf (with T)⏐ - ⏐MWf (without T)⏐ (MWf) = MW flow in facility f. Lf = Length of transmission Line f.
(3)
R. Gnanadass et al./Journal of Energy & Environment 4 (2005) 37 – 47
40
The power flow due to pool along a transmission line is also regarded as flow due to a multilateral transaction. In other words the pool may be considered as a multilateral transaction for this purpose. Depending on the direction of power flow, three sub-methods can be distinguished. MWM-net: Negative ∆MW line flow changes whose line loading decreases due to the wheeling transactions are subtracted from the positive ∆MW line flow changes and the wheeling costs are correspondingly lowered or even reversed in sign. This may lead to negative charges. This method is considered in this work. MWM-pos: Only positive ∆MW line flow changes are used in computing the sum of the changes in the Equation (3) and negative ∆MW line flow changes are ignored. In this way, transactions relieving loaded transmission lines are not considered. MWM-gross: Positive and negative ∆MW line flow changes are individually converted to absolute values and added and thus equally contribute to positive wheeling costs. This causes a price to be paid by the wheeling party even if the transmission network is relieved. (ii) MVA-Mile Method It has been recognized that the use of transmission resources is best measured by monitoring both real and reactive power. In all the abovementioned methods reactive power changes in the transmission facilities caused by transaction party are not considered. So a method is required which can take into consideration both active and reactive power loading of the transmission network by transaction and hence allocates embedded cost of transmission accordingly. Two power flows executed successively, with and without the transaction T, yield the changes in MVA flows in all transmission lines facilities. The transaction cost CMT in $/hr or Rs/hr for a transaction T is given by
C MT =
C * ∑ (∆MVA f ) T L f f
∑ (∑ (∆MVA T
f
)T L f )
(4)
f
where, (∆MVAf)T = Change in MVA flow in facility f due to transaction T. In this work, embedded cost-net method is used. Negative changes of power in the line flow changes are subtracted from the positive change of power flow changes. This may lead to negative wheeling charges. It means that they reduce the losses and support the system. Proposed embedded cost formulation In the Flow-Mile methods with the conventional cost allocation approach the changes in flow (MW or MVA) in each facility due to a transaction are multiplied by the length of each facility. It means for the same transmission of power a transmission line with long length will have more weightage over short length line. If all the lines have the same rating then there is no problem. But two transmission lines with same length may have different ratings and different costs, so they have different weightage for cost
R. Gnanadass et al./Journal of Energy & Environment 4 (2005) 37 – 47
41
allocation. Moreover, transmission facilities with FACTS devices are also included in sub-stations of modern power system. Based on the cost of these equipments, it cannot be so easily replaced by their equivalent length. In most of the cases this involves some approximations, which sacrifice the accuracy of flow-mile method. So it has been proposed in this paper that instead of multiplying the changes in the flow (MW or MVA) in the facility by length, it should be multiplied by its cost (i.e. the average revenue requirement per hour of the facility). This will solve the abovementioned problem. The proposed approach may be termed as MW-Cost Method or MVA-Cost Method respectively when charging is based on MW and MVA. (i) MW-Cost Method Embedded costs of transmission systems are allocated proportionally to the change in the real power flows caused by the transaction in the transmission line and length of the line. Two power flows executed successively, with and without the wheeling transaction T, yield the changes in MW flows in all transmission lines facilities. Only feasible wheeling transactions are encouraged to flow in the system. The transaction cost CgT in $/hr for a transaction T is given in the Equation (5).
C gT =
C * ∑ (∆MW f )T C f f
(5)
∑ (∑ (∆MW f )T C f ) T
f
where, C = Total transmission annual revenue requirement (∆MWf)T = Change in MW flow in facility due to Transaction T = ⏐MWf (with T)⏐ - ⏐MWf (without T)⏐ (MWf) = MW flow in facility f. Cf = Average revenue requirement per hour of the facility f. (ii) MVA-Cost Method It has been recognized by the MVA-Mile method that the use of transmission resources is best measured by monitoring both real and reactive power. The proposed approach therefore modifies the MVA-Mile method by allocating embedded cost of transmission using the average revenue requirement instead of the line length. Two power flows executed successively, with and without the transaction T, yield the changes in MVA flows in all transmission lines facilities. The transaction cost ChT in $/hr for a transaction T is given by
ChT =
C * ∑ (∆MVA f )T C f f
∑ (∑ (∆MVA f )T C f ) T
f
where, (∆MVAf)T = Change in MVA flow in facility f due to transaction T.
(6)
R. Gnanadass et al./Journal of Energy & Environment 4 (2005) 37 – 47
42
In this method a transaction causing more reactive power loading will be charged more than other transactions. This method is the most realistic and fair among all the above methods including MW-Cost Method. Simulation Results and Discussion The study has been conducted on IEEE-30 bus [15] and Indian utility-62 bus [14, 16] systems, slightly modified to represent simultaneous wheeling transactions in a deregulated market. In the proposed approach, the minimum generation and the cost of the generating units were obtained in CEED environment with transmission constraints. In order to find the magnitude of feasible wheeling transactions, it is necessary to determine the ATC of the system [14]. After determining the ATC, the proposed embedded cost allocation (MW-mile/MVA-mile) for the simultaneous wheeling transactions were determined. The simulation studies were carried out in P-III 700 MHz system in MATLAB environment. IEEE-30 bus system The proposed algorithm was applied to IEEE-30 bus system with 6 generating units and 41 transmission lines with four tap changing transformers. The total system load demand is 283.4 MW. The proposed algorithm was applied with four simultaneous feasible wheeling transactions (Table 1) on the test system. Then using the conventional embedded cost methods, wheeling costs are calculated and the results obtained for the above test system is given in Table 2. In this table the wheeling costs computed using the conventional embedded cost method and the proposed method are compared. It is observed that the results obtained from the proposed method are fair and accurate whereas in the conventional methods the obtained results are not accurate since they consider only the length of the transmission lines. In the Table 2, the cost due to third bilateral wheeling transaction is negative. It indicates that there is no power loss in the system due to such wheeling transaction and that supports the system. Such wheeling transactions are encouraged by the independent system operator to exchange power in the deregulated environment. The MVA mile method indicates the reactive power support in addition to the real power due to the wheeling transactions in the system. Table 1 Details of feasible simultaneous bilateral transactions Transaction From Bus No. To Bus No. Value of Transaction (MW) T1 14 22 30 T2 16 08 20 T3 25 05 17 T4 15 24 25
R. Gnanadass et al./Journal of Energy & Environment 4 (2005) 37 – 47
43
Table 2 Comparison of wheeling costs by conventional and proposed approaches MW based charge Value of Conventional Embedded Proposed Embedded Cost Wheeling Transaction Cost Method Method Transactions (MW) Cost Cost ($/h) Cost ($/MWh) Cost ($/h) ($/MWh) T1 30 739.841 24.6614 691.899 23.0633 T2
20
471.397
23.5698
503.727
25.1864
T3
17
-659.029
-38.7664
-577.009
-33.9417
T4
25
832.829
Wheeling Transactions
Value of Transaction (MW)
T1
30
T2
20
39.8421
1.9921
161.768
8.0884
T3
17
-487.825
-28.6956
-402.37
-23.6688
T4
25
964.397
38.5759
855.95
34.2390
33.3132 766.419 30.6568 MVA based charge Conventional Embedded Proposed Embedded Cost Cost Method Method Cost Cost ($/h) Cost ($/MWh) Cost ($/h) ($/MWh) 868.622 28.9541 769.688 25.6563
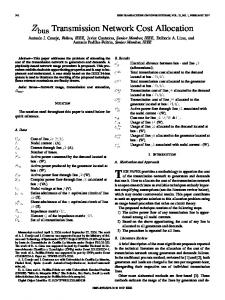
Indian utility - 62 bus system It consists of 19 generators, 89 (220 kv) transmission lines with 11 tap changing transformers. The total load demand is 2909 MW. The one line diagram of the system is shown in Fig. 1. The names of the cities in which the buses connected are given in Annexure I. The proposed algorithm was applied with four simultaneous feasible bilateral transactions (Table 3) and one multilateral transaction (Table 4) on Indian utility system. Embedded cost allocation to these simultaneous bilateral and multilateral wheeling transactions were determined in $/hr as well as $/MWh by the proposed flow mile methods given in Table 5. The results of the proposed method consider the cost of the transmission facility instead of the length of the lines. The cost allocation to transaction T2 is negative in both flow-mile methods. Hence reverse flows are taken into consideration in these methods that favours the system.
R. Gnanadass et al./Journal of Energy & Environment 4 (2005) 37 – 47
Fig. 1 One line diagram – Indian utility – 62 bus system
44
R. Gnanadass et al./Journal of Energy & Environment 4 (2005) 37 – 47
Transaction T1 T2 T3 T4
Table 3 Details of feasible bilateral transactions From Bus No. To Bus No. Value of Transaction (MW) 28 44 36 35 16 06 50 10 05 30 48 34
Table 4 Details of feasible multilateral transaction Bus No. Bus No. Multilateral Value of Value of Transactions From To Transactions (MW) Transactions (MW) 36 67 12 20 42 82 24 10 T5M 54 51 60 68 Total 149 Total 149
Table 5 Comparison for Indian 62-bus system
Wheeling Trans-actions T1 T2 T3 T4 T5M
Wheeling Trans-actions T1 T2 T3 T4 T5M
Value of Transac tions (MW) 36 06 05 34 149 Value of Transac tions (MW) 36 06 05 34 149
MW based charge Conventional Embedded Proposed Embedded Cost Cost Method Method Cost Cost ($/h) Cost ($/h) Cost ($/MWh) ($/MWh) 690.30 19.18 680.40 18.90 -118.13 -19.68 -120.12 -20.02 77.12 15.42 76.50 15.30 492.34 14.48 489.94 14.41 1701.30 11.42 1624.10 10.90 MVA based charge Conventional Embedded Proposed Embedded Cost Cost Method Method Cost ($/h)
Cost ($/MWh)
Cost ($/h)
Cost ($/MWh)
660.30 -150.35 81.30 491.30 1700.31
18.34 -25.06 16.26 14.45 11.42
651.30 -117.90 77.90 482.40 1630.30
18.09 -19.65 15.58 14.18 10.94
45
R. Gnanadass et al./Journal of Energy & Environment 4 (2005) 37 – 47
46
Conclusion This paper has presented an improved approach for allocation of the transmission service embedded cost using the average revenue requirement per hour of the facility instead of the line length as used in the conventional approach. It has been tested on the IEEE-30 bus and Indian utility-62 bus systems. The magnitudes of wheeling transactions were found to determine their feasibility. Simultaneous bilateral and multilateral wheeling transactions were carried out in the test systems to compute wheeling charges. The obtained results of the proposed approach were compared with those from the conventional one to prove their effectiveness. The results justify that transmission pricing should be computed taking into account the cost of the transmission facility due to the wheeling transactions instead of the length of the lines. The findings may also be useful in the deregulated power market. References [1] [2] [3]
[4] [5] [6]
[7]
[8] [9]
[10]
[11]
[12] [13]
H. Rudnick, “Planning in a deregulated environment in developing countries: Bolivia, Chile, Peru,” IEEE power engineering review, Vol. 16, No. 7, 1996, pp 18-19. S. Dariush, R. Chithra, R. A. Eugene and L. T. Chifong, “Cost of transmission transaction-an introduction,” IEEE transactions on power systems, Vol. 6, No. 3, August 1991, pp 1006-1016. M. V. F. Pereira, B. G. Gorenstin, F. M. Morozowski and J. B. Silva, “Chronological probabilistic costing and wheeling calculations with transmission network modeling,” IEEE transactions on power systems, Vol. 7, No. 2, May 1992, pp 885-891. C. W. Yu and A. K. David, “Integrated Approach to Transmission Services Pricing,” IEE generation, transmission and distribution, Vol. 146, No. 3, May 1999, pp 255- 260. L. J. W. Marangon, “Allocation of transmission fixed charges–an overview,” IEEE transactions on power systems, Vol. 11, No. 3, August 1996, pp 1409-1418. S. Y. Raj, N. P. Padhy and H. O. Gupta, “Wheeling of power under deregulated environment of power system–a bibliographical survey,” IEEE transactions on power systems, Vol. 17, No. 3, August 2002, pp 870-878. R. K. Ross and L. L. Allen, “A load flow based method for calculating embedded, incremental and marginal cost of transmission capacity,” IEEE transactions on power systems, Vol. 9, No. 1, February 1994, pp .272-278. H. H. Happ, “Cost of wheeling methodologies,” IEEE transactions on power systems, Vol. 9, No. 1, February 1994, pp 147-156. P. Jiuping, T. Yonael, R. Saifur and J. Koda, “Review of usage-based transmission cost allocation methods under open access,” IEEE transactions on power systems, Vol. 15, No. 4, November 2000, pp 1218-1224. P. Y. Moon, P. J. Bae, L. Jung-UK and W. J Ryul, “An analytical approach for transaction costs allocation in transmission system,” IEEE transactions on power systems, Vol. 13, No. 4, November 1998, pp 1407-1412. Y. C. Chang and C. L. Su, “MVA based transmission supplement cost allocation,” IEEE/PES transmission and distribution conference and exhibition: Asia Pacific, Yokohama, Japan, October 2002, pp 2002-2006. North American Electric Reliability Council (NERC), “Available transfer capability definitions and determination,” NERC report, June 1996. P. Venkatesh, R. Gnanadass and N. P. Padhy, “Comparison and application of evolutionary programming techniques to combined economic emission dispatch with line flow constraints,” IEEE transactions on power systems, Vol. 18, No. 2, May 2003, pp 688-697.
R. Gnanadass et al./Journal of Energy & Environment 4 (2005) 37 – 47
[14]
[15] [16]
47
R. Gnanadass, N. P. Padhy and K. Manivannan, “Assessment of available transfer capability for practical power systems with combined economic emission dispatch,” Electric Power Systems Research, Vol. 69, No. 2-3, May 2004, pp 267-276. O. Alsac and B. Stott, “Optimal load flow with steady state security,” IEEE transactions on power apparatus and systems, Vol. PAS-93, No. 3, May/June 1974, pp 745-751. Planning Wing of Tamilnadu Electricity Board, “Tamilnadu electricity board statistics at a glance– 1999-2000,” Chennai, India, 2001.
Appendix
Bus No. 1. 2. 3. 4. 5. 6. 7. 8. 9. 10. 11. 12. 13. 14. 15. 16. 17. 18. 19. 20. 21. 22. 23. 24. 25. 26. 27. 28. 29. 30. 31.
Major cities of buses – Indian Utility – 62 bus system Bus Name Bus No. Bus Name NMTPS 32. TTPS ETPS 33. NAGERKOIL MANALI 34. KAYATHAR KORATUR 35. TTPAUTO BBGAS 36. TUTICORIN TONPET 37. MADURAI 1 PARRYS 38. ANNUPANKALAM MYLAPOREG 39. ALGARKOIL POONDI 40. PUDUKOTTAI MOSUR 41. TRICHY TVALAM 42. ALUNDUR SPET 43. THANJAVUR ARANI 44. PUGALURSAMYAPUR SPUDUR 45. AM KOYAMBEDUSPK 46. MADURAI 2 OIL 47. SEMBATTY MAPS 48. UDUMALPET 2 KADAPERI 49. KADAMPARAI THARAMANITVM 50. UDUMALPET ALAI 51. KUNDAH VILLUPURAM 52. GOPI CUDDALORE 53. ARASUR NLC 1 54. THUDILIYAR EACHENKADU 55. INGUR N2 MIN4 56. MALCO VILLIYANUR 57. MTRT KADALNKUDI 58. MTPS PERAMBALUR 59. UJANAI TVARUR 60. SALEM 2 KARAIKUDI 61. SALEM 1 PARAMAKUDI 62. DEVIAKURCHI