Journal of Optimization in Industrial Engineering 12 (2013) 79-83
A New Uni-attribute Control Chart to Monitor the Number of Nonconformities Sonia Javadia,*, Seyed Taghi Akhavan Niakib a
MSc, Department of Industrial & Mechanical Engineering, Qazvin Branch, Islamic Azad University, Qazvin, Iran b Professor, Department of Industrial Engineering, Sharif University of Technology, Tehran, Iran Received 8 August, 2011; Revised 15 March, 2012; Accepted 12 October, 2012
Abstract The most well-known uni-arribute control chart used to monitor the number of nonconformities per unit is the Shewhart type C-chart. In this paper, a new method is proposed in an attempt to reduce the false alarm rate in the C-chart. To do this, the decision on beliefs (DOB) concept is first utilized to design an iterative method, where the belief is used to decide whether a process is in an in-control or out-ofcontrol state. Then, a new statistic is defined based on the DOB and the chart is designed accordingly. Some simulation experiments are also performed to evaluate the performance of the proposed scheme and to compare its in-control and out-of-control average run length (ARL) with those of the C and the EWMA charts in different scenarios of mean shifts. Finally, a case study is given to illustrate the application of the proposed methodology. The results show the proposed control chart outperforms the other two charts. Keywords: Uni-attribute quality control; Process monitoring; Number of nonconformities; Beliefs; C-chart.
1. Introduction and Literature Review limits approach. Tsai et al. (2006) conducted the main work in the first class, which is based on an improved square root transformation (ISRT) to transform the Poisson distribution into a symmetric distribution. As a study falling into the second category, Quesenberry (1991) presented a Q-chart. This control chart is a wellknown classic data-standardizing chart that is based on an approximation of a discrete distribution to a normal distribution. In the third class, Rayan and Schwertman (1997) suggested the optimal control chart limit C-chart. Moreover, Winterbottom (1993) suggested simple adjustments to improve control limits on the attribute charts, and Kittlitz (2006) developed a procedure to calculate the almost exact control limits for a C-chart. It is very beneficial and economical to use information technology (IT) to collect observations for the Shewharttype control charts. In this regard, Niaki and Fallah Nezhad (2009) maintained that sequential analysis is an important subject in IT that greatly improves the applications of data analysis. In this type of analysis, the number of required observations is not fixed in advance, but is a stochastic variable that depends on the values of the gathered observations. In other words, the data gathering in sequential analysis, in contrast to frequency analysis, is on-line. This concept was used as a tool in statistical applications as well, where Eshragh-J and Modarres (2001) were the first who used sequential
Variation is an inherent element of all industrial and non-industrial environments. If the variation is due to an assignable cause, then the process is designated to be outof-control by a quality control chart. In other words, the major role of a quality control chart is to identify assignable causes. The process data used in a control chart can be classified into two groups of continuous and discrete, initiating two types of variable and attribute control charts to be employed, respectively. There are a few control charts, despite having a wide application, to monitor defects and nonconformities in contrast to the variable control charts. According to Okland (2003), a control chart monitoring the number of defects can be used for manufacturing purposes and a control chart monitoring the number of accidents per week may be employed in non-manufacturing environments. The p, np, C, and u charts are well known Shewhart-type schemes to monitor attribute characteristics, where the C-chart monitors the number of nonconformities per unit. Due to the ineffectiveness of the C-chart in identifying process faults, researchers have developed new attribute schemes in recent years, of which some are proposed to increase the power of the C-chart. Aebtarm and Bougulia (2011) classified these studies based on their approaches into three categories: the transforming data approach, the standardizing data approach, and the optimizing control *Corresponding author E-mail:
[email protected]
79
Sonia Javadi et al./ A New Uni-attribute Control Chart...
analysis to find the best probability distribution of the observed data. They introduced a new concept called decision on belief (DOB) to solve their problem. Later, Fallah Nezhad and Niaki (2009) proposed a new scheme based on the DOB to monitor the mean and to diagnose the faults of bivariate quality control processes. Fallah Nezhad and Niaki (2010) employed this concept to analyze and classify the states of uni-variate quality control systems as well. In this paper, we firstly apply the DOB and propose a new method to monitor the number of nonconformities in uni-attribute processes, where the belief is defined as a probability measure of an in-control state. This statistic (belief) is updated in the sequential iterations of the data gathering process until an out-of-control signal is detected. Then, the performances of the new methodology is compared to those of other uni-attribute schemes such as the C and the exponentially weighted moving average (EWMA) schemes in terms of the average run lengths based on some simulation experiments. The rest of the paper is organized as follows: in Section 2, the new statistics (called belief) is defined and the statistical method used to build the upper and the lower control limits is explained. Section 3 contains some simulation studies to evaluate and compare the performance of the proposed procedure with that of the other two schemes. A case study is also given in Section 4 to demonstrate the application and to compare the performances. Finally, the conclusion is drawn in Section 5.
=
√
=
(3) √
√
Then, the recursive equation will be =
=
√
√
(4)
that is updated in the sequential iterations by =
=e
√
√λ
=⋯=
√λ
∑
e
√λ
; p = 1,2, …
(5)
where the initial value of Z using equation (2) is Z = 1, since the belief in its initial stage is B(O )= 0.5. Using equation (5), we have ( ) = ∑ (6) √
Since ∑ x follows a Poisson distribution with mean pλ, its limiting distribution using the central limit theorem is normal with both mean and variance pλ. In other words, ~ (0,1)
(7)
and
Assuming a single observation is obtained in a data gathering iteration of a process of interest with a single attribute quality characteristic (the number of nonconformities), the aim of the proposed scheme is to monitor the mean number of nonconformities. Let O = x ,x ,…,x be the vector of observation at the p iteration, where x ; i = 1,2, … is an observation on the number of nonconformities on an inspected product (or service). Define B x , O the belief of the process to be in-control. This measure is the probability of the process to be in-control based on the observation vector obtained until the (p − 1) iteration and the observation are obtained in the p iteration. The number of nonconformities usually follows a Poisson distribution with mean λ and variance λ. Noting that the prior belief in an in-control state is B O = B x , O , to update the belief in an iteration we define =
(2)
√
∑
,
=
,
that is obtained as
2. The proposed scheme
√
,
=
(
) = ∑
√
~
(0,1)
(8)
Hence, the upper and the lower control limits of a Shewhart-type control chart for Ln(Z ) are obtained using equations (9) and (10), respectively as follows: = (9) = −
(10)
Where the c is a multiple of standard deviation of Ln z and is chosen in a way that the proposed scheme has a desired probability of type-I error, α, i.e., − ≤ ≤ = 1− (11) Since computing Ln z for small values is hard, B x ,O is used instead, i.e. substituting equation (2) for (11), we have
(1)
√
P –
Then, we define the new statistic
80
≤
, ,
≤
=1−
(12)
Journal of Optimization in Industrial Engineering 12 (2013) 79-83
standard deviations of the run lengths (SD) of the proposed scheme are the smallest as well. Note that for an in-control average run length of 320, the c-value is obtained to be one using a trial and error approach.
or √
,
≤
√
≤
,
= 1−
(13)
Table 1 The
comparison for λ=5 The Shifts proposed SD method 1.009 0.0099 1σ 1.0007 0.0021 2σ 1.00006 0.00054 3σ 1.0088 0.0111 -1σ 1.00099 0.002 -2σ 1.000191 0.00108 -3σ
and P
√
+1 ≤
√
≤
,
+ 1 = 1 − (14)
The simplicity of the equation (14) leads to a 100(1 − α) % confidence interval for B x , O as P
≤
,
≤
=1−
(15)
As a result, the upper and the lower control limits for B x ,O are obtained by ,
=
,
,
EWMA 7.94 2.52 1.49 7.33 2.46 1.45
SD 5.52 1.26 0.61 4.72 1.32 0.64
C
SD
18.31 4.30 1.81 20.15 2.98 1.45
18.59 3.74 1.26 37.59 9.07 3.02
3.2. Performance comparisons on a Poisson process with λ=10
=
In this example, the mean of the uni-attribute Poisson process is 10. To compare the performance of the proposed scheme to that of the C and the EWMA charts, the parameters of the charts are set such that all give an in-control average run length of almost 320. Then the outof-control average run lengths of all charts are estimated based on 10,000 independent simulation replications using different scenarios of mean shifts in terms of multiples of standard deviation. The results are summarized in Table 2. Once again these results indicate that the proposed method outperforms the other two methods. Note that for an in-control average run length of 320, the c-value is obtained to be 0.85 using a trial and error approach.
(16) The above limits are used to monitor the mean number of nonconformities of the process at hand. In the next section, simulation experiments are performed to evaluate the performance of the proposed methodology. While the C and the EWMA schemes are traditional quality control charts to monitor uni-attribute processes, they are used along with the proposed scheme in the experiments for performance comparison in terms of in-control and out-of-control average run length (ARL and ARL ) criteria under different scenarios of process mean shifts.
Table 2 The
3. Simulation Studies
Shifts
Simulation experiments are performed in this section for the two different process means of 5 and 10 (λ=5, λ=10). The results based on 10,000 independent replications are summarized in Tables 1 and 2. The value of c is obtained under the circumstances that the ARL is almost 320 in each scenario.
1σ 2σ 3σ -1σ -2σ -3σ
comparison for λ=10 The proposed SD method 1.006 0.0099 1.000 0.0019 1.00004 0.00044 1.0060 0.0089 1.00092 0.0024 1.000136 0.00081
EWMA
SD
C
SD
7.85 2.54 1.435 7.368 2.50 1.442
5.56 1.355 0.591 4.87 1.35 0.617
20.38 4.39 1.66 20.16 5.30 1.665
20.12 3.89 1.076 42.8 10.9 1.03
3.1. Performance comparisons on a Poisson process with λ=5 In the next section a case study is provided to demonstrate the applicability of the proposed methodology.
To compare the performance of the proposed scheme to that of the C and the EWMA charts, the parameters of all charts are set in a way that all give an in-control average run length of almost 320. Then the out-of-control average run lengths of all charts are estimated based on 10,000 independent simulation replications using different scenarios of mean shifts in terms of multiples of process standard deviation. The results summarized in Table 1 show that compared to the other two schemes, the proposed method has the best performance, with its ARL being the smallest in all mean-shift scenarios. The
4. A Case Study Consider a manufacturing process that produces items with a number of nonconformities per unit as a single quality characteristic. The aim is to monitor the mean number of nonconformities per unit. Assuming a Poisson process with mean λ=5, twenty observations are randomly
81
Sonia Javadi et al./ A New Uni-attribute Control Chart...
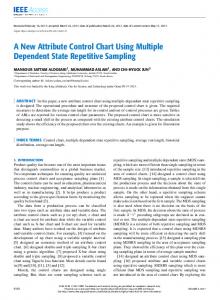
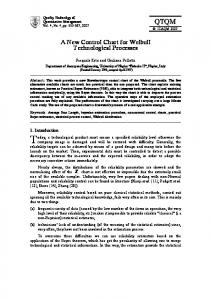
generated as given in Table 3. These observations are then plotted in Figure 1 for the three competing schemes using the Minitab software. All plots obviously show the process is actually in-control. The observations are then shifted one unit and the three charts are employed to monitor the in-control process mean of 5. Figure 2 depicts the corresponding plots, where the only chart that is capable of detecting the shift is the one proposed in this research. This again shows the advantage of the proposed scheme over the traditional charts. Table 3 The observations of the case study NO. Obs. NO. Obs. 1 6 11 4 2 2 12 2 3 10 13 5 4 6 14 7 5 4 15 6 6 1 16 6 7 9 17 8 8 3 18 4 9 1 19 6 10 6 20 2
Chart 3: The proposed control chart Fig. 1. The control charts of the in-control state
EWMA Chart of C2 9
UCL=8.886
8
EWMA
7 _ _ X=5.9
6 5 4
EWMA Chart of C1 8
UCL=7.886
3
LCL=2.914
7
1
3
5
7
9
11 Sample
13
15
17
19
EWMA
6 _ _ X=4.9
5
C Chart of C2 14 UCL=13.19
4
12 3
10 2 1
3
5
7
9
11 Sample
13
15
17
Sample Count
LCL=1.914 19
C Chart of C1
8 _ C=5.9
6 4
12
UCL=11.54
2
10
Sample Count
0 8
LCL=0 1
6
3
5
7
9
11 Sample
13
15
17
19
_ C=4.9
4
Chart 1: The EWMA control chart Chart 2: The C control chart
2 0
LCL=0 1
3
5
7
9
11 Sample
13
15
17
19
Chart 1: The EWMA control chart Chart 2: The C control chart
Chart 3: The proposed control chart Fig. 2. The control charts of the out-of-control state
82
Journal of Optimization in Industrial Engineering 12 (2013) 79-83
[10] Winterbottom, A. (1993). Simple adjustments to improve control limits on attribute charts. Quality and Reliability Engineering International, 9, 105-109.
5. Conclusions In this paper, a new approach was proposed to monitor the mean of single attribute quality control systems, with the attribute being the number of nonconformities per unit of a manufactured item. To do this, a new concept called decision on belief (DOB) was used to develop a new statistic. In the proposed methodology, the belief of the process being in-control was updated in different iterations of the data gathering process. The upper and the lower control limits on the belief were then obtained. Afterwards, the limits were used to monitor the process mean. To evaluate the performance of the proposed method, two examples were used, in which the proposed control chart outperformed the traditional C and EWMA schemes in terms of the out-of-control average run length based on 10,000 independent simulation experiments under different scenarios of the process mean shifts. According to Table 1, for a special mean λ=5, the average run lengths for six shifts in mean are calculated and the results reveal that the proposed method has a little ARL in compression with the others. In Table 2, the second example is presented to illustrate another special mean λ=10, and the results of calculating the ARL for the C, EWMA and the proposed method. The findings show that the the proposed method is able to identify the flutes quicker than the other two methods. Moreover, the case study provided demonstrates the application of the proposed methodology.
6. References [1]
[2] [3] [4]
[5]
[6] [7] [8] [9]
Aebtarm, S. and Bouguila, N. (2011). An empirical evaluation of attribute control charts for monitoring defects. Expert Systems with Applications, 38,7869-7880. Eshragh, J.A. and Modarres, M. (2001). A new approach to distribution fitting: decision on beliefs. Journal of Industrial and Systems Engineering, 3, 56-71. Fallah Nezhad, M.S. and Niaki, S.T.A. (2010). A new monitoring design for uni-variate statistical quality control charts. Information Sciences,180,1051-1059. Kittlitz, R.G. Jr. (2006). Calculating the (almost) exact control limits for a C-chart. Quality Engineering, 18,359366. Niaki, S.T.A. and Fallah Nezhad, M.S. (2009). Decisionmaking in detecting and diagnosing faults of multivariate statistical quality control systems. International Journal of Advanced Manufacturing Technology, 42,713-724. Okland, J.S. (2003). Statistical process control (5th ed.). Butterworth Heinnemen. Quesenberry, C.P. (1991). SPC Q charts for start-up processes and short and long runs. Journal of Quality Technology, 23,213-224. Rayan, T.P. and Schwertman, N.C. (1997). Optimal limits for attributes control charts. Journal of Quality Technology, 29, 86-98. Tsai, T. , lin, C. and Wu, S. (2006). Alternative attribute control charts based on improved square root transformation. Tamusi Oxford Journal of Mathematical Sciences, 22, 61-72.
83