Intelligent Information Systems 2008. ISBN 978-83-60434-44-4, pages 25â34. A non-parametric regression approach for missing value imputation in microarray.
Intelligent Information Systems 2008 ISBN 978-83-60434-44-4, pages 25–34
A non-parametric regression approach for missing value imputation in microarray Yi Cao, Kim Leng Poh, and Wen Juan Cui Department of Industrial and Systems Engineering, National University of Singapore, Singapore
Abstract Microarray experiments often generate data sets with multiple missing expression values. Estimating these missing values is very important since they affect biological applications and many multivariate statistical analyses. A limitation of the existing estimating methods is that they assume the relations between genes to be linear. However, that is not always the case. In this paper, we propose a new method based on non-parametric regression combined with nearest neighbor approach, referred to as N P RA, which can capture both linear and non-linear relations between both genes and arrays. A comparative study of the imputation methods was performed on several public datasets, and our proposed method N P RA, exhibits competitive performance when compared to other methods over various datasets and percentage of missing values. Keywords: microarray, missing value, imputation, non-parametric regression
1 Introduction DNA microarrays provide high throughput investigation on the expression levels of thousands of genes simultaneously under various conditions (Spellman et al., 1998). Microarrays have been used in the study of a wide range of biological processes, varying from identification of genes relevant to a certain diagnosis or therapy (Cho et al., 2003), differential gene expression in human tumors (Perou et al., 2000) and cancer prognosis prediction (Alizadeh et al., 2000; vant Veer et al., 2002), to yeast sporulation (Troyanskaya et al., 2001). In spite of the broad usage of microarray data, they commonly contain missing values due to various reasons, such as slide scratches, insufficient resolution, image corruption or simply dust on the slides. Missing values in microarry affect biological applications and many multivariate statistical analyses, such as principal component analysis (PCA), singular value decomposition (SVD), and support vector machines (SVMs), since most of the current available algorithms require the data to be complete. Therefore, missing value imputation is an actual challenging issue in the field of machine learning and data mining. There are several simple approaches to deal with missing values, mainly including ignoring the genes containing missing values from further analysis, although it
26
Yi Cao et al.
will usually lose too much useful information, repeating the experiments, although this strategy can be expensive and time-consuming, and imputing the missing values by zero or row average, although it might lead to high estimation errors (Troyanskaya et al., 2001), due to not taking gene (or sample) correlation into consideration. It has been proven that if the correlation between genes are considered then missing value prediction error can be reduced significantly (Hellem et al., 2004). Currently many approaches have been developed to recover missing values, such as k-nearest neighbour (KNN) (Troyanskaya et al., 2001), Bayesian PCA (BPCA) (Oba et al., 2003), least square imputation (LSimpute) (Hellem et al., 2004), local least squares imputation (LLSimpute) (Kim et al., 2005) and least absolute deviation imputation (LADimpute) (Cao and Poh, 2006). In this paper, we present a novel method based on non-parametric regression to estimate missing values. We refer to this new method as N P RA in the remaining of this paper. Some exising methods assume the linear relations between genes. However, that is not always the case. We explore non-parametric regression techniques, since it captures both linear and non-linear relations. We first exhibit two basic N P RA methods: N P RAgene and N P RAarray , and then introduce N P RAcombined , which takes weighted average of estimates from N P RAgene and N P RAarray . The aim of N P RAcombined is to make the performance be at least as good as the best estimate from two component methods. The remainder of the paper is organized as follows. In Section 2, we give a detailed review of existing imputation techniques. In Section 3, our novel method is proposed and developed based on non-parametric regression. Section 4 provides experimental results and comparisons on three public data sets. Section 5 concludes this paper with conclusion and future work.
2 A review of existing imputation techniques The following notations are for all imputation techniques in this paper. Assume microarray data is in the format of an m × n matrix G = (gij )m×n , where m is the number of genes and n is the number of experiments and the element gij represents the expression level of gene i in the jth sample. That some entries in G may be missing is denoted by an addition matrix M = (mij ) where mij = 0 if the entry is missing and mij = 1, otherwise. A review is now exhibited to discuss the strengths and limitations of four imputation methods used for comparative purpose in evaluating the performance of N P RA. 2.1 KNN imputation KNN method can be regarded as an improved hot deck imputation method (Chen and Shao, 2001) that uses the weighted average values of most similar genes for estimating missing values. In KNN method, given target gene gt , k-nearest neighbor genes gsi (i = 1 . . . k) are first taken from matrix G except any genes that have the same missing position as gt . Euclidean distance is used as a metric during the process of selecting similar genes.
Missing Value Imputation in Microarray
27
Currently there is no absolutely golden rule for the selection of k. A small k will overemphasize a few dominant genes in estimating the missing values, whereas a large k leads to include the genes that have little or even no correlation with target gene. Troyanskaya et al. (2001) suggest that KNN is relatively insensitive to the exact value of k within the range of 10-20 neighbors. It’s already pointed out that a drawback of KNN is that it does not consider negative correlations between data, which might lead to estimation errors. 2.2 Least square imputation LSimpute is a regression-based estimation method that is based on the least squares principle and utilizes correlations between both genes and arrays. The least squares principle is based on minimizing the sum of squared errors of a regression model. Two basic LSimpute methods, one utilizing correlations between genes (LSimputegene ) and the other using correlations between arrays as a basis for the estimation (LSimputearray ), are proposed. The motivation underlying the correlations for the estimation is the cellular co-regulation of genes in functional processes (Hellem et al., 2004). Furthermore, LSimputecombined is proposed, which uses a fixed global weighting of the estimates from the basic methods and is actually the combination of LSimputegene and LSimputearray . LSimpute performs best when data have a strong local correlation structure and it has the same order of computational complexity as KNN. 2.3 Bayesian PCA imputation BPCA method consists of three elementary processes that are principal component (PC) regression, Bayesian estimation and expectation-maximization (EM)like repetitive algorithm. In PC regression, missing values Gmiss in G are estimated from those genes having no missing value Gobs by using the PCA result. Finally, the missing values in the expression matrix G are estimated to the expectation with respect to the estimated posterior distribution (Oba et al., 2003): Z ˆ miss = Gmiss q(Gmiss )dGmiss , G (1) q(Gmiss ) = p(Gmiss |Gobs , θtrue ).
(2)
BPCA also depends on the number of principal axes (eigenvectors) k, similar as in KNN. Moreover, BPCA might not be very accurate if genes have dominant local similarity structures due to the assumption of only a global covariance structure and sometimes it has a high computational burden because of iteration process. 2.4 Local least square imputation LLSimpute method is also a least squares based imputation method, where a target gene that has missing values is represented as a linear combination of similar genes (Kim et al., 2005). However, it should be noticed that LLSimpute and LSimpute use different approaches for imputation although both are least squares related. LSimpute method explores univariate linear regression, while LLSimpute method
28
Yi Cao et al.
employs multivariate linear regression with respect to least squares (LS) estimate. The main contribution of Kim et al. (2005) is that they proposed a heuristic algorithm for estimating parameter k, which makes LLSimpute so-called a nonparametric missing value estimation method like BPCA.
3 Proposed Method Both LLSimpute and LSimpute method assume the linear relations between genes. However, it is almost impossible to know exactly the relations to be linear. Under such circumstances non-parametric regression techniques is explored, since it captures both linear and non-linear relations. The general non-parametric regression model is written in the following manner yi = f (Xi′ ) + ei = f (xi1 , xi2 , . . . , xik ) + ei ,
i = 1 . . . n.
(3)
where f (·) is a smooth and continuous but unspecified function and ei is the normally distributed error with mean 0 and variance σ 2 . Moreover, the objective of non-parametric regression is to estimate the regression function f (·) directly rather than to estimate parameters. An important special case of the general model is non-parametric simple regression, where there is only one predictor yi = f (xi ) + ei , i = 1 . . . n.
(4)
Only single regressor cases and Kernel regression are presented and used in our algorithm. The reason why we use only one regressor is that currently there is no good algorithm for estimating f (·) in the case of multiple regressors. Similar to parametric regression, a weighted sum of the yi is used to obtain the fitted values as following, n X wij(ker) yj , (5) yˆi(ker) = j=1
and
K[(xi − xj )/h] wij(ker) = P , n K[(xi − xj )/h]
(6)
j=1
where K(u) is called Kernel function and h > 0 is called the bandwidth. It has been pointed out that it is not the choice of kernel function but the choice of bandwidth, that is critical to performance of the nonparametric regression. Therefore, in this paper the widely used Gaussian kernel function will be employed in our algorithm: 2 K(u) = (2π)−1/2 u−t /2 . (7) Small value of h would make the resulting fit undersmoothed or overfit and possess high variance, whereas large value of h would lead to oversmoothed, or underfit with high bias. Currently, there is no generally accepted method for choosing the bandwidth h. Methods available consists of subjective choice and automatic methods such as plug-in, cross-validation, and penalizing function approaches. We explore cross-validation method in our paper.
29
Missing Value Imputation in Microarray
The proposed N P RA method, which is detailed in Figure 1, is an imputation method based on non-parametric regression combined with nearest neighbor approach. For simple clarification, we suppose value gIJ of gene I and sample J is missing, then gene I is denoted by target gene gt and sample J is denoted by target array at . Algorithm: Input: dataset with missing values • • • • • • •
Step 1: Locate missing value gIJ . Step 2: Compute the distance between target gt and predictor gene by (8). Step 3: Select the nearest neighbor predictor gene to get estimate γ1 by (9). Step 4: Compute the distance between target at and predictor array by (10). Step 5: Select the nearest neighbor predictor array to get estimate γ2 by (11). Step 6: Impute gIJ with γ from (12). Step 7: Look for the next missing entry and repeat step 2-6 until there is no missing entry left.
Output: dataset with no missing value Figure 1: The NPRA algorithm
3.1 The N P RAgene method Given target gene gt which contains missing value gIJ , the N P RAgene method requires finding the nearest neighbor based on Euclidean distance between predictor gene and target gene. The motivation underlying this method is on basis of the cellular co-regulation of genes in functional processes (Spellman et al., 1998). The distance is defined as follows,
dp =
n P
mpj mIj (gpj − gIj )2
j=1 n P
,
(8)
mpj mIj
j=1
where gp is the predictor gene vector and gI the expression vector of target gene. Each gene except target gene is consider as predictor gene sequentially and distance is calculated by (8). In addition, gp is not allowed to have a missing value in the Jth column. Finally we get that gene which has the least distance away from gt , denoted by gp∗ . Notice that the simultaneously observable elements in vector of gt and gp∗ can be considered as training data to estimate f (·) in equation (4), then γ1 , the estimate value for gIJ , is calculated based on equation (5) and (6) as follows, γ1 = fˆg (gp∗ J ). (9)
30
Yi Cao et al.
3.2 The N P RAarray method In the expression matrix, the dataset might contain array (i.e column) hybridizations of biological samples obtained from similar tissues or from neighboring time points in time series experiments. This might lead to the correlation between expression profiles from different arrays. Moreover, if different columns represent measurement obtained from biologically similar samples, the corresponding columns in the gene expression matrix are expected to be correlated (Hellem et al., 2004). This can be exploited in N P RAarray method for imputation of missing values. The procedure of N P RAarray method is quite similar to that of N P RAgene method. Given target array at , the N P RAarray method first finds the nearest neighboring array based on Euclidean distance,
dq =
m P
miq miJ (giq − giJ )2
i=1 m P
,
(10)
miq miJ
i=1
where aq is the predictor array vector and at the expression vector of target array. Also, aq is not allowed to have a missing value in the Ith row. Similarly, that array which minimizes (10) is denoted by aq∗ . Finally, γ2 , the estimate value for gIJ , is calculated based on equation (5) and (6) as follows, γ2 = fˆa (gIq∗ ),
(11)
where fˆa (·) is the estimate function derived from the training data that must be simultaneously observed in at and aq∗ . 3.3 The N P RAcombined method An obvious drawback of N P RAarray appears where the samples are biologically diverse in experiments. This may lead to poor performance for imputation by N P RAarray method. Under such circumstance, we propose N P RAcombined method, which takes weighted averages of the estimates from N P RAgene and N P RAarray such that its performance will be at least as good as the best estimate from two component methods. In other words, γ, the estimate value of gIJ by N P RAcombined method is described as γ = µγ1 + (1 − µ)γ2 ,
µ ∈ [0, 1]
(12)
where γ1 and γ2 are estimate values from N P RAgene and N P RAarray method respectively. To determine the value of µ, we need to re-estimate some known values in the dataset by marking them as missing. Considering the deviations between the estimate values and known values ε1 = γ1 − γ0 and ε2 = γ2 − γ0 , where γ0 is the true value, the best weighted coefficient, µ∗ is to minimize the sum of squared errors for the re-estimated data, X X (γ − γ0 )2 . (13) ε2 = arg min µ∗ = arg min µ
µ
Missing Value Imputation in Microarray
31
We perform a loop of 10 iterations to determine the value of µ∗ and finally let it be the mean of these 10 values from the loop. Notice that ε∗ = µ∗ ε1 + (1 − µ∗ )ε2 , µ∗ ∈ [0, 1], therefore, X X X 2 ε21 , ε22 ) (14) ε∗ ≤ min( Under the assumption that the joint distribution of ε1 and ε2 is the same for the re-estimated data as for the missing values, (14) guarantees that the mean squared error of N P RAcombined will be smaller or equal to that of the best of its two component methods.
4 Results 4.1 Datasets In order to assess our proposed method, three publicly available microarray datasets are used in our experiments. The first dataset is from a study of response to environmental changes in yeast (Gasch et al., 2000). It contains 6152 genes and 173 experiments that have time-series of specific treatments. After removing columns having more than 10% missing values and then selecting genes that don’t have missing value, we got a complete matrix of 2239 genes and 159 experiments (Gasch). The second dataset is the cDNA microarray data relevant to breast cancer (BC) (Hedenfalk et al., 2001). This dataset consists of 7 breast cancer samples with mutation in the BRCA1 gene, 8 with mutation in the BRCA2 gene, and 7 sporadic cases with neither mutations detected (Nguyen et al., 2004). This dataset which has multiple experiments with no time course relationships consists of 3213 genes, and was log-transformed before applying the imputation methods. The third dataset is from the study for the identification of cell-cycle regulated genes in yeast Saccharomyces cerevisiae (Spellman et al., 1998). We built a complete data matrix of 2515 genes and 69 experiments (SP) after removing all gene rows that have missing values. In order to evaluate the performance of imputation methods, a portion of missing values are introduced by randomly knocking out values in the above three complete expression matrix. Hence, yreal is known because the missing entries are artificial. The performance of the missing value estimation method is evaluated by root mean squared error (RMSE): v u N uP u (yguess − yreal )2 t , (15) RM SE = i=1 N where yguess is the imputed value, and N is the number of missing values. 4.2 Experimental results The performance of N P RA method is compared with previously developed KNN, LSimpute and LLSimpute method by randomly knocking out data (labeling as
32
Yi Cao et al.
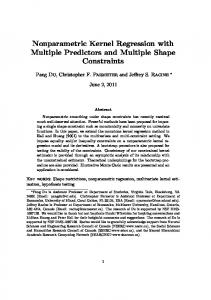
*DVFK ���
506(
���� .11 /6LPSXWH //6LPSXWH 135$BFRPE
��� ���� ��� ���� ��
�� ��� ��� UDWH�RI�PLVVLQJ�HQWULHV
���
Figure 2: Comparison of the RMS errors of different methods as a function of rate of missing entries on Gasch dataset
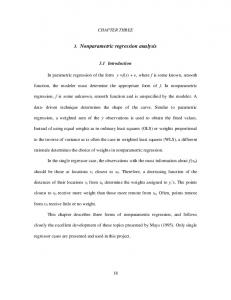
506(
%UHDVW�&DQFHU � ���� ��� ���� ��� ���� ��� ���� ��� ����
.11 /6LPSXWH //6LPSXWH 135$BFRPE
��
�� ��� ��� UDWH�RI�PLVVLQJ�HQWULHV
���
Figure 3: Comparison of the RMS errors of different methods as a function of rate of missing entries on BC dataset
missing). k = 10 was used for KNN and LSimpute, since it has been pointed out (Troyanskaya et al., 2001) that KNN is insensitive to value of k in the range between 10 and 20 and k = 10 is suggested in LSimpute by Hellem et al. (2004), whereas in LLSimpute k = 100 was explored (Kim et al., 2005). To test the robustness of N P RA method, experiments were performed for missing entries from 1% up to 20% over three different datasets. As shown from Fig.2. and Fig.3., our proposed method N P RA outperforms all the other methods consistently, though the difference between N P RA and LLSimpute is not very significant, and KNN method performs the worst for these two datasets. Fig.4.
33
Missing Value Imputation in Microarray
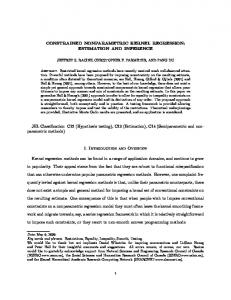
6SHOOPDQ ���� ��� .11 /6LPSXWH //6LPSXWH 135$BFRPE
506(
���� ���� ���� ���� ��� ��
�� ��� ��� UDWH�RI�PLVVLQJ�HQWULHV
���
Figure 4: Comparison of the RMS errors of different methods as a function of rate of missing entries on SP dataset
exhibits excellent performance of N P RA over the others, and LLSimpute performs the worst for this dataset. The performances presented by N P RA method are less sensitive to missing rate, shown from Fig.2-4. One possible reason for the satisfactory performance of N P RA is that it captures both linear and non-linear relations between genes and between arrays, while KNN, LSimpute and LLSimpute only consider the linear relations. The other reason is that the results by KNN, LSimpute and LLSimpute method are more or less affected by the choice of k.
5 Conclusion and Future Work This paper has proposed a novel N P RA method based on non-parametric regression combined with nearest neighbour approach. As demonstrated by our three experimental datasets (time-series, non-time series and mixed data set), the performance of N P RA consistently exhibits superior accuracy compared to the existing imputation methods, such as KNN, LSimpute and LLSimpute method. Our experiments have shown that N P RA method is a robust and accurate missing value estimation method and can be applied to impute missing values accurately. In this paper we only considered the case of missing at random. However, that may not truly reflect the nature of actual microarray missing values. A real microarray data set usually has non-random distribution of missing data. Missing not at random (MNAR), which is a more complex missing data mechanism, could be included in our future research. In addition, We would also like to take a couple of genes into account in non-parametric regression model to impute missing value, instead of considering only one regressor in this paper. Another thing is to show the real impact of imputation methods on subsequent data analyses which will make it convincing why the accuracy of imputation methods is so important.
34
Yi Cao et al.
References A.A. Alizadeh, M.B. Eisen, R.E. Davis, C. Ma, I.S. Lossos, J. Rosenwald, A.and Boldrick, H. Sabet, T. Tran, and X Yu (2000), Distinct types of diffuse large B-cell lymphoma identified by gene expression profiling, Nature, 403:503–511. Y. Cao and K. L. Poh (2006), An accurate and robust missing value estimation for microarray data: least absolute deviation imputation, in Proceedings of 5th International Conference on Machine Learning and Applications (ICMLA’06), pp. 157–161. J. Chen and J. Shao (2001), Jackknife variance estimation for nearest neighbour imputation, Journal of the American Statistical Association, 96:260–269. J.H. Cho, D. Lee, J.H. Park, and I.B. Lee (2003), New gene selection method for classification of cancer subtypes considering within-class variation, FEBS Lett., 551:3– 7. A.P. Gasch, P.T. Spellman, C.M. Kao, O. Carmel-Harel, M.B. Eisen, Storz G., and Botstein DBrown P.O. (2000), Genomic expression programs in the response of yeast cells to environmental changes, Molecular Biology of the Cell, 11:4241–4257. I. Hedenfalk, D. Duggan, Y. Chen, M. Radmacher, M. Bittner, R. Simon, P. Meltzer, B. Gusterson, M. Esteller, O. Kallioniemi, B. Wilfond, A. Borg, and J. Trent (2001), Gene-expression profiles in hereditary breast cancer, The New England Journal of Medicine, 344:539–548. T. Hellem, B. Dysvik, and I. Jonassen (2004), LSimpute: accurate estimation of missing values in microarray data with least squares methods, Nucleic Acids Research, 32:e34–e34(1). H. Kim, Gene H. Golub, and Haesun Park (2005), Missing value estimation for DNA microarray gene expression data: local least squares imputation, Bioinformatics, 21:187– 198(12). Danh V. Nguyen, Naisyin Wang, and Raymond J. Carroll (2004), Evaluation of missing value estimation for microarray data, Journal of Data Science, 2:347–370. S. Oba, M. Sato, I. Takemasa, M. Monden, K. Matsubara, and S. Ishii (2003), A Bayesian missing value estimation method for gene expression profile data, Bioinformatics, 19:2088–2096. C.M. Perou, T. Sorlie, M.B. Eisen, M. van de Rijn, S.S. Jeffrey, C.A. Rees, J.r. Pollack, D.T. ross, H. Johnsen, and L.A. Akslen (2000), Molecular portraits of human breast tumors, Nature, 406:747–752. P. Spellman, G. Sherlock, M. Q. Zhang, V. R. Iyer, K. Anders, M. B. Eisen, P. O. Brown, D. Botstein, and B. Futcher (1998), Comprehensive identification of cell cycle-regulated genes of the yeast saccharomyces cerevisiae by microarray hybridization, Molecular Biology of the Cell, 9:3273–3297. O. Troyanskaya, M. Cantor, G. Sherlock, Brown P., T. Hastie, R. tibshirani, D. Botstein, and R.B. Altman (2001), Missing value estimation methods for DNA microarray, Bioinformatics, 17:520–525(6). L.J. vant Veer, H. Dai, M.J. van de Vijver, Y.D. He, A.A. Hart, M. Mao, H.L. Peterse, K. van der Kooy, M.J. Marton, and A.T. Witteveen (2002), Gene expression profiling predicts clinical outcome of breast cancer, Nature, 415:530–536.