contact modeling, the inclusion of cartilage, and the modeling of the full lumbar spine. ...... and then imported and joined to the ADAMS rigid body of the facet at the layer's center of mass ...... Clin Biomech (Bristol, Avon) 2007; 22(4): 377-84. 25.
A NONLINEAR CONTACT ALGORITHM PREDICTING FACET JOINT CONTRIBUTION IN THE LUMBAR SPINE
A Thesis Presented in Partial Fulfillment of the Requirements for the Degree Master of Science in the Graduate School of The Ohio State University
By Kimberly Anne Vandlen, B.S. Industrial and Systems Engineering *******
The Ohio State University 2009
Master’s Examination Committee Dr. William S. Marras, Advisor Dr. Daniel A. Mendelsohn
ABSTRACT
It is hypothesized that the facet joints may play an important role in the causality behind back pain. Previous biomechanical models lack detailed facet geometry and contact modeling, the inclusion of cartilage, and the modeling of the full lumbar spine. The objective of this study was to more realistically assess facet loading in an existing low back biomechanical model. The second objective of this study was to demonstrate how the model including facets reports load distribution in pushing and pulling tasks. Several new components were added to an existing biomechanical model: realistic geometry (based on CT & MRI), more accurate facet radii of curvature, articular cartilage thickness, and contact algorithms which defined the contact between each lumbar spine facet. Trials were run once with facets turned on, and repeated with facets turned off. Resultant disc loads were lower in the model with facets. The model clearly showed facet to lamina contact for many of the trials studied. Facets at L4/L5 and L5/S1 bore about 40% of the total load through those segments. The nonlinear model performed well. The facets bear a large portion of the load though the lumbar spine. Load transmission percentage results with the facet model are comparable to previous studies. The facets bore a greater amount of load in pushing tasks than in pulling tasks. The direction of the offloading of the intervertebral discs is not as straightforward as previously hypothesized. Including realistic facets in the model does
ii
not necessarily result in decreased anterior-posterior shear loads within the disc under these loading conditions.
iii
ACKNOWLEDGEMENTS
I would like to extend a special thank you to my advisor, William Marras, for his support while I have worked in the lab and during the thesis journey. He pushed me to challenge myself in ways that I hadn’t done before, and I am stronger for it. Thanks also to the second member of my committee, Dan Mendelsohn, who lent his expertise and his time for many question-filled meetings. Thank you to my cohorts in the Biodynamics Lab, especially the modeling team. Greg, Cliff and Peter contributed a tremendous amount of knowledge and time to aid in my understanding of the whole system. Thanks also to Greg for reviewing my thesis. The working environment I was surrounded with could not have been more pleasant. Finally, thank you to my family. My parents have supported me throughout. All of my gratitude goes to my husband Jeff, whose patience and encouragement kept me strong.
iv
VITA November, 6 1983 2006
…………………………….. Born - Hillsdale, MI, U.S.A.
.………………………………………….. B.S. Mechanical Engineering Hope College, Holland, MI
2006-Present
…………………………………… Research Assistant The Biodynamics Laboratory The Ohio State University
FIELDS OF STUDY
Major Field: Industrial and Systems Engineering
v
TABLE OF CONTENTS Page Abstract
………………………………………………………ii
Acknowledgements
………………………………………………………iv
Vita
……………………………………………………….v
List of Tables
……………………………………………………..viii
List of Figures
………………………………………………………ix
Chapters: 1. Introduction
…………………….…………………………1
1.1
Anatomy
1.2
Potential Pain Pathways ………….…………………………4
1.3
Facet Modeling
1.4
Biomechanical Model
2. Methods
…………….…………………………2
…………….…………………………5 …….…………………………9
………………………………………………………11
2.1
Overview
………………………………………11
2.2
Modeling Software Overview
2.3
Material Properties
………………………………13
2.4
Lumbar Spine Geometry
………………………………14
2.5
The Articular Facets ………………………………………17
2.6
Model Building
2.7
Experimental Conditions
………………………13
………………………………………21 ……………………………....23
3. Results
………………………………………25
4. Discussion
………………………………………41
5. Conclusions and Future Work
………………………………………51
5.1
Conclusions
………………………………………51 vi
2.2 Bibliography
Future Work
………………………52
………………………………………………………54
vii
LIST OF TABLES Table
Page
1.1 Percentages of total sample (n=25) population…………………………………..4 1.2 Previous spine FEM and contact models………………………………………...8 2.1 Model material properties………………………………………………………13 2.2 Anthropometric data of test subject…………………………………………….15 2.3 Constants for ADAMS IMPACT function……………………………………..21 3.1 Conditions tested in facet model………………………………………………..25 3.2 Percentage of max contact load relative to max resultant load without facets….40 4.1 Facet static load transmission literature………………………………………....48
viii
LIST OF FIGURES Figure
Page
1.1 Facet joint capsule……………………………...………………………………..3 2.1 Methods flowchart…………………….………………………………………..12 2.2 Lumbar spine model with facet contacts..………………………………………16 2.3 Overlap of contacting bodies……..…………………………………………….18 2.4 Problem description, contact with coated bodies...……………………………..19 2.5 Force-displacement curves for L4/L5…………………………………………..20 2.6 Graphical representation of facet contact……………………………………….22 3.1 Percent difference (pushing, heavy load)………………………………….……28 3.2 Percent difference (pushing, light load)……………………………....………...28 3.3 Percent difference (pulling, heavy load)………………………………….….…29 3.4 Percent difference (pulling, light load)……………………………....………....29 3.5 Average of resultant disc loads, facets on…………………………….………...32 3.6 Average of resultant disc loads, facets off…………………………….………..32 3.7 Left and right resultant contact forces………………………………….……….33 3.8 Pushing, superior disc loads with and without facets…………………..…….....34 3.9 Pulling, superior disc loads with and without facets…………………..………..34 3.10 Pushing, inferior disc loads, with and without facets…………………..……...36 3.11 Pulling, inferior disc loads, with and without facets…………………..………36
ix
3.12 Pulling/50% handle height/light – disc & facet loads L4/L5……………………..38 3.13 Pulling/50% handle height/light – disc & facet loads L5/S1……………………..38 3.14 Pushing/50% handle height/heavy – resultant loading comparison………………39 3.15 Comparison of load born by facets with different stiffness values……………….40 4.1 Graphical example of facet to lamina contact……………………………………...42
x
CHAPTER 1
INTRODUCTION
The study of the causality behind low back pain is an ongoing one in the world of biomechanics because of the number of people who experience back pain. Approximately 80% of Americans will experience some type of back pain during their lifetime[1]. It is estimated that every year in the United States almost 600,000 people take time away from work to treat or recover from musculoskeletal pain or functional loss [2]. The significance of this problem should not be underestimated. A common speculation as to the causality behind low back pain is disc and facet joint degeneration[3]. As the intervertebral discs deteriorate, the zygapophyseal (facet) joints are consequently called upon to bear a greater load. The facet surfaces degenerate via ossification and the deterioration of the surrounding cartilage. The aim of this study is to develop a more realistic representation of the forces occurring in the facet joints, in order to better understand their role in spinal loading possibly leading to low back pain.
1
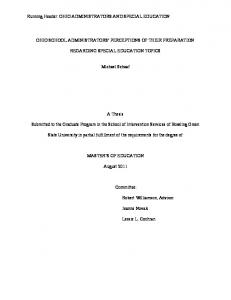
1. 1 Anatomy The facet joints are within the posterior elements of the spine, which are the bony processes that engage when the spine is extended or in torsion. The surfaces that touch between the upper and lower posterior elements are called articular facets, which are a part of the facet joint. These joints are reported to transmit anywhere between 2-59% of the load through the spine[4-7]. The facets are also richly innervated with branches of the spinal nerves[8]. The facet joints are so close to the intervertebral foramina, the area through which the spinal nerves pass from the vertebral canal, that it is easy for the facets to cause irritation if they are pushed beyond their physical limits via extreme torsion or bending. The facet joints are paired synovial joints that join the vertebral arch of one vertebra to the arch of the next vertebra[9]. The facet surface lies between the superior and inferior processes of a vertebra. The facet joint is the only synovial joint in the spine, and it consists of hyaline cartilage that overlies subchondral bone, with a synovial membrane and a joint capsule (Figure 1.1, [10]). The articular cartilage surrounding the bony portion of the facets is covered with a film of synovial fluid which facilitates in the gliding movement between the articular processes and to consequently reduce friction[11]. The joint is encapsulated, and the amount of space in the joint capsule has a synovial fluid capacity of approximately 1-2 mL [12], while larger facets are more likely to carry a wider capsule[13]. Finally, the outer layer of this facet capsule is known as the capsular ligament[14]. The capsular ligaments provide joint stability and act as a form of mechanical support throughout facet contact and separation.
2
Figure 1.1: Facet joint capsule. IAP, inferior articular process; SAP, superior articular process; cart, articular cartilage; men, meniscus[10].
It has been shown that the curvature of the articular facet surfaces varies both by the level of the spine as well as between subjects. Horwitz et al. [15] performed a roentgenographic study of the lumbar spine on a population of 25 human cadaveric spines (Table 1.1). Samples from the population of facets were categorized as curved or flat and are shown as percentage of the total sample population in Table 1.1. This study found that in the lower levels of the lumbar spine, the facets are more likely to have a flat, planar surface. In the higher levels of the spinal column, especially L2/L3 and L3/L4, facets tend to have more of a curved surface. In an anatomical study, Bogduk [11] also concluded that the facets may be planar or curved, but went on to describe the curvature of the facets as either C-shaped or J-shaped. C-shaped facets, then, have a larger surface area which faces posteriorly and can afford greater resistance to motion. J-shaped facets have only a small portion of their articular surfaces facing posteriorly, and therefore offer less resistance than C-shaped facets. The fact that shapes of the facet surfaces can change both between subjects and between levels of the spine becomes very important when modeling the facet contact interaction at all spinal levels. 3
Table 1.1: Percentages of total sample (n=25) population [15]
Level
Flat
Curved
L1/L2
44
56
L2/L3
21
79
L3/L4
19
81
L4/L5
51
49
L5/S1
86
14
1.2 Potential Pain Pathways There are different hypotheses for facet pain, ranging from that which is related to the facet anatomy just described to pain sensing via the Neuroanatomic system. One potential source of pain occurs when a superior facet bottoms out on the lamina of the inferior vertebral body[7] Because the facets are so richly innervated, this type of irritation is thought to be a potential source for back pain. Secondly, when facets are injured or deteriorating, the related spinal nerves are also affected and this is hypothesized to be a significant cause of low back pain [9, 10, 16]. A common method of diagnosing facet joint pain is through controlled diagnostic blocks[11]. One study used these injections to investigate predictors of low back pain due to the facet joints [17]. The investigators found that though facet joint pain is not uncommon, there are no clinical indicators for this type of pain. Some studies have come to similar conclusions [18], while still others have been able to identify origins of facet joint pain [19, 20]. Therefore, the pain-producing mechanisms in the facet joint cannot be described solely on the basis of anatomic compromise[21]. Neuroanatomic studies take a deeper look into the causes of low back pain. The peripheral nerve endings within the facets can become sensitized by chemical mediators 4
which are released when the tissue is damaged and inflamed [16]. These inflammatory mediators produce a continuous background discharge in the sensory nerves of the joints, which causes the nerves to be extremely sensitive to mechanical stress. Therefore, when these chemical mediators are present, fibers in the facets that would otherwise fire only when the mechanical stress was clearly noxious will instead fire at a much lower state of stress. Another inflammatory mediator is substance P, which is a neurotransmitter that resides in sensory nerves. As previously indicated, the facets are richly innervated and contain open nerve endings, which possess substance P [22]. Substance P causes vasodilation, plasma extravasation, and a release of histamine from mast cells [23]. These are an integral part of the inflammatory cascade, which is a source of prolonging pain. The development of a more accurate model with precise geometry and a nonlinear contact definition will allow a greater understanding of the mechanisms causing facet pain. If we can come to an understanding about the types of loads born by the facets, we may be able to indicate where degeneration will start to occur. This would indicate where the spinal nerves will start to be irritated and pain could occur. By creating an anatomically accurate facet model, and by facilitating the output of loads at each individual facet at all levels of the lumbar spine, attempts can be made to better understand facet pain.
1.3 Facet Modeling Biomechanical modeling is one method used in research to better understand facet contact. In the late-1980’s, researchers modeling the spine began integrating a representation of the posterior elements into Finite Element Models (FEM) of the spine
5
[4-6, 24-31]. Shirazi-Adl et al. [32] assumed that the material properties of the facet joint lie somewhere in between those of spinal cortical and cancellous bone, and those homogeneous material properties were used for all of the posterior elements in their model. Each FEM model of the posterior elements since then has made this same assumption. In a recent study modeling the knee joint contact, researchers modeled the bone with a cancellous core, cortical shell and cartilage layer and found that the cancellous core played little mechanical role in cartilage contact stresses[33]. For this reason, the bone will be represented using only cortical bone material properties in the current model. Finally, the geometry for the facets is primarily generated from CT scans, and the preferred element types are isoparametric solid elements. The facet contact force has been chiefly represented by gap (contact) elements, which provide a restoring force when two surfaces approach each other, and removes the contact force when the two surfaces separate. Very few models have accounted for the synovial fluid, possibly because of the complexity involved. Kumaresan et al. [34] compared four different types of FEM contact model approaches in the cervical spine that each included a representation of synovial fluid. The authors suggest that a representation of the synovial fluid medium is a primary step in understanding human cervical spine biomechanics. In the hyperelastic model (HE), synovial fluid was simulated by eight-noded incompressible hyperelastic solid elements and the gap between the cartilages was filled with synovial fluid. In the fluid model, synovial fluid was modeled by hydrostatic incompressible fluid elements. In the contact surface model, the contact interaction was achieved by defining a contact plane between the inferior surface of the superior cartilage and the superior surface of the
6
inferior cartilage. This study found that material properties of the articular pillar, synovial fluid/membrane, articular cartilage and the friction coefficient between the cartilages does not affect the force transmitted through the joint. It is also important to note that these authors chose to represent friction in the contact interaction. A summary of some of the aforementioned studies can be found in Table 1.2. Though these models have accounted for the posterior elements or the facet joints specifically, the anatomical description of the facet joints is not thorough in many of them. There are no models in this list that consider the system behavior of the synovium, the cartilage on the facets, and the spinal ligaments. The majority of models are built via the Finite Element method, which can be computationally intensive and is not a desirable addition to the current model in this study. The FE models primarily use gap elements, which estimate contact stiffness properties based on material properties of surrounding elements and do not take into account facet geometry. Other models are static and they usually do not include muscles. Also, much of the geometry in existing models do not come from the same subject as the motion or loading data that is run through them. It is certain that there are limitations to the previous literature that call for the improvements made in the current study.
7
Table 1.2: Previous spine FEM and contact models
Facet Synovial Fluid YES -------
8
Reference Kumaresan et al, 1999 [35] Teo & Ng, 2001 [36] Kumaresan et al, 1998 [34] Rohlmann et al, 2006 [25] Williams et al, 2007 [37] Calisse et al, 1999 [38] Kuroki et al, 2002
Type FEM FEM FEM FEM FEM FEM FEM
Geometry CT 3D digitization From literature CT scans and literature CT X-Ray and CT CT
Location (Spinal Levels) C4-C6 C4-C6 C1-C7 L3/L4 L4/L5 L1-L5 L4/L5
Goel et al, 1993 [26] Goel et al, 1994 [27] Teo et al, 2003 [4] Natarajan et al, 1999 [29] Guo et al, 2007 [5] Schmidt et al, 2007 [24] Schmidt et al, 2008 [31] Kim et al, 1991 [6] Shirazi-Adl et al, 1986 [32]
FEM and optimization FEM FEM FEM FEM FEM FEM FEM FEM Extension of Hertz theory Mathematical contact model Based on Rigid Body Spring Model
CT CT Multi-axis digitizer CT Flexible digitizer CT CT CT in vitro measurements
L3/L4 L4-S1 L2/L3 L3/L4 L3-L5 L4/L5 L4/L5 L3-L5 L2/L3
----------
YES -YES YES ------
Coated sphere in spherical cavity
--
YES
YES
From literature Articular surfaces determined either mathematically or numerically
Knee joint
--
YES
YES
--
Rigid Body Spring Model and others Elasticity theories
Coated sphere in contact with hemispherical layer Sphere to sphere contact
Elbow joint Simplified articular joint model Patella
Eberhardt et al, 1990 [39] Blankevoort et al, 1991 [40] An et al, 1990 [41]
Li et al, 1997 [42] Eberhardt et al, 1991 [43]
8
---
Facet Facet Cartilage Articulation --Contact elements -Slideline elements YES 0.5 mm gap -Contact elements ---Gap elements --
YES YES
Gap elements Gap elements Contact elements Gap elements Gap elements Contact elements Contact elements Gap elements 1 mm gap Hertz model Mathematical model RBSM RBSM, modified Hertz, elasticity theories Elasticity theories
1.4 Biomechanical Model The foundation for the modified facet model is an established electromyography(EMG)-assisted model developed and validated by Marras et al.[4448]. This biologically assisted model was developed in order to represent spine loading under dynamic, three-dimensional motion conditions [46]. In doing so, the researchers were able to more accurately represent dynamic industrial tasks via the model, rather than simplifying a complex dynamic task into a static representation. This model has evolved over the past 25 years to include inputs that together predict the loading on the spine at each vertebral level of the lumbar spine. The current biomechanical model of the whole lumbar spine does not contain a representation of the contact forces between the facet joints. At first some rough approximations for the contact force stiffness and damping coefficients were developed. The contact stiffness was estimated based on the Hertz theory of elastic contact, which estimates that locally near the contact each contacting body is an elastic half-space loaded over a small region in its surface, and where the contact area between two surfaces is assumed to be elliptical[49]. This theory assumes that the two contacting surfaces contact initially at only one point and takes into account the actual relative curvatures of the two contacting bodies. The material properties of cortical bone were determined from the literature[50], and were assumed to be the same for both the inferior and superior facets. A single resultant contact force for one facet pair was assumed and an average radii of curvature was calculated over the entire facet surface. This way of modeling facet contact forces does not provide realistic contact force values for the following reasons: some facets are planar while other are curved, and the Hertz
9
assumptions do not hold true for all of these facet surface geometries; also, this facet contact description does not account for the cartilage and synovium which surround the posterior elements. Furthermore, this approximation does not allow for multiple discrete contacts that can occur at different points (with different local curvatures) on the facetpair surfaces at the same time. Also, the average curvatures used over an entire facet surfaces make no sense when applied to actual local simultaneous point to point contacts. Hence, the much refined model described in this thesis was developed. The objective of this study is to more realistically assess loading in magnitude and direction in the existing low back injury risk model. With modifications, the model will include a more accurate representation of the forces occurring between facet joints in the spine during engaged facet contact. The model will be tested on data collected from a lab study investigating spinal loads during pushing and pulling[51]. The second objective of this study is to demonstrate whether the model with updated facets will show a difference in facet loads between these two types of industrial tasks.
10
CHAPTER 2
METHODS
2.1 Overview A summary of the modeling process used in this study is found in Figure 2.1. This model is unique because it uses an accurate description of the anatomy of the facet. The model includes: the material properties of the bone and cartilage, the radius of curvature of each individual facet, and it also accounts for articular cartilage while considering the synovial fluid’s properties that make the joint frictionless. Though a physical representation of the capsular ligament is still under development, the support provided by all of the spinal ligaments is embedded in the stiffness parameters chosen for the discs in the model.
11
Figure 2.1: Methods flowchart
12
2.2 Modeling Software Overview The modeling software used for the current model is the MSC ADAMS (Automatic Dynamic Analysis of Mechanical Systems) rigid body modeling software package. ADAMS can simulate the reaction of modeled bodies to motions, forces, and other test data while accounting for momentum and gravitational effects. The updates to the facets were also completed in the ADAMS software environment. To “Setup” the model in ADAMS, each vertebral body was imported into a single database. The cartilage layers were joined to each facet as a solid part.
2.3 Material Properties The next step in updating the facet model was to choose material properties for model elements. The facet joints in the model were assumed to be comprised of the homogenous properties of cortical bone covered with a homogenous cartilage layer. The material properties of the cartilage were taken from Kumaresan et al.[34], and were used for cartilage layers on both facets at each lumbar vertebral level. See Table 2.1 for the material properties for all of the important elements in this model. Table 2.1: Model material properties
Material
Cortical bone Cartilage
Young’s Modulus (MPa) 12,000 10,400
Poisson’s Ratio
Density (kg/mm^3)
Reference
0.3 0.4
1.76E-6 1.1E-6
[27] [52]
The intervertebral discs were represented by multidimensional spring-dampers calculated with translational and torsional stiffness and damping parameters found in literature. Gardner-Morse and Stokes[53] determined stiffness values of the L2/L3 and
13
L4/L5 motion segments via cadaveric testing. Since the values they presented were determined from motion segments with the ligaments and the facets intact, the values used in the current model were reduced slightly to account for the stiffness from all of the spinal ligaments (including capsular ligaments) but to ignore the stiffness due to facet contact.
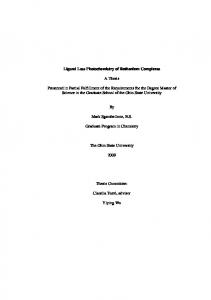
2.4 Lumbar Spine Geometry The geometry for the lumbar spinal segment used in this model was obtained via computed tomography (CT) in vivo with 0.625 mm slices. The subject was a 24-year-old male with no previous history of low back pain. Anthropometric data for this subject can be found in Table 2.2. The CT scans were compiled to create a three-dimensional model of the lumbar spine from T12/L1 to L5/S1. Figure 2.2 is an image of the detailed model created from the CT scans. The detailed geometry of the CT scans allow for extraction of radii of curvature of the individual facets. According to the literature, cartilage thickness ranges from 0.2 mm [4, 54, 55] to 3.02 mm[56]. Since cartilage degenerates with time[57], the cartilage thickness chosen for this study was on the lower end of that range. An estimate of 0.5 mm was made for the thickness of the cartilage surrounding the bony facet joints[29]. This value was chosen as a realistic approximation for the amount of cartilage in an adult, given that there is definite deterioration of cartilage over time. It was also determined upon inspection of this subject’s CT scan that the cartilage had to be less than 1 mm.
14
Table 2.2: Anthropometric data of test subject Age (years) Subject Weight (kg) Stature (cm) Xyphoid Breadth (cm) Xyphoid Depth (cm) Illiac Breadth (cm) Illiac Depth (cm) Spine Length (cm) Torso Circumference (cm) Subscapular Skinfold (mm)
15
24 74.84 178.99 29.39 23.39 27.71 18.21 57.0 86.0 11.0
Figure 2.2: Lumbar spine model with facet contacts
16
2.5 The Articular Facets In order to determine the components of the force equation describing facet contact in ADAMS, the following assumptions were made. 1. The cartilage layer was a continuous thickness of 0.5 mm over the entire facet surface. 2. The material properties of the bone and the cartilage were linear and isotropic. 3. The synovial fluid, which serves the purpose of lubricating the joint, enforces the condition of zero friction during the contact. 4. One facet in each contact location has a much larger radius of curvature which is considered infinite in calculating stiffness constants. The radius of curvature for each contact surface was determined by fitting a surface to the face of each of the facet surfaces. After observing small areas where the contacts occur, patches were selected and a radius of curvature was measured for each patch. The equivalent radius of curvature for that portion of the facet face was determined by averaging the radii of each patch. The contact force uses the ADAMS IMPACT function, where the contact force is described as: F = k*(distance)n
(6)
where k is the material stiffness, n is the force exponent, and the distance is the total distance between the centroid of the intersection volume the closest point on each of the intersecting bodies (Figure 2.3).
17
Figure 2.3: Overlap of contacting bodies
To represent the contact between two articulating facets, several studies using mathematical descriptions of contact force were reviewed. Some of these papers describe contacting bodies but do not include a coating on the bodies[58, 59] which was needed in this model to represent the cartilage. Other contact models focused primarily on contact between a sphere and a spherical cavity[39, 41, 42, 60, 61], which does not apply to the current model because it is conformal contact and does not represent the point contact occurring between facets. After this review, an extension of the Hertzian contact theory model was chosen[61]. The Hertz equations are commonly used in the fields of contact and engineering mechanics to describe circular and elliptical point contact. The purpose of this extension model was to predict contact approach, contact radius, and maximum contact pressure for both circular and elliptical contact problems of coated bodies. This extension applied to the facet model because it describes the contact of coated bodies: in the facet contact problem, the bone of the articulating facets was considered to be the substrate of the coated body and the cartilage was the coating. Figure 2.4 displays the current contact problem description, where both bodies are coated. In Figure 2.4 the first body is a sphere and the second contacting body is a plate. The current model solutions 18
designate Body 1 as a sphere (which represents the curved superior facet surface) and Body 2 as a coated plate (the inferior facet surface).
Figure 2.4: Problem description, contact with coated bodies
Given a substrate of cortical bone and a coating of articular cartilage, several equations were adapted from Liu et al[61]. First, the non-dimensional coating thickness is defined as a ratio of the cartilage thickness (h) to the contact radius (��� �: �
H=�
(1)
��
The following equations were also employed: •
Total equivalent radius, �
�
•
��
��
����
�
(2)
�
�
���
��
+
���
�
(3)
Contact radius, ao= �
•
Total equivalent modulus, �
•
�
�� �
(4)
Contact approach or rigid body motion, �
��
δo = ������
19
(5)
The next steps in model building were to use the given information about the specific facets (material properties, cartilage thickness and radii of curvature) to solve for force constants to be used in the ADAMS contact force definition. First, a range of reasonable loads born by the facets was determined from the literature. The range is anywhere from 2-59% of the total load on the spine[4-7], so a range of W from 2-900 N was used in these solutions. By solving Equation 5 for the contact approach (δo ) over the range of applied loads (W), a force-displacement curve could be determined (Figure 2.5). Figure 2.5 shows two force-displacement curves, one at the L4/L5 right facet and one at the L4/L5 left facet with a cartilage thickness of 0.5 mm.
Figure 2.5: Force-displacement curves for L4/L5
The force-displacement relationship used in ADAMS was then fit to the curve determined from the modified Hertzian solutions. In doing so, an individual stiffness (k) and force exponent (e) value was found for each of the facet contacts in the lumbar spine (Table 2.3). 20
Table 2.3: Constants for ADAMS IMPACT function
LEVEL Radius(m) T12_L1 0.0092 L1_L2 0.0043 L2_L3 0.007 L3_L4 0.0135 L4_L5 0.0108 L5_S1
0.0151
LEFT RIGHT k e Radius(m) k e 1.85E+08 2.253 0.0078 1.47E+08 2.249 6.23E+07 2.225 0.006 1.01E+08 2.24 1.26E+08 2.245 0.0086 1.68E+08 2.251 3.07E+08 2.258 0.0094 1.90E+08 2.253 2.30E+08 2.256 0.0304 8.49E+08 2.257 3.56E+08
2.259
0.0129 2.91E+08
2.258
2.6 Model Building The cartilage is represented in the model by a 0.5 mm shell placed around the outside of the articular portion of the facet surface. Both the inferior and superior facet surfaces of facets in the lumbar vertebrae have this layer. The layer representing the cartilage was created in the Rapidform XOR (Inus Technology) solid modeling program, and then imported and joined to the ADAMS rigid body of the facet at the layer’s center of mass. An ADAMS contact force was created between the layered articulating surfaces. The layer of articular cartilage can be found in Figure 2.6 (see the portion encircled in black), a snapshot of the facet model during a trial simulation. The added depth from the 0.5 mm cartilage layer is shown by the darker portion in this posterior view. Also in this figure are arrows representing the depiction of the discs (yellow), the muscles (red) and the facet contact (blue).
21
\
Figure 2.6: Graphical representation of facet contact
22
2.7 Experimental Conditions In order to show the feasibility of the modified facet model, a demonstration subject was chosen from a study previously performed in the lab assessing the current biomechanical model for pushing and pulling tasks[51]. This was one of three pushing and pulling studies assessing the complex loads occurring on the spine that differentiate themselves from traditional lifting tasks[51, 62, 63]. Results showed that lumbar lordosis was maintained during pushing, whereas the subject tended to flex their spine during pulling[51]. Part of this was due to the fact that the subject was encouraged to keep their upper torso vertical during the tasks. One would consequently expect prolonged contact between facets during pushing tasks and intermittent contact (disengaged facets) during pulling tasks. This study also found significant shear loading at the upper levels of the lumbar spine that are expected to load the facets. Because of the nature of this study, the data were chosen as a test bed for the biomechanical model with updated facet joints. The elements of the push-pull study give good examples of dynamic industrial tasks. Since there were distinct differences in the amount of facet contact between pushing and pulling, this data was an appropriate choice for demonstrating the ability of the modified facet model to decipher between contact force magnitudes in the facet joints. The trials chosen to run in the model were from pushing and pulling tasks where very high and very low loads on the spine were determined[51]. The conditions chosen were at the heaviest load (40% of the subject’s weight, 29.9 kg), the lightest load (20% of the subject’s weight, 15.0 kg), at the highest handle height for pulling (80% of subject’s height, 143.2 cm) and at the lowest handle height for pushing (50% of subject’s height,
23
89.5 cm). There were four repetitions per condition. The specific tests of the model were: a) Comparing facet contact forces between a pushing and a pulling task and b) Comparing spinal loads at each intervertebral level in a the lumbar spine model with modified facets to spinal loads in a model with the facet contact forces turned off. High shear loads are expected at upper levels of the spine at the 80% handle height for pulling and the 50% handle height for pushing.
24
CHAPTER 3
RESULTS The conditions examined from the push-pull data have been laid out in the previous section. The actual conditions used for testing the model were slightly modified and can be found in Table 3.1. Pushing trials with the heaviest load at the 80% handle height were omitted. Upon inspecting that extreme condition, some of the equipment was out of its calibrated range, and therefore it was deemed invalid to examine these trials.
Table 3.1: Conditions tested in facet model
ACTIVITY
HANDLE
LOAD
Push Pull Pull Push Push Pull Pull
50% 80% 50% 80% 50% 80% 50%
Heavy Heavy Heavy Light Light Light Light
Some noise was observed in the results from pulling the heavy load at the 80% handle height, and pushing the heavy load at the 50% handle height. These are the conditions in which the spine reached the most extreme extension and torsion. In excessive extension, the facets at L4/L5 and L5/S1 were in constant contact. The stiffnesses of the contact force at these levels were also higher, given that these facets
25
were more curved and therefore had higher radii of curvature. The stiffer contact caused some shifting of the vertebral bodies between the left and right facets, which can account for the noise in these two conditions. The peak disc and facet loads reported here were not affected by this noise. The current facet model was created in such a way that the updated facets and their corresponding defined contact forces could be turned on or off. Each of the trials from the push-pull data was run through the model twice. First, the facets were turned on and the model was controlled by a torque. The intervertebral angular velocities were recorded and used to drive the motion in the second simulation with the facets turned off. In this way, the motion was exactly the same between the two simulations and all changes could be contributed solely to the addition of the facet contact forces to the model. The purpose of this study was to see how the model system would behave with the addition of the facet joints and their load-sharing behavior in the lumbar spine. Results will be interpreted via face validity since there is no way to really validate this model in vivo. Overall, the model performed as expected. Allowing the facets to bear load took a large portion of the load off of the discs at most of the vertebral levels of the spine. Figures 3.1-3.4 show the percent difference (separated into pushing and pulling by load, and the x-axis represents each trial at this condition) between the resultant disc loads in the model with facets compared to the model without facets. Note that in Figure 3.1, levels T12/L1 to L2/L3 are all close to zero. A negative value indicates that the resultant load in the model with facets was lower than the resultant load in the model without facets, thereby signifying that the facets reduced the loading in the discs. The
26
load at the disc was reduced for all trials from levels L3/L4 to L5/S1, and for about 20% of the trials from T12/L1 to L2/L3. In most of the trials from T12/L1 to L2/L3 where the loading was not reduced by the facets, there was minimal difference between having the facets on or off.
27
10 0 1
2
3
-10
Percent Difference (%)
-20
L5/S1 L4/L5
-30
L3/L4 -40 L2/L3 -50
L1/L2 T12/L1
-60 -70 -80 -90
Figure 3.1: Percent difference between facet and non-facet model prediction (pushing, heavy load)
10 0 1
2
3
4
5
6
7
-10
Percent Difference (%)
-20
L5/S1 L4/L5
-30
L3/L4 -40 L2/L3 -50
L1/L2 T12/L1
-60 -70 -80 -90
Figure 3.2: Percent difference between facet and non-facet model prediction (pushing, light load)
28
10 0 1
2
3
4
5
6
7
-10
Percent Difference (%)
-20
L5/S1 L4/L5
-30
L3/L4 -40 L2/L3 -50
L1/L2 T12/L1
-60 -70 -80 -90
Figure 3.3: Percent difference between facet and non-facet model prediction (pulling, heavy load)
10 0 1
2
3
4
5
6
7
8
-10
Percent Difference (%)
-20
L5/S1 L4/L5
-30
L3/L4 -40 L2/L3 -50
L1/L2 T12/L1
-60 -70 -80 -90
Figure 3.4: Percent difference between facet and non-facet model prediction (pulling, light load)
29
The load-sharing between the discs and the facets was very complex. The facets were engaged most of the time during torsion and lateral bending, but this did not necessarily correspond to a decrease in lateral and AP (anterior-posterior) shear loading of the discs. Therefore, a resultant measure was created for both the disc and facet loads. The resultant load on the disc was created using vector addition which combined the AP shear, lateral shear and compression. The resultant facet load for the left and right facets was calculated in Adams at each level. The peak resultant disc force and the peak contact force were calculated for each trial, and then averaged to obtain an overall value for both pushing and pulling. Figure 3.5 is a comparison between pushing and pulling of the disc loading during the trials with facets. As expected, the overall loading of the disc was lower during pushing where the spine was more lordotic and the facets were engaged, bearing some of the load for the disc. The disc loads were higher (~1600 N pulling and ~1200 N pushing) at the upper levels of the lumbar spine, which makes sense because the facets bore a greater load at the lower levels (~1200 N pulling and ~700 N pushing). It can be seen in Figure 3.6 that without the facets, the loading on the discs stayed fairly consistent at 1600 N pulling and 1200 N pushing through all the levels of the spine. It was expected that the magnitude would not change by level with the facets off; instead, the components of the force change by level because of spinal curvature. Again, the resultant disc load was higher in pulling than in pushing. Most studies report higher compression in pulling than in pushing, and the compression was the driving factor behind these resultant forces. Figure 3.7 shows the left and right resultant loading at the facets. As expected, where the disc loads decreased from T12 to S1, the facet contact loads increased from
30
T12 to S1. At their peak, the right facet contact loads were just under 800 N. The only exception was for pushing at L4/L5, where the contact force was higher at L4/L5 than at L5/S1. The contact load was greater in pushing than in pulling for all levels of the spine.
31
Combined AP,Lat Shear & Compression (N)
1800 1600 1400 1200 1000 Push
800
Pull
600 400 200 0 L5/S1
L4/L5
L3/L4
L2/L3
L1/L2
T12/L1
Lumbar Level
Figure 3.5: Average of resultant disc loads, facets on
1800 1600
Resultant Disc Loads (N)
1400 1200 1000 Push
800
Pull
600 400 200 0 L5/S1
L4/L5
L3/L4
L2/L3
L1/L2
Lumbar Level
Figure 3.6: Average of resultant disc loads, facets off
32
T12/L1
1000.00
800.00
Facet Load (N)
600.00 Push - Left Pull - Left
400.00
Push - Right Pull - Right
200.00
0.00 L5/S1 -200.00
L4/L5
L3/L4
L2/L3
L1/L2
T12/L1
Lumbar Level
Figure 3.7: Left and right resultant contact forces
Figures 3.8-3.11 give the peak disc loads averaged over each condition. Figures 3.8 & 3.9 report the loads measured at the superior endplate of the disc while Figures 3.10 & 3.11 describe loads measured at the inferior disc endplate. The lateral shear indicates the direction of the lateral bending but for data clarity, the lateral shear data are presented here as absolute values. For the most part the loading at the inferior and superior endplates of the disc were nearly identical. The largest discrepancies between values at opposite endplates were seen at L3/L4, where the intervertebral angle is large and the load path changes the most. The differences between superior and inferior disc loads at the remaining levels were 15% or less, and the trends were the same at both endplates of each disc.
33
1700
1200
Lateral Shear - Facets Compression - Facets
Load (N)
700
AP Shear - Facets Lateral Shear - No Facets 200
Compression - No Facets AP Shear - No Facets L5/S1
L4/L5
L3/L4
L2/L3
L1/L2 T12/L1
-300
-800 Figure 3.8: Pushing, superior disc loads with and without facets
1700
1200
Lateral Shear - Facets Compression - Facets
Load (N)
700
AP Shear - Facets Lateral Shear - No Facets 200
Compression - No Facets AP Shear - No Facets L5/S1
L4/L5
L3/L4
L2/L3
L1/L2 T12/L1
-300
-800 Figure 3.9: Pulling, superior disc loads with and without facets
34
It can be noted in Figure 3.10 that in general, disc loads were higher in all directions at the upper levels of the spine and decreased going downward toward L5/S1. From levels L3/L4 to L5/S1, where the highest facet contact was occurring, the compression on the disc was greater when the model had facets turned off. The AP shear, however, was lower when the facets were off at these same levels. This was one indication that the direction of the offloading of the disc may not be clear, and so it was beneficial to present a resultant disc load as in Figures 3.5 & 3.6. The lateral shear did not change much whether the facets were on or off, but the largest difference was found at L5/S1 where the lateral shear was slightly higher with the facets turned on.
35
1700
1200
Lateral Shear - Facets Compression - Facets
Load (N)
700
AP Shear - Facets Lateral Shear - No Facets 200
Compression - No Facets AP Shear - No Facets L5/S1
L4/L5
L3/L4
L2/L3
L1/L2 T12/L1
-300
-800 Figure 3.10: Pushing, inferior disc loads, with and without facets
1700
1200
Lateral Shear - Facets Compression - Facets
Load (N)
700
AP Shear - Facets Lateral Shear - No Facets 200
Compression - No Facets AP Shear - No Facets L5/S1
L4/L5
L3/L4
L2/L3
L1/L2 T12/L1
-300
-800 Figure 3.11: Pulling, inferior disc loads, with and without facets
36
Figures 3.12 & 3.13 give a representation of one of the conditions with the lowest loading of the trials run in the facet model. Plots at L4/L5 and L5/S1 were chosen because these were the levels at which the greatest contact forces were observed. Figure 3.12 displays time-dependent, processed data at L4/L5 (including AP and lateral shears, and compression with and without facets as well as left and right facet resultant contact) from a pulling trial at the lowest handle height and with the lightest load. This figure shows the behavior of the model as the spine moved into a posture where the facets are in contact. As expected, the largest discrepancy between the disc loading in the trial with facets compared to the trial without facets occurred at the point in time where the facet contact load resultant was the highest. At approximately 93 seconds into this trial, the facets reached their highest contact loading and therefore offloaded disc L4/L5 the most. The difference at this point between L4/L5 compression with facets and L4/L5 compression without facets was about 400 N. Figure 3.13 shows the same measures for this condition at L5/S1. At 277 seconds, the compression value with facets was almost identical to that without facets. Correspondingly it can be seen that the facet contact at that point in time was only about 50 N.
37
1.40E+03 L4/L5 Right Facet Contact
1.20E+03
L4/L5 Left Facet Contact
8.00E+02
L4/L5 Superior Lateral Shear
6.00E+02
L4/L5 Superior Compression L4/L5 Superior AP Shear
4.00E+02 2.00E+02
L4/L5 Superior Lateral Shear (No Facets)
0.00E+00
L4/L5 Superior Compression (No Facets)
1 27 53 79 105 131 157 183 209 235 261 287 313 339
Load (N)
1.00E+03
-2.00E+02
L4/L5 Superior AP Shear (No Facets)
Trial Time (s) -4.00E+02 Figure 3.12: Pulling/50% handle height/light - disc & facet loads L4/L5
1.40E+03 1.20E+03
L5/S1 Left Facet Contact
1.00E+03
L5/S1 Right Facet Contact
6.00E+02
L5/S1 Superior Lateral Shear
4.00E+02
L5/S1 Superior Compression
2.00E+02
L5/S1 Superior AP Shear
0.00E+00
L5/S1 Superior Lateral Shear (No Facets)
-2.00E+02
1 27 53 79 105 131 157 183 209 235 261 287 313 339
Load (N)
8.00E+02
-4.00E+02
L5/S1 Superior Compression (No Facets)
-6.00E+02
L5/S1 Superior AP Shear (No Facets)
Trial Time (s) -8.00E+02 Figure 3.13: Pulling/50% handle height/light - disc & facet loads L5/S1
38
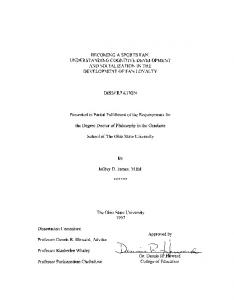
A trial representative of the conditions with the highest spinal loading was chosen for Figure 3.14. The time-dependent loading is again shown for L4/L5 and L5/S1, but now the contact forces are shown relative to the resultant loads at the superior endplate of each disc rather than the directional loads. This comparison yields a percentage of the total load transmitted through the facets. For this representative trial, the percentage was calculated by dividing the maximum facet contact by the maximum resultant load from the simulation where the discs were the only method of load transmission. The resulting percentages are shown by level in Table 3.2. The facets bore the least amount of load at L1/L2, accounting for only 0.54% of the total load through that motion segment. The lower levels, especially L4/L5 and L5/S1, accounted for around 40% of the load. 2500
2000 L5/S1 SUP - Facets L4/L5 SUP - Facets
1500 Load (N)
L4/L5 Right Facet Contact L4/L5 Left Facet Contact L5/S1 Right Facet Contact
1000
L5/S1 Left Facet Contact L5/S1 SUP - No Facets 500
L4/L5 SUP - No Facets
1 30 59 88 117 146 175 204 233 262 291 320 349 378 407 436
0
Trial Time (s)
Figure 3.14: Pushing/50% handle height/heavy – resultant loading comparison
39
Table 3.2: Percentage of max contact load relative to max resultant load without facets
Level T12/L1 L1/L2 L2/L3 L3/L4 L4/L5 L5/S1
Percentage (%) 1.05 0.54 0.70 15.0 39.55 43.14
Finally, an analysis was performed to determine the effects of changing the inputs into the modified Hertz equations. In Figure 3.15, a comparison of load transmission is made on a sample trial of pulling the light load. The percentage of total load born by L5/S1 is 17% whether the cartilage thickness is 0.5 mm or 1 mm. At L4/L5, the facets bear 4.5% more load when the cartilage is thinner. The remaining levels of the spine did not show noteworthy changes based upon modifying cartilage thickness because there was little contact at these levels. 20
Percentage Load Born by Facets (%)
18 16 14 12 10
h=0.5 mm, larger k
8
h=1 mm, smaller k
6 4 2 0 -2
L5/S1
L4/L5
L3/L4
L2/L3
L1/L2 T12/L1
Lumbar Level Figure 3.15: Comparison of load born by facets with different stiffness values
40
CHAPTER 4
DISCUSSION
This facet model represents a very complex system, and it is appropriate to treat it as such. Each element included in the model must work together with the others to embody the complex movements of a human spine in vivo. The primary measures for the testing of the model were facet loads and intervertebral disc loads, but there are many components which can alter or account for these outputs. There was one unexpected nuance observed while running data through the facet model. Measuring facet loads on the left and right sides of the vertebra proved to be very telling about where unbalanced loading occurred. At L4/L5 especially, the majority of the loads transferred through the facets followed the path on the right side of the joint (when looking at the posterior view of the spine). The magnitude of this contact force was also higher than at any other levels. The location of the contact could be pin-pointed through watching animations of the pushing trials where the facet loads were the highest. At the beginning of these trials, the right L4 inferior facet articulating surface was in contact with the right L5 superior facet surface. At the greatest point of extension in the trial the L4 inferior facet slipped outside of the L5 articulating surface to come into contact with the L5 lamina (Figure 4.1). This contact continued throughout most of the remaining
41
length of the trial and was the source of the highest contact loads at this level.
Figure 4.1: Graphical example of facet to lamina contact
The circumstance of a facet bottoming out on the lamina below is not a new discovery[7, 64]. Yang & King[7] cited this as a serious possible site for origination of back pain, given that this area is richly innervated and the contact might be irritating adjacent nerves or wearing away at the capsular ligament. However, the current model was not designed to account for cartilage to bone or bone to bone contact, but solely the cartilage to cartilage contact that occurs between two facet articulating surfaces. The material properties of the contacting bodies are integral in defining the stiffness coefficients of the contact force; therefore, they should be tailored to account for the cartilage to bone contact that is happening during facet to lamina contact. Though changing the stiffness values might affect the magnitude of the force at this location, it is still expected that the model will show similar facet to lamina contact behavior which 42
would therefore serve as an excellent indicator of what may be a very real source for low back pain. One of the factors that seemed to have a great effect on loading patterns was the initial orientation of the vertebrae. Lower concentrations of facet contact force were observed at the upper levels of the spine. During model building, the spine was rotated from the vertebral orientation with which it was built (from CT scans) to vertebral orientations derived from an upright MRI. Scans from the upright MRI gave the benefit of more realistic intervertebral angles since the subject was in a standing rather than a supine posture. The rotation applied to the model to match the MRI angles decreased the lordosis in this subject’s spine because in the supine CT scan a rolled towel had been placed under the subject’s spine causing it to be more lordotic than was realistic in an upright posture. The decrease in the lordotic curve caused the facets at the upper level of the spine, especially T12/L1 and L1/L2, to separate and therefore come into contact less throughout most of the trials than at lower spinal levels. The results from the model give a good indication of the magnitude of the load born by the facets. The highest concentration of contact force was found at L4/L5 and L5/S1. This makes sense because these levels begin in contact and remain in contact throughout a trial. Since a contact force was defined for both the left and right side of each vertebra, this might indicate which portion of the disc is more likely to degenerate first. In the instance of L4/L5, the right facet contact force was always much higher than the left. This could mean that the right portion of the disc is offloading some of its force to the facets, causing tension on the left side of that disc and creating a torque in the disc.
43
In the push-pull study from which the data run in this model was obtained[51], the researchers found values for AP shears at the upper levels of the lumbar spine that approached or exceeded a proposed safe limit of 1000 N[65]. The supposition was that the shears would not be that high if the facets were included in the model and were able to bear some of the load. The results for AP shears at these levels in the current model indicate that the offloading of the discs is more complex than was believed in the previous study. In many of the trials with the highest facet contact loads, the AP shears actually increased. In pushing, the average AP shear at L5/S1 of the peak values from all the trials increased from about 300 to 600 N and in pulling the difference was slightly greater, increasing from about 350 to 750N. It has been shown that the contact loading at L5/S1 was also very high, at about 40% of the total load going through that level. Therefore, it is possible that rather than the facets bearing some of the shear load on the disc, they are actually bearing more of the compressive force on the disc. In turn, the facets at L5/S1 were stiff enough that they actually generated shear forces by pushing the disc anteriorly or posteriorly. It should also be noted that using the current facet model based precisely on subject geometry, the shear loading never reached the same dangerous magnitude as in the previous study (whether the facets were on or off). The average AP shear values approached 800 N but never exceeded 1000 N. Another possible explanation behind the shears at the upper levels being higher than expected with the facet model could be attributed to the spinal ligaments. Because the ligaments are still under development, they were not included in the model except for in slight modifications of the stiffness of the motion segment via the discs. There was very little facet contact at T12/L1 and L1/L2 (generally