Jul 22, 2001 - A distributed application is represented as a complex task comprised of ... A mobile ad hoc network (MANET) is a rapidly deployable, autonomous ..... Now, we calculate the running time of the above algorithm. Step 1 ... algorithm (running time is O(|VG|3) and extraction of shortest path cost is O(1) assuming.
A Novel Approach for Execution of Distributed Tasks on Mobile Ad Hoc Networks∗ P. Basu, W. Ke, and T.D.C. Little Department of Electrical and Computer Engineering, Boston University 8 Saint Mary’s St., Boston, MA 02215 {pbasu,ke,tdcl}@bu.edu July 22, 2001
MCL Technical Report No. 07-22-2001 Abstract–Mobile ad hoc networks (MANETs) have received significant attention in the recent past owing to the proliferation in the numbers of tetherless portable devices, and rapid growth in popularity of wireless networking. Most of the MANET research community has remained focused on developing lower layer mechanisms (such as channel access and routing) for making MANETs operational. However, little focus has been applied on higher layer issues, especially application modeling. In this paper, we present a novel distributed application framework based on task graphs that enables a large class of resource discovery based applications on MANETs. A distributed application is represented as a complex task comprised of smaller sub-tasks that need to be performed on different classes of computing devices with specialized roles. Execution of a particular task on a MANET involves several logical patterns of data flow between classes of such specialized devices. These data flow patterns induce dependencies between the different classes of devices that need to cooperate to execute the application. Such dependencies yield a task graph representation of the application. We focus on the problem of executing distributed tasks on a MANET by means of dynamic selection of specific devices that are needed to complete the tasks. In this paper, ∗
This work was supported by the NSF under grant No. ANI-0073843.
1
we present simple and efficient algorithms for dynamic discovery and selection of suitable devices in a MANET from among a number of them providing the same functionality. This is carried out with respect to the proposed task graph representation of the application, and we call this process Dynamic Task-based Anycasting. Our algorithm periodically monitors the logical associations between the selected devices, and in the event of a disruption in the application owing to failures in any component in the network, it adapts to the situation and dynamically rediscovers the affected parts of the task graph, if possible. Finally, we propose metrics for evaluating the performance of these algorithms and report simulation results for a variety of application scenarios with different degrees of complexity, device mobility, and transmission range.
1
Introduction
With the shrinking size of tetherless computing devices and increasing diversity of their capabilities, the value of pervasive computing is rapidly becoming real. As these devices proliferate in number, exploiting the full potential of a network of such devices while not frustrating the end-user with interminable configuration tasks and wire-plugging exercises proves to be a challenging issue indeed. Established technologies such as IEEE 802.11 [9] and burgeoning technologies such as Bluetooth [5] are poised to bring true tetherless computing applications to the end user in every possible way. A mobile ad hoc network (MANET) is a rapidly deployable, autonomous system of mobile devices which are connected by wireless links to form an arbitrary graph at any instant of time. With increase in popularity of portable devices and wireless connectivity standards, MANETs are likely to gain popularity in the near future, especially in settings where a networking infrastructure is expensive, cumbersome, or impossible to construct. We can conceive scenarios in which the environment surrounding us consists of a large number of specialized as well as multipurpose devices, many of them portable, and linked through wireless connections, albeit with fluctuating link availability. Ideally, such pervasive networks can enable a broad range of distributed applications that need exchange of information between multiple devices. When a large number of computing devices become equipped with wireless connectivity, and they form an ad hoc network, they can offer services to other devices for performing several tasks. In such a situation, since the service providing devices may themselves be mobile, a user cannot rely on one particular device for a certain service since its reachabil2
data flow edge proximity edge
Music Server
Display
mp3 data
Wireless PDA (mobile user)
Decoded audio signal
presentation file Smart Storage/CPU (possibly mobile) Local Screen
auxilliary devices to control presentation (can be moved)
Speaker L
Request
Wireless Keyboard
mp3 decoder device
Wireless Mouse
Speaker R Proximity Sensing
USER
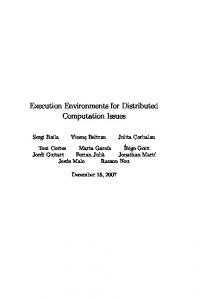
Figure 1: Smart Office and Home Applications: (a) Smart Presentation Task, and (b) Stereo Music Service ity/availability is not guaranteed. Instead, a user must be prepared to access the required service from any of several devices in the MANET providing similar services, if possible. Significant previous research focused on lower layer MANET issues such as channel access [18, 4] and routing [17, 20, 15]. However, higher layer issues related to application design have received little attention in this context. We bridge this gap with a novel scheme for modeling and executing distributed applications on MANETs that rely on services offered by other devices scattered across the network. We introduce the abstraction of a Task-Graph (TG) for representing higher-level tasks (or applications) that a user may want to perform, in terms of smaller sub-tasks. It is a graph composed of nodes and edges, where the nodes represent the classes1 of devices/services needed for processing data related to the task while the edges represent necessary associations between different nodes for performing the task. Fig. 1 shows two examples of task graphs in the pervasive computing domain. Fig. 1(a) shows the TG of a smart presentation application, in which a user, carrying only a PDA with wireless connectivity capacities, automatically finds and instantiates the devices in a room needed to make a full presentation. Fig. 1(b) shows the TG of a music service application, in which the application tracks the physical location of the user and instantiates the appropriate speaker devices that will play the music the user has selected. Both applications are mentioned in further detail in the next section. Thus when a task is to be executed, specific devices are selected (in other words, 1
Printer, Photocopier, Digital Picture Frame etc. are examples of classes
3
instantiated) at runtime, and are made to communicate with one another according to the specifications of the TG. More specifically, for each class of device in TG, one suitable instance needs to be chosen to take part in task execution. We call this process Task-based Anycasting or Embedding. The adjective dynamic is added since the choice of device instances may change with time due to mobility. When a participating device becomes unavailable, a new substitute device with similar capabilities is selected to continue the task. The TG abstraction of a distributed task is advantageous in many ways. It is inherently distributed, as most pervasive applications and services of the future are likely to be, since more and more specialized devices will need to communicate with one another to offer more and more powerful services. It also offers hierarchical composability, as collections of devices can be logically grouped together to constitute a single node in a TG. Although we do not prove it explicitly, we argue that optimal embedding of a general graph onto a general MANET is a hard problem. However, if TG is a tree, we show that it is possible to perform optimal embedding in polynomial time, and present one such algorithm. But since the running time of this algorithm is high and it assumes knowledge of the entire topology, we present a simpler and practical distributed algorithm for dynamic instantiation of TGs on a MANET for executing the application corresponding to the TG. In the event of a disruption in the application owing to failures in any component in the network, our algorithm quickly adapts to the situation and dynamically re-instantiates the affected parts of the TG. We measure the success of our distributed instantiation algorithm by certain metrics such as average time for instantiation, quality of the instantiation (in this paper, the technical term used for this is dilation), frequency of disruption of tasks due to mobility or route failures, and average effective throughput that is achieved after application data transmission begins. The rest of the paper is organized as follows: Section 3 introduces example scenarios that motivate research in our Task-Graph approach. Section 4 introduces the theoretical foundations for the TG concept. Section 2 briefly describes the related work in the literature. Section 5 presents our distributed algorithm for TG instantiation in a network. Section 6 presents simulation results of the algorithm presented. Section 7 concludes the paper.
4
2
Related Work
In recent years, service discovery in networks has been a popular topic of research in the industry as exemplified by SLP [13] and Sun’s Jini [21]. In both these schemes, a service providing computer registers itself with its attributes at a centralized directory server which the clients can lookup on demand. MOCA is a variation of Jini without any centralized registry [3]. It is specifically designed for mobile computing devices – every device has a service registry component which only the applications running on the local and surrounding devices can benefit from. Our approach is different from these as it operates at a logical layer above service discovery and it can co-exist with any of these schemes. Also, it does not depend upon any centralized directory service. Some researchers have proposed to capture user-intent for discovering appropriate devices suitable to them. Portolano project [10] emphasizes the use of data centric networking which is really a low-level implementation technique that can potentially have TG as a higher-level abstraction. In INS [1], the user intent is abstracted into collections of attributevalue pairs that describe what the user wants. The specific devices that will perform the desired service will be selected by special entities called Intentional Name Resolvers. INS has a feature called Intentional Anycast and late binding which are similar to what we call instantiation of TG nodes. However, it does not to attempt to systematically represent the relationships between the components of a distributed task, which is our principal focus. Hodes et al. [16] have investigated means of composing services for heterogeneous mobile clients. Their work primarily focuses on controlling office equipment from mobile devices and design of client-device interfaces. They too have not addressed the issues involved in composing complex services from simple devices with specific interaction patterns between them. IBM’s PIMA has a vision somewhat similar to ours. In their vision paper [2], they argue very briefly for the design of applications in terms of sub-tasks instead of specific devices. However, they have not mentioned any approach for realizing this vision so far. Our task-graph concept on the other hand is a systematic and concrete approach which can help realize this vision. The concept of a task graph was originally used in parallel computing and scheduling literature for representing tasks that can be split temporally into sub-tasks and then allocated to different homogeneous processors connected by a fixed high-performance interconnect for reducing the total completion time [6, 19]. Our notion of a task graph is different from 5
this classical one. We are not necessarily concerned with tasks that are distributable among multiple homogeneous processors for speed-up. Rather, most tasks that we are concerned with in this work involve several specialized heterogeneous devices that communicate with each other, and there is no notion of minimizing the total completion time. However, if we are interested in solving a large scale distributed computing task on a network of homogeneous mobile devices, then our notion of a task graph will be similar to the classical one. Therefore, our task graph formulation is more general than the one used in the parallel computing context. We do not discuss the homogeneous device scenario in this paper. To the best of our knowledge, this is the first attempt towards modeling distributed applications on a MANET using task graphs.
3
Examples of Application Scenarios
In this section we describe a few application scenarios which motivated our research. We give examples from smart offices and homes, disaster relief, and sensor networks.
Smart Pervasive Computing Applications Here we consider an application for future smart offices, conference halls, or ad-hoc meeting rooms. Imagine a large hall with a number of display screens, projectors, wireless keyboards and pointing devices. Also assume that there are a number of smart storage devices which can run popular file-viewing software. These devices can store a presentation file in their local storage and can render them on a display screen using the appropriate software2 . Devices are tetherless and therefore can be moved around in the room freely. The presenter carries only a PDA (with wireless connectivity) that contains the presentation file. The file, or portions of it, are transferred from the PDA to a suitable smart storage device depending on the type of presentation software and other factors to be outlined later. The presenter will need a pointing device, a keyboard, perhaps, and a local screen to control the presentation, but does not care about which devices actually perform the presentation task. Fig. 1(a) depicts the presentation task with a graph where the vertices stand for categories of devices involved in the task and the edges stand for data flow between device categories or other factors like physical proximity. Assuming that there is no infrastructure support in the hall, a multi-hop ad-hoc network is formed by these devices among each other. 2
Laptops of audience members with wireless connectivity can easily take up this role.
6
In this scenario, a self-organizing protocol is required to discover the most suitable display screen, smart storage device, keyboard, mouse and local screen with respect to the presenter’s location and data requirements. The presenter can move around in the hall either naturally or for displaying multiple items at the same time, and a different set of peripherals may need to be discovered for optimal effect. Note that the nearest smart storage device containing the suitable viewer may not be the best one for the nearest keyboard and the nearest display to communicate with. The discovery process must consider the relationships between vertices in the corresponding task graph. Thus the presentation task can be achieved seamlessly without bothering the user with configuring the chosen peripheral devices. Fig. 1(b) illustrates an example of an application for future smart homes. Imagine a user wearing a proximity sensor embedded in his/her shirt roaming around in the house while listening to music. When he/she requests a particular song from a music server (hosted in the house or somewhere in the Internet), the music server streams the mp3 file to a suitable mp3 decoder in the house which may be a hardware player or a software decoder residing on a PC. The proximity sensor in the users shirt senses the nearest set of speakers, and the selected mp3 decoder device starts streaming the audio to the selected set of speakers. If the user moves to another room, the music follows the user automatically since a new set of devices is dynamically selected, triggered by the proximity sensor.
Scalable Coordination in Disaster Relief In disaster relief situations involving earthquakes, fires or floods, there are various teams of workers involved such as law enforcement officers, fire fighters, rubble removers, rescue workers, paramedics, and ambulance personnel, among others. Each of these groups of people have specialized roles in the rescue operations, and they are expected to be in constant touch with each other through their personal handheld devices. However, usually all rescue workers do not need to communicate with all others. For example, the fire fighters receive data from sensors and communicate with paramedics, which in turn need to communicate with the ambulance personnel only. Hence, one can establish certain communication patterns between different types of rescue workers such that only messages that are relevant to them arrive at their PDAs. Therefore, instead of forming one huge multicast tree, one can form a number of smaller multicast groups (each corresponding to a team of workers) connected together by a small anycast tree. The nodes in the anycast tree are similar to the nodes in an embedded task graph, each belonging to a specialized type defined by their roles, e.g. Police, Ambulance etc. An edge in an anycast tree joins one member of a specialized team to a member
7
of another specialized team, if those particular teams need to communicate. e.g., if fire fighters need to communicate with paramedics, one fire fighter’s PDA acts as the gateway of communication, and so does one paramedic’s PDA. Communicating along the anycast tree could result in more scalable management of resources than communicating via pure multicast which could waste a significant amount of bandwidth. Our instantiation algorithms can efficiently establish an anycast tree along which such communication can occur. If the selected anycast nodes are lost due to network partitions, then replacement nodes can be selected dynamically.
Smart Sensor Networks Here the higher-level task is to sense and track a given mobile object using a network of embedded sensors. Suppose that for a desired level of fidelity, data from four sensors is needed at any time instant. The task here translates to discovering four sensors out of the sea of networked sensors that will optimally track a given object. An object triangulation example has been explained in greater detail in reference [11].
4
A Task Graph Based Modeling Framework
The use of graph theoretic approaches is well known in traditional parallel and distributed computing systems [6, 19]. We believe that it can be a promising and elegant tool for modeling distributed applications not only on static distributed platforms but also in mobile distributed computing environments such as MANETs. In this section, we first lay the foundations of a task graph based modeling framework and then introduce the task embedding (or anycasting) problem. We then present an optimal polynomial-time algorithm for embedding a tree Task Graph onto a MANET, and then argue why the arbitrary graph embedding problem is hard. In Sec. 5 we present a more practical distributed algorithm which can function efficiently in dynamic, mobile environments.
4.1
Definitions of Terms
A device in our context is a physical entity that performs at least one particular function such as interaction with its physical surroundings, computation, and communication with other devices. It is usually equipped with an embedded processing element, sensors and actuators for interacting with the physical environment, a wireless communication port, and/or a user interface. If a device primarily performs one specific function, it is called a “specialized 8
device”, otherwise, it is referred to as a “multipurpose device”. Examples of the former type include digital cameras, speakers, printers, keyboards, display devices etc., while examples of the latter include PDAs and laptops. The capabilities of each device can be summarized in their attributes. Attributes can be static (which do not change with time) or dynamic (which change with time). For example, a network digital camera can have a static attribute “resolution” which can take values like 320x240, 640x480 etc. Examples of dynamic attributes include location (absolute or relative, depending on the availability of GPS), power levels, available computational power (or load), and available communication bandwidth. In this paper, we only consider specialized devices with their principal attribute, i.e., their main function. Multi-attribute extensions are possible to our work on the lines of [1]. A service is a functionality provided by a device or a collection of cooperating devices. Although hierarchical service composition3 is possible using our modeling scheme, in this work, we only consider services provided by single devices. Multiple devices can exist in the MANET for providing the same service. A node is an abstract representation of a device or a collection of devices characterized by a minimal set of attributes that can offer a particular service. A node is simple when it represents a single physical device. It is complex when it represents multiple simple nodes. We consider simple nodes only in this paper. We refer to the principal attribute of a node or a device as its class or category or type. Examples of classes include printer, speaker, joystick etc. An edge is a necessary association between two nodes with attributes that must be satisfied for the completion of a task. Examples of edge attributes include causal ordering, weight, required data rate between nodes, allowable bit error rate, and physical proximity.
4.2
Tasks and Task Graphs
A task can be described as work executed by a node with a certain expected outcome. The work done by a component of a complex node is considered a sub-task of the bigger task. An atomic task is an indivisible unit of work which is executed by a simple node. Atomicity is related to the core capability of a device (described through its attributes), and is partially 3
creating more complex services from simpler services that are available in the current networked physical space.
9
Laptop
Print Server PDF Document
(PDF to PS)
page 1 page 5 Printer
Printer Nodes
Figure 2: A Smart Printing Service constrained by subjective design choices. A task graph is a graph T G = (VT , ET ) where VT is the set of nodes that need to participate in the task, and ET is the set of edges denoting data flow between participating nodes. An example may bring further clarity to the abstractions developed so far. Consider a scenario in which there is a postscript (PS) printer connected to a small computer (print server) running filtering software that can convert PDF files to printable PS format. The printer and the computer are each devices that offer a particular service. The printer is considered a specialized device offering the service of converting PS files into printed pages, while the computer is a multipurpose device which has among its many offered services the one service of converting PDF files into PS format. The example has been illustrated in Fig. 2. The printer is a physical device representation of a simple node with certain attributes (such as print resolution, ink color) that offer the service of converting PS files into printed pages. Analogously, the print server computer plus its filtering software can be viewed as a representation of a PDF → PS converter node. By taking these two nodes together we can form a complex node that offers a “PDF printing service”. A task we have in mind is the printing of one PDF document. In this specific case, based on subjective criteria, we define an atomic task to be the printing of one page of the document4 . The entire document can be then printed on a set of available printers as shown in Fig. 2. Note that in this scenario we formed a new service (PDF printing) by combining two existing ones. Granted that this 4
We did not come up with any objectively quantifiable argument as to why the atomic task should not be the printing of a dot in the paper. Subjectively, we believe atomic operations at that level are too cumbersome to manage at such high-level abstraction.
10
(i) U : [−; SS] [SS; −] (ii) SS : [U; LS, D] [U; U] [K; LS, D] [M; LS, D] (iii) K : [−; SS]
(iv) M : [−; SS] (v) LS : [SS; −] (vi) D : [SS; −]
Table 1: Tuples for the Presentation Task example is simple (even trivial), we believe that research that enables such capability in today’s MANETs for arbitrary device types and quantities is essential for tapping into the networked environment’s full potential.
4.3
A Data-flow Tuple Architecture
Every class of device participating in a task possesses a set of tuples representing the task requirements in terms of the data flow from other classes of devices into the current class, and from the current class to other classes. Each tuple corresponds to a logical unit of data processing that is needed between the distributed components of an application. Consider the smart presentation application described in Sec. 3. The following data flows can characterize a sample presentation: (i) Presenter’s PDA (U) sends data to Smart Storage (SS) with appropriate presentation software. SS then displays the data on the Display (D), Local Screen (LS), and some corresponding notes on the PDA screen (U)(ii) Keyboard (K) data (from the presenter typing on the keyboard) and Mouse (M) clicks are sent to SS which interprets them and relays them to D and LS. To represent such application data flow between nodes we employ a generalized tuple architecture. If a node of class X receives data from nodes of classes A, B and C, and sends the processed data to nodes of classes D and E for a certain application flow (e.g. mouse commands or keystrokes), we can represent this flow using the following tuple: X : [A, B, C; D, E]. Such an application data flow can be specified in a file using a standardized language and a Task Graph (TG) can be generated from it easily. The aforementioned application data flows can be written as tuples as shown in Table 1 and they translate to the task graph shown in Fig. 1(a). Having a tuple architecture for a task serves two purposes: (1) It is a structured specification of the data flows in a task from which a task graph can be derived, and (2) after the embedding of the task graph on the MANET, it governs the flow of actual application data at each participating device. The example of a data-flow tuple presented above contains only the essential infor11
C1
C1
A D
B2
R1 B1 B
B1 A1
C
B2
R1 A1 A2
D1
R2
A2
D1
R2
User D2
D2 C2
(a) Task Graph
User
(b) Embedding #1
C2
User
(c) Embedding #2
Figure 3: Example of Task Graph Embedding mation for data exchange, namely the data source and the data destination. In general, the edges in a TG can have attributes such as channel error rates, bandwidth, etc. which reflect the QoS needs of the distributed application. These, and requirements such as proximity (since devices like keyboard, mouse etc. should be located as near the user as possible) can also be integrated in the TG via the tuple architecture. One direct way of implementing it is to introduce a proximity attribute of the edge and specify it in the tuple. Implementation details of the proximity attribute are beyond the scope of this paper, and we reserve it for future study.
4.4
Embedding Task Graphs onto Networks
The first step in executing a distributed application on a set of specialized devices is to discover appropriate devices in the network and to select from those, some suitable devices that are needed to execute the more complex application. Mathematically speaking, embedding a task graph T G = (VT , ET ) onto a MANET G = (VG , EG ) involves finding a pair of mappings (ϕ, ψ) such that ϕ : VT → VG and ψ : ET → PG , where the class of v ∈ VT is the same as that of ϕ(v) and PG is the set of all source-destination paths in G. Fig. 3(a) depicts a hypothetical task graph. Figures 3(b-c) show a sample network topology with two possible embeddings of TG on it. The entire process of device discovery, selection of a device from multiple instances of devices in the same category, and the assignment of a physical device to a logical node in the task graph is referred to as instantiation. The collective process is called embedding or task-based anycasting.
12
4.5
Metrics for Performance Evaluation
In general, the embedding process maps edges in T G to paths in G. Average Dilation of an embedding is the average length of such paths taken over all edges in T G. Mathematically, if ka, bkG denotes the length of a shortest path between nodes a and b in G, dilation is given by: Davg =
1 |ET |
P
kϕ(x), ϕ(y)kG . Dilation is an important metric since it impacts the
(x,y)∈ET
throughput between instantiated devices. An embedding with large dilation signifies long paths between directly communicating devices, which is undesirable in MANETs since TCP throughput drops significantly with increase in hop distance [14]. In contrast, an embedding with low dilation results in better task throughput. We consider the weighted version of the metric in Sec. 4.6 where we formally describe the optimal embedding problem. Instantiation time is another useful metric which measures the time taken to instantiate a node in T G on G. When an embedding is disrupted owing to network failures, it also measures the time taken to find a replacement device. A useful metric for measuring the resilience of the protocols to failures is Average Effective Throughput, (AvgEf f T ), which is the average number of application data units (ADUs) actually received at instantiated data sinks divided by the number of ADUs that were supposed to be received at the intended targets in an ideal situation5 . Therefore, 0 ≤ AvgEf f T ≤ 1.
4.6
Optimization Problem Formulation
We formulated the minimum embedding problem as the following optimization problem: Let C be a set of principal attributes (or classes) of specialized devices. Let G = (VG , EG ) be a graph corresponding to a MANET of specialized devices, with the class of each device in VG belonging to C. Let T G = (VT , ET ) be a task graph such that the class of each node in VT belongs to some S ⊆ C. Also, a function w : ET → send upstream to parent
RE−INST_TG pkt arrives from local CN Instantiate the TG node Inform main CN
SEARCH_Q_REINST
Send INST_TG
if (!old) reachable[src] = 1
Send CN_Q_REINST to local CN
CN_Q_REINST pkt
HELLO_ACK arrived
ACK timer expires
Send HELLO_ACK
SEARCH_QUERY pkt arrived (different device type)
Sent to App layer
INST_TG pkt
SEARCH_QUERY pkt arrived (request−type == my device type) Send CN_QUERY to CN
WAIT−FOR−CN_ACK
CN_ACK arrives from main/local CN 1. Instantiate the TG node 2. Send CN_CONFIRM to CN 3. Extract TG from previous pkt 4. Find uninstantiated neighbors in TG 5. Initiate search for remaining types
SEARCH_QUERY pkt arrived Rebroadcast pkt
Figure 8: Non-Coordinator Device Protocol FSM
21
H Time−out Period
BFS−parent of A, B
Non−BFS parent of B
BFS−parent of C
TIME
Node B
Node A
HA
H
(user node)
H
HA
HA H detected loss of BFS−child C(k)
X
broadcast for type C
I’m suit
Node C
H
X
able
HELLO packet HELLO−ACK packet X Packet did not reach before timer expired
C(k) does not reply (it is still not free)
_TG
EINST
Send R
TASK GRAPH
detected loss of BFS−parent B(j) PLES end TU rt HELLO) (C(k) uninstantiates itself) ta Inform S (S Root C N Inform L o gical N (over 2 eighbo lo (Start H gical TG hops rs ) ELLO)
Confirm
ation
BFS−tree edges Non−BFS−tree edges
Node C (instance i)
Root Node (user node)
Node B (instance j)
Node C (instance k)
Figure 9: Re-instantiation of Devices mobility, it is no longer sufficient to permanently select specific devices and appoint them to execute the application – continual monitoring must be performed for detecting disruptions, and replacement devices must be selected for resuming the application. 5.2.1
Detection of Disconnections
When mobility causes network partitions or disconnections, the instantiated devices may no longer be able to communicate if the partition breaks all paths between them. In such situations, new instances need to be selected. The necessary first step in this direction is the detection of disconnections. Mobility of devices may cause network partitions or disconnections, and two instantiated devices may no longer be able to communicate if all paths between them are broken. We propose a lightweight, soft-state exchange protocol for detecting disconnections in an instantiated TG. The protocol requires each instantiated device to send periodic HELLO messages (with period T ) to its logical neighbor instances in TG, which reply with a HELLO-ACK. This has been demonstrated in Fig. 9. Each instantiated device specially keeps track of its BFS parent and BFS children. For example, in Fig. 5(c), the instance of type C keeps track of the instance of type A (its BFS parent) as well as of the instances of types F and G (BFS children). If a BFS
22
parent device stops hearing from one of its BFS children10 , it uninstantiates its child and starts searching for a replacement of the same type. The child meanwhile would stop hearing HELLO-ACKs from the parent (assuming bidirectional links), and will uninstantiate itself. This has been illustrated in Fig. 9. On average, if the HELLO timer is set to T seconds at every instantiated device, disconnections will be detected after
T 2
seconds. State transitions
that result from this process have been shown in the FSM diagrams in Figs. 7 and 8. Mobility of devices may also result in lengthening or shortening of routes between device instances, and ideally, if there is no disconnection/partition, the application should proceed without disruption. But such ideal conditions may not hold in reality where route failures can trigger route discovery which along with TCP re-transmissions after timeouts may sometimes take several seconds to complete. Hence, this can result in HELLO-ACKs not coming back in T seconds which results in the conclusion that a disconnection has happened, even when the nodes are reachable from one another. Recently, researchers have proposed solutions to the above problem based on explicit notification of route errors to TCP [8]. In this study, we do not attempt to alter TCP or DSR (including their default timer settings), and simply build our protocol on top of these protocols. Hence, if a device does not receive a HELLO-ACK from its neighbor in T seconds, we deem the neighbor to be disconnected. A reasonable value of T is one which is not low enough to cause significant control overhead11 , and not high enough such that disconnections are not detected fast enough. For our simulations, we chose T = 7 seconds (> 6s, the default TCP re-transmission timer). 5.2.2
Process of Re-instantiation and Bookkeeping
If a BFS parent device detects a disconnection with its child at the expiry of its HELLO timer, it issues a broadcast search query for the same type of the child. The re-instantiation process then proceeds like the earlier instantiation process with a small simplification that the CN CONFIRM step is omitted, since the BFS parent here handles one disconnection at a time. Also, the coordinator device is not involved in this process, and the BFS parent device acts like a local coordinator. After finding a new device, the BFS parent instantiates it in its own copy of TG, and sends a portion of the re-instantiated TG to the new child device. 10
The parent concludes this if it does not get a HELLO-ACK from that child before the expiry of its HELLO timer 11 Although exchanging HELLO messages with higher frequency could result in the DSR caches having fresher routes
23
Root
Root
Root
a
b
a
c
a
b c
c X X
d
e
f
d
d
e
g
g’
g’ h
h
g gets disconnected from c c detects disconnection c searches for new g d does not do anything
e
f
f
h
b
c finds g’ (g’ doesn’t know about d) c sends portion of TG to g’ g’ knows about d now d does not know about g’ yet g’ 1−logical−hop broadcasts its neighbor table
d knows about g’ now c knows that g’ knows about d c,d 1−logical−hop broadcast their neighbor tables a,b,e come to know about g’ (this is useful if c or d are disconnected)
Figure 10: Bookkeeping after Re-instantiation Fig. 10 helps appreciate the reason behind doing this. a, b, . . . , h, g 0 are device instances. Our protocol addresses the problem of state maintenance after disconnections, and attempts to solve it locally, i.e. without involving the coordinator node. Each instantiated device knows the addresses of its parents (both BFS and non-BFS), its children, its children’s parents, and its children’s children12 . With a little thought, one can see that information about this portion of TG is enough to handle single node disruptions in the instantiated task graph. However, there is one situation which cannot be adequately handled by this technique: a network partition such that 2 nodes connected by a non-BFS edge get disconnected from their parents. e.g., d and g get disconnected from c and a respectively, in the same HELLO period. a finds d0 , and c finds g 0 but a tells d0 about g and c tells g 0 about d (from their 2-logical-hop neighbor tables), and a deadlock situation occurs where d0 tried to contact g and d0 tries to contact d. To solve this, we adopt an approach where a non-BFS parent asks for the coordinator’s help if it loses its non-BFS child. Since the coordinator is kept informed by newly instantiated nodes, such a situation can be avoided by taking its help. Note that if the coordinator is unreachable from this node instance, it is because of a network partition alone (since we do not have any timers for such messages), and in that case, a chunk of the instantiated network has been disconnected from the rest (containing the coordinator). In such situations, repair occurs soon at the BFS-parent node instances whose HELLO timers expire. 12
Essentially, this is 2-logical-hop information except for parent’s parents information which is unnecessary.
24
5.2.3
Impact of Disruptions on the Application Layer
The application layer of every participating device keeps up-to-date (in-out) tuple information for parent and children devices. If the running task gets disrupted by disconnection of some participating devices, then it is the responsibility of the BFS-parent device to transfer the application state to the newly instantiated replacement device, and then resume the application data-flow. Meanwhile in data packets reaching old device instances are dropped by those devices which would be in the NOT INSTANTIATED state after being disconnected. Our average effective throughput metric tries to capture the effectiveness of our disruption handling algorithm by measuring the fraction of the data that actually made it to the data sinks from the source. A higher layer buffer management scheme at the BFS-parent device instance can increase the reliability of task completion. Simulation Parameter Number of Devices Simulation Area Transmission Radius Mobility Model MANET Routing #Classes of Devices Size of TG: (|VT |, |ET |) Simulation Time MaxSpeed Pause Time Data Rate at Source U (B = Burst size (bytes), P = Time period (sec))
Value 50, 100 1000m × 1000m 250m Random Waypoint ([7]) DSR 12§ (6, 5), (6, 7), (9, 11) 600s 1 − 20m/s 0 − 600s (12500, 5): medium (1000, 10): low (2500, 1): freq. medium
Table 2: Simulation Parameters, Tx = 250m
6
Simulation Results
We simulated the algorithms (and protocols) described in Sec. 5 using the popular network simulator ns-2[22] for two different scenarios. The simulation parameters for the scenario depicting a large open area with nominal radio transmission range of 250m have been listed in Table 2. We show simulation results for task-graphs in Fig. 5 – we refer to them as Tree TG, Non-Tree TG-1 and Non-Tree TG-2 respectively. The instantiation process began at §
With uniform probability distribution
25
15 4
14
50 devices − Tree Task Graph 50 devices − Non−Tree TG 1 (6,7) 50 devices − Non−Tree TG 2 (9,11) 100 devices − Tree Task Graph 100 devices − Non−Tree TG 1 (6,7) 100 devices − Non−Tree TG 2 (9,11)
3
13
Average Dilation
2.5
2
1.5 Area = 1000x1000 m2 Tx range = 250 meters Types of Specialized Devices = 12 Pause Time = 0 sec
1
Tx range = 250 meters Pause Time = 0 sec
Average Time for Initial Embedding [seconds]
3.5
50 Devices 100 Devices
Area = 1000x1000 m2
12
Types of Specialized Devices = 12
11 10 9 8 7 6 5 4 3 2
0.5
1 0
0 0
2
4
6
8 10 12 14 Degree of Mobility [MaxSpeed in m/s]
16
18
20
1
5
10 15 Degree of Mobility [MaxSpeed in m/s]
20
Figure 12: Average Time for Embedding of TG-2
Figure 11: Average Dilation vs. Speed
50s, and at 60s, a CBR source at the user/root node started sending data to the data sinks at the three different load granularities specified in Table 2. The results have been averaged over three different random specialized device patterns on two different sets of mobility scenario files. Devices which are not part of the current instantiated TG do not relay data packets, and such packets are not buffered13 . We begin with results for the medium load scenario: (B, P ) = (12500, 5). We consider the constant mobility scenario (P auseT ime = 0) for a range of maximum speeds. We observe from Fig. 11 that the average dilation for the MANET with 100 devices does not vary greatly with speed. This means that the average number of physical hops between two instantiated nodes in TG is low and remains approximately constant under mobility. Actually, even if a HELLO message does not reach a device within expiration time, owing to the uniform distribution of device categories in space, the re-instantiation process will find another device with similar attributes within a range that keeps the dilation value constant. A similar pattern is observed for the network with 50 devices, although Davg is higher in that case owing to a 50% lower device density. Fig. 12 compares the average time taken for embedding TG-2 on both MANETs. We observe that in general, more time is taken for embedding/anycasting the same TG on the denser MANET although devices are likely to be found closer on average in that MANET (as is observed from the dilation curves). This can be explained by the fact that 13
In other words, if a device which was part of a TG becomes disconnected while there is a packet in transit, the packet is lost.
26
SEARCH QUERY broadcast traffic occupies significant bandwidth in the initial phase of the embedding process (even after controlling it by mechanisms mentioned in Sec. 5.1), thus delaying the flow of control packets such as CN ACK and CN CONFIRM. Also, there are more instances of each category which receive SEARCH QUERY broadcasts in the denser MANET and a co-ordinator device takes more time to process their responses while proceeding with the instantiation process. Hence the aggregate embedding time increases. We plot AvgEf f T for different TGs for both 50 and 100 device MANETs in Fig. 13 (top two figures). We can see clearly that in general, effective throughput drops with increase in mobility speed. In the figures at the bottom of Fig. 13, we plot the average number of re-instantiations underwent during the entire simulation time. The rate of change in network topology increases with speed causing more network partitions (mainly in the 50 device MANET) or route errors (in both MANETs). These in turn prevent HELLO packets from arriving in time, and this triggers more re-instantiations. Since packets caught in transit during the re-instantiation process are dropped (as mentioned earlier, we do not consider application layer buffering in this work), AvgEf f T is directly affected by re-instantiations. In spite of Tree TG having more re-instantiations than TG-1 (we will explain the reason for this phenomenon in the next paragraph), it yields better AvgEf f T . This is because the data tuples of TG-1 (as well as TG-2) involve flows along non-BFS edges in the graph. Also, here we are only plotting the re-instantiations, and not all disruptions. When a non-BFS parent loses a child instance momentarily due to HELLO timeouts, a reinstantiation will not be triggered since that is the responsibility of the BFS parent of the child instance; Hence, the throughput is affected until a new instance is found by a BFS parent and the non-BFS parent is informed of this event by a 1-logical-hop broadcast (as shown in Fig. 10), or a route to the old instance is restored. Also, Tree TG has sinks at all depths unlike TG-1 – the latter’s effective throughput suffers more from a re-instantiation of an intermediate relay node. Although Tree TG is a sub-graph of TG-1, it suffers more re-instantiations because data flow along the non-BFS edges og TG-1 results in the presence of more valid alternate routes (or parts of them). Hence, when a route error happens along a BFS edge (the primary cause of re-instantiations) of TG-1, often these alternate routes come to the rescue before the HELLO timer expires, thus reducing the rate of re-instantiations. TG-2 generally suffers more re-instantiations since it is a larger graph with more depth. We can observe that TG-1 and TG-2 generally have much lower throughput than TreeTG for the dense MANET case, especially at moderate to high speeds. Most of this drop in 27
Area = 1000x1000 m2 Tx range = 250 meters Number of Specialized Devices = 50 Types of Specialized Devices = 12
Tree Task Graph Non−Tree TG 1 (6,7) Non−Tree TG 2 (9,11)
Area = 1000x1000 m2 Tx range = 250 meters Number of Specialized Devices = 100 Types of Specialized Devices = 12 Pause Time = 0 sec
Pause Time = 0 sec 1 Average Effective Throughput
Average Effective Throughput
1 0.9 0.8 0.7 0.6 0.5
0.8 0.7 0.6 0.5 0.4
0.3
0.3
0.2
0.2
0.1
0.1 1
5
10 Degree of Mobility [MaxSpeed in m/s]
15
0
20
100
90
Tree Task Graph Non−Tree TG 1 (6,7) Non−Tree TG 2 (9,11)
Area = 1000x1000 m2
90
80 Number of Re−instantiations (in 600 sec)
Pause Time = 0 sec
60
50
40
30
10 Degree of Mobility [MaxSpeed in m/s]
15
20
40
30
10
10 Degree of Mobility [MaxSpeed in m/s]
15
20
Pause Time = 0 sec
50
10
5
Number of Specialized Devices = 100
60
20
1
Tree Task Graph Non−Tree TG 1 (6,7) Non−Tree TG 2 (9,11)
2
Area = 1000x1000 m
Types of Specialized Devices = 12 70
20
0
5
Tx range = 250 meters
Number of Specialized Devices = 50 Types of Specialized Devices = 12
70
1
100
Tx range = 250 meters 80 Number of Re−instantiations (in 600 sec)
0.9
0.4
0
Tree Task Graph Non−Tree TG 1 (6,7) Non−Tree TG 2 (9,11)
0
1
5
10 Degree of Mobility [MaxSpeed in m/s]
15
Figure 13: Medium Load scenario: Variation of Speed throughput can be attributed to the disconnections between non-BFS parent and children which happen more often at such speeds, since the paths are likely to be longer for non-BFS edges, on average. We believe that these disconnection effects are more pronounced in dense MANETs because of the following interesting phenomenon: in a dense network, moderatehigh speeds cause frequent route errors without disconnecting the network. Since DSR uses caching, source routing and ring-zero search14 , the routes contained in each device’s cache become stale at high speeds. Stale routes trigger route errors which in turn trigger a route recovery mechanism at the source. For high density MANETs, more extensive route caching is likely at intermediate nodes with presence of more alternate routes. This may result in multiple unsuccessful attempts before a route discovery is successful for these longer paths which non-BFS edges have been mapped to. When this route caching/recovery mechanism 14
A device requesting routes initially queries its 1-hop neighbors, and these neighbors can answer with routes in their caches.
28
20
4
0.4
3.5
2.5
2
1.5
Davg
[Average Dilation in hops]
3
Area = 1000x1000 m2 Tx range = 250 meters Types of Specialized Devices = 12 Pause Time = 0 sec
1
0.35 Average Time to Re−instantiate a Node [seconds]
50 Devices − low load 100 Devices − low load 50 Devices − freq. load 100 Devices − freq. load
Tx range = 250 meters Pause Time = 0 sec
0.3
Types of Specialized Devices = 12
0.25
0.2
0.15
0.1
0.05
0.5
0
50 Devices − low load 100 Devices − low load 50 Devices − freq. load 100 Devices − freq. load
Area = 1000x1000 m2
0
1
5
10 15 Degree of Mobility [MaxSpeed in m/s]
20
1
5
10 15 Degree of Mobility [MaxSpeed in m/s]
20
100
1
50 Devices − low load 100 Devices − low load 50 Devices − med load 100 Devices − med load 50 Devices − freq. load 100 Devices − freq. load
0.9 0.8 0.7 0.6 0.5 0.4 0.3
90
Area = 1000x1000 m2 Tx range = 250 meters
80 Average Number of Re−instantiations
Average Effective Throughput, AvgEffT
Area = 1000x1000 m2 Tx range = 250 meters Pause Time = 0 sec Types of Specialized Devices = 12
Pause Time = 0 sec Types of Specialized Devices = 12
50 Devices − low load 100 Devices − low load 50 Devices − med load 100 Devices − med load 50 Devices − freq. load 100 Devices − freq. load
70
60
50
40
30
20
0.2 10
0.1 0
1
5
10 15 Degree of Mobility [MaxSpeed in m/s]
20
0
1
5
10 15 Degree of Mobility [MaxSpeed in m/s]
Figure 14: Effect of Variation in Rate and Granularity of Traffic for TG-2 is coupled with the TCP back-off mechanism, which assumes congestion rather than route updates, it results in longer delays in packet delivery. Since our protocol requires periodic exchange of HELLO messages over TCP, a lost HELLO packet triggers re-instantiation.
Effect of Variation in Rate and Granularity of Traffic We now examine the effect of variation in rate and granularity of traffic on the metrics for task graph TG-2 in Fig. 14. We plot both 50 and 100 device cases for different load patterns on the same scale. The parameters for the low load and frequent medium load patterns are given in Table 2. A maximum aggregate throughput of 300kbps can be reached in the frequent-medium scenario assuming simultaneous transmission at all instantiated devices in accordance with the underlying tuple architecture.
29
20
5
50 devices 100 devices
4.5
[TG−2 with 9 nodes, 11 edges] 1 Average Effective Throughput
3.5
Types of Specialized Devices = 12
3
2.5
2
Davg
[Average Dilation in hops]
Max Speed = 20 m/s
Area = 1000x1000 m2 Tx range = 250 meters Max Speed = 20 m/s Types of Specialized Devices = 12 [TG−2 with 9 nodes, 11 edges]
4
50 Devices 100 Devices
Area = 1000x1000 m2 Tx range = 250 meters
1.5
0.9 0.8 0.7 0.6 0.5 0.4 0.3
1
0.2 0.5
0
0.1 0 0
100
200 300 400 Degree of Mobility [Pause Time in sec]
500
600
0
100
200 300 400 Degree of Mobility [Pause Time in seconds]
500
Figure 15: Effect of Varying Pause Time ((B, P ) = (2500, 1)) The average dilation results (Fig. 14(a)) are similar to the medium load case, as expected – we can observe that Davg is impacted mainly by device density and not by the traffic rate. Next, we consider the amount of time taken to discover and re-instantiate a single node under disruption. From Fig. 14(b) we can observe that the higher density scenario has better performance for a given load type. A larger number of candidate devices in the environment increases the likelihood of finding another suitable device once the existing one is disconnected. However, we observe that the average re-instantiation times are higher for frequent-medium than those in the low load scenario. The 50 device MANET suffers more because of the compounded effect of sparse density (which means more hops) and more frequent transmission of data packets in the neighborhood resulting in more contention and hence delays. Fig. 14(c) plots the AvgEf f T curves for all three sets of load patterns. We can see that for the 50 device MANET, AvgEf f T is consistently lower for medium and frequentmedium traffic loads than for low loads. On the other hand, for 100 device MANETs, throughput improves as traffic load becomes frequent for higher speeds. This can be attributed to the following reason: for dense MANETs, the route caches in the neighborhood are much fresher for frequent-medium and medium loads than for low loads. When speeds are high, route errors and repeated cache misses become dominant factors in determining effective throughput – frequent loads prevent the route caches from getting stale and thus help in quicker recovery from route errors, and hence AvgEf f T improves. This can also be observed from Fig. 14(d) which demonstrates a significantly less number of re-instantiations for frequent-medium and medium loads than low loads for the 100 device MANET.
30
600
5
4
1
3.5
Average Effective Throughput
Average Dilation (in number of hops)
25 devices: Tree Task Graph 25 devices: Non−Tree TG 1 (6,7) 50 devices: Tree Task Graph 50 devices: Non−Tree TG 1 (6,7) 100 devices: Tree Task Graph 100 devices: Non−Tree TG 1 (6,7)
50 devices: Tree Task Graph 50 devices: Non−Tree TG 1 (6,7) 100 devices: Tree Task Graph 100 devices: Non−Tree TG 1 (6,7)
4.5
3
2.5 Area = 50x50 m2
2
Tx range = 10 meters 1.5
0.9 Area = 50x50 m2 Tx range = 10 meters
0.8
Types of Specialized Devices = 12 Pause Time = 30 sec
0.7 0.6 0.5 0.4
Types of Specialized Devices = 12 0.3
Pause Time = 30 sec
1
0.2 0.5
0
0.1 0 0.1
0.5
1
2 Degree of Mobility [MaxSpeed in m/s]
5
0.1
0.5
1
2 Degree of Mobility [MaxSpeed in m/s]
Figure 16: Short Tx range scenario: (a) Dilation, (b) AvgEf f T Effect of Variation in Pause Times Now we investigate the effect of variation of pause times (PT), which is the amount of time a device remains static after completing a random movement. The maximum speed is kept constant at 20m/s and data flow parameters are: (B, P ) = (2500, 1). The results have been shown in Fig. 15. We observe that the dilation increases very gradually when mobility of the MANET reduces, and then after a certain PT, it gradually falls when the MANET becomes increasingly static. For the static case (P T = 600s), the devices in the MANET are uniformly distributed and Davg does not change much due to re-instantiations. For the constant mobility case (P T = 0s), re-instantiations happen frequently but because of the uniform density of devices in the neighborhood, a configuration with low Davg is discovered most of the time. However, for intermediate levels of mobility, re-instantiations do not happen that often and infrequent, non-simultaneous mobility of devices often stretches the routes which increases Davg slightly. We also observe an expected phenomenon of AvgEf f T increasing (almost steadily) from 0.5 to almost 1.0 when PT increases from 0s to 600s. The denser MANET is observed to yield slightly better performance for this scenario as opposed to the lower speed/constant mobility scenarios that we have examined earlier. We attribute the reason for this to the fact that in denser, static MANETs, shorter paths are needed to communicate between two devices (as reflected by a lower value of Davg too), and there is a lower frequency of route errors which results in lesser packet loss. ¶
With uniform probability distribution
31
5
Simulation Parameter Number of Devices Simulation Area Transmission Radius Mobility Model MANET Routing #Classes of Devices Size of TG: (|VT |, |ET |) Simulation Time MaxSpeed Pause Time Data Rate at Source U
Value 25, 50, 100 50m × 50m 10m Random Waypoint DSR 12¶ (6, 5), (6, 7) 600s 0.1 − 5m/s 30s (12500, 5): medium
Table 3: Simulation Parameters for Short Transmission Range Scenario
6.1
A Short Range Communication Scenario
Next, we evaluate the performance of our embedding protocol in a scenario with a lower radio transmission range. Essentially we are trying to model a reasonably sized hall full of occupants carrying specialized devices that are equipped with short range radios. The simulation parameters have been listed in Table 3. The five different speeds correspond to very slow walking, walking with a normal speed, brisk walking, running, and fast running, respectively. Fig. 16(a) shows the variation in dilation with speed of motion. We can see that the dilation is lower for the 100 device MANET than the 50 device MANET for both task graphs. This is because the network is more dense in the former case and the likelihood of finding a suitable device nearby is high. Another point to be noted is that the dilation of the TG-1 case is higher than the tree case. This is to be expected since TG-1 has extra (non-BFS) edges which are not necessarily mapped onto short paths on the physical network. One interesting observation here is that the dilation values drop when the speed is increased moderately. This happens because at moderately high speeds, the devices come closer to each other more often and that reduces the dilation. However, if the speed increases further, the associations between nearby devices are not formed due to very high relative mobility between them, and hence the dilation increases. Fig. 16(b) shows the effect of mobility on AvgEf f T . The performance for the 25 device MANET is dismal owing to the sparseness of the scenario. For very low speeds, performance in both the 50 device and 100 device MANETs is close to ideal. However, with
32
gradual increase in speed, AvgEf f T drops much more drastically than in the 1000m×1000m scenario that was considered earlier in this section. This is because the MANETs considered here are more sparse than their respective counterparts in the 1000m × 1000m scenario, and hence the impact of increased mobility is harsher.
7
Conclusions
In this paper we presented a task-based framework for executing a distributed application on a network of specialized, mobile devices. We developed a task graph abstraction for applications by taking into account the dependencies induced by the data flows existing between the components of an application. We described the task-based anycasting/embedding problem and presented an optimal poly-time algorithm with respect to an average hop-count measure called dilation, for the special case where the task graph is a tree. We also described how it can be heuristically extended for general graphs. Owing to the unreasonable requirements and time complexity of the aforementioned algorithm, we presented a more practical distributed heuristic algorithm (and protocol) for anycasting a given task graph onto a MANET. We also presented a scalable, local detection and repair mechanism for recovering from task disruptions caused by mobility of devices. We showed a plethora of simulation results for evaluating the salient properties of the proposed distributed protocol. From our simulation studies, we observed that our protocol was able to instantiate and re-instantiate TG nodes quickly with low dilation, and yielded a high effective throughput for scenarios with low mobility and reasonably high effective throughput for more mobile situations. We also noted that in some high mobility scenarios, the performance of our protocols suffered due to the non-aggressive retransmission timeout mechanism of TCP and aggressive route caching done by the underlying routing protocol, DSR. Increasing the rate and frequency of the traffic load actually helped improve the effective throughput in such situations. In this work, we did not simulate heavy loads since standard TCP acts as a major bottleneck over multiple hops under heavy loads [14]. Our focus in this work was to demonstrate the viability of the proposed dynamic task-based anycasting approach in MANETs using existing routing and transport protocols. We believe that much superior task execution throughput can be achieved if standard TCP is replaced by feedback based schemes such as the one proposed in [8] – our future efforts will be directed towards such endeavors. Although we do not focus on reliable task execution in this paper, we note that it can be 33
achieved with buffering and re-transmissions in the application.
References [1] W. Adjie-Winoto, E. Schwartz, H. Balakrishnan, and J. Lilley, “The design and implementation of an intentional naming system,” Proc. 17th ACM SOSP, Kiawah Island, SC, December 1999. [2] G. Banavar, J. Beck, E. Gluzberg, J. Munson, J. Sussman, and D. Zukowski, “Challenges: An Application Model for Pervasive Computing,” Proc. 6th ACM MobiCom, Boston, MA, August 2000. [3] J. Beck, A. Gefflaut, and N. Islam, “MOCA: A Service Framework for Mobile Computing Devices,” Proc. ACM MobiDE, Seattle, WA, August 1999. [4] V. Bharghavan, A. Demers, S. Shenker, and L. Zhang, “MACAW: a media access protocol for wireless LAN’s,” Proc. SIGCOMM ’94: Conference on Communications Architectures, Protocols and Applications, London, England, September 1994, pp. 212-225. [5] Bluetooth SIG, http://www.bluetooth.com [6] S. H. Bokhari, “On the Mapping Problem,” IEEE Trans. on Computers, Vol. 30, No. 3, 1981, pp. 207-214. [7] J. Broch, D. A. Maltz, D. B. Johnson, Y. C. Hu and J. Jetcheva, “A Performance Comparison of Multi-Hop Ad Hoc Network Routing Protocols”, Proc. 4th ACM MobiCom, Dallas, TX, 1998. [8] K. Chandran, S. Raghunathan, S. Venkatesan, and R. Prakash, “A Feedback-Based Scheme for Improving TCP Performance in Ad Hoc Wireless Networks,” IEEE Personal Communications Magazine, February 2001. [9] B. P. Crow, I. Widjaja, J. G. Kim, P. T. Sakai, “IEEE 802.11 wireless local area networks,” IEEE Communications Magazine, Vol. 35, No. 9, September 1997, pp. 116126. [10] M. Esler, J. Hightower, T. Anderson, and G. Borriello, “Next Century Challenges: DataCentric Networking for Invisible Computing The Portolano Project at the University of Washington,” Proc. 5th ACM MobiCom, Seattle, WA, August 1999. 34
[11] D. Estrin, R. Govindan, J. Heidemann, and S. Kumar, “Next Century Challenges: Scalable Coordination in Sensor Networks,” Proc. 5th ACM MobiCom, Seattle, WA, August 1999. [12] M. Gerla and J. T.-C. Tsai, “Multicluster, mobile multimedia radio network,” Wireless Networks 1, 1995, pp. 255-265. [13] E. Guttman, “Service Location Protocol: Automatic Discovery of IP Network Services”, IEEE Internet Computing, July 1999. [14] G. Holland and N. Vaidya, “Analysis of TCP Performance over Mobile Ad Hoc Networks,” Proc. 5th ACM MobiCom, pp. 219-230, Seattle WA, August 1999. [15] P. Jacquet, P. Muhlethaler, A. Qayyum, A. Laouiti, L. Viennot, and T. Clausen, “Optimized Link State Routing Protocol,” Internet-Draft, draft-ietf-manet-olsr-04.txt, September 2001. Work in Progress. [16] T. Hodes, R. Katz, E. Servan-Screiber, and L. Rowe, “Composable Ad-Hoc Mobile Services for Universal Interaction,” Proc. 3rd ACM MobiCom, 1997. [17] D. B. Johnson and D. A. Maltz, “Dynamic Source Routing in Ad Hoc Wireless Networks”, in Mobile Computing, edited by Tomasz Imielinski and Hank Korth, chapter 5, pages 153-181, Kluwer Academic Publishers, 1996. [18] P. Karn, “MACA – A new channel access method for packet radio,” Proc. 9th ARRL/CRRL Amateur Radio Computer Networking Conference, September 1990, pp. 134-140. [19] R. Monien and H. Sudborough, “Embedding one Interconnection Network in Another,” Computing Suppl. 7, 1990, pp. 257-282. [20] C. E. Perkins, E. M. Royer, and S. R. Das, “Ad Hoc On-Demand Distance Vector (AODV) Routing,” Internet-Draft, draft-ietf-manet-aodv-08.txt, March 2001. Work in Progress. [21] Sun
Microsystems,
“Jini
Technology
Core
Platform
Specification,”
http://www.sun.com/jini/specs [22] VINT Network Simulator - ns (version 2). http://www.isi.edu/nsnam/ns/
35