A Novel Approach to Big Data Veracity using Crowdsourcing Techniques and Bayesian Predictors Bhoomika Agarwal
Abhiram Ravikumar
Snehanshu Saha
PES Institute of TechnologyBangalore South Campus
PES Institute of TechnologyBangalore South Campus
PES Institute of TechnologyBangalore South Campus
[email protected]
[email protected]
[email protected]
ABSTRACT
1.
In today’s world data is being generated at a tremendous pace and there have to be enough measures in place to verify the nature of big data. Analysis performed on ’dirty’ data may lead to erroneous insights and thereby shaping decisions poorly. The aspect of big data that deals with its correctness is known as big data veracity. Trusting the data acquired goes a long way in implementing decisions from an automated decision-making system and veracity helps to validate the data acquired. In this paper, we present our solution to the big data veracity problem using crowdsourcing techniques. Our solution involves the use of sentiment analysis, which deals with identifying the sentiment expressed in a piece of text. As a proof of concept, we have developed an app that requires users to tag tweets as per the sentiment it evokes in them. Each tweet would therefore get ratified by hundreds of our participants and the sentiment associated to the tweet gets tagged. The tagged emotion was then evaluated against the verified emotion as compared to a verified data set. This analysis was then plotted on a ROC curve and also evaluated against verified data using a Bayesian predictor trained with a trinomial function. As can be seen, an accuracy of 81% was obtained as displayed by the ROC curve and 89% through the Bayesian predictor. Also, a MAP analysis of the Bayesian predictor yields neutral sentiment as the most probable hypothesis. By doing this, we have proven that crowdsourcing of sentiment analysis is a viable solution to the problem of big data veracity and therefore an aid in making better decisions.
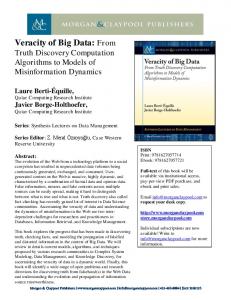
Big data analytics has immense scope in today’s world. It promises to enable better decisions based on huge amounts of data interpreted over time. The idea seems appealing, yet there is a caveat: is the data reliable enough to base decisions on it? The question at hand is- ”To what extent can we trust data?”. Research has shown that 80% of the big data is uncertain data [11]. In Fig. 1, the red curve shows the ratio of uncertain data to the total volume of data getting generated. By the end of 2015, 80% of our total data has been uncertain [11]. This uncertainty in data arises from various sources- measurement errors in sensors, lack of credibility in data from social media, etc. Having huge volumes of data flowing at high speeds is quite worthless if the data is incorrect. This incorrect data can cause a variety of major problems for organizations as well as consumers. Analytics performed on ’dirty’ data can provide unreliable results. Today, veracity in data analysis is the biggest challenge when compared to other aspects such as volume and velocity. Trusting the data acquired goes a long way in implementing decisions from an automated decision making system and veracity helps to validate the data acquired. Thus, there is an immediate need to ensure the veracity of big data. In this project, we look at solving the issue of big data veracity using the technique of crowdsourcing. The accuracy of crowdsourcing is examined to show that it is a reliable solution.
CCS Concepts
2.
•Computing methodologies → Uncertainty quantification;
2.1
Keywords Sentiment Analysis, Big Data, Crowdsourcing, Bayesian Predictor, Machine Learning, Tweet Mining Permission to make digital or hard copies of all or part of this work for personal or classroom use is granted without fee provided that copies are not made or distributed for profit or commercial advantage and that copies bear this notice and the full citation on the first page. Copyrights for components of this work owned by others than ACM must be honored. Abstracting with credit is permitted. To copy otherwise, or republish, to post on servers or to redistribute to lists, requires prior specific permission and/or a fee. Request permissions from
[email protected].
ACM COMPUTE ’16, October 21-23, 2016, Gandhinagar, India c 2016 ACM. ISBN 978-1-4503-4808-9/16/10. . . $15.00
DOI: http://dx.doi.org/10.1145/2998476.2998498
MOTIVATION AND BACKGROUND
INTRODUCTION AND OVERVIEW Big Data
Big data is a term used to describe the voluminous amount of unstructured and semi-structured data any organization creates - data that would, in practice take a lot of time and cost too much money to load into a conventional database structure for analysis. It is often used when speaking about petabytes and exabytes of data. If we consider Facebook as an example, research estimates that it produces 500 Terabytes of data per day [13]. Processing such huge amounts of data with conventional methods and databases would take an impossibly long time, necessitating the shift to different technologies such as big data. Big data is defined by the characteristics of volume, variety, velocity and veracity. Fig. 2 explains the 4 characteristics of big data. These also happen to be the major challenges faced while dealing with big data. The exponential
Figure 1: Uncertainty in big data (Image credits: Jean Francois Puget, France, IBM Research)
Figure 2: The 4V definition of big data (Image credits: infoDiagram.com 2014)
rise in data volumes is putting an increasing strain on the conventional data storage infrastructures in place in major companies and organizations. The next defining characteristic of big data is the variety of sources and content involved. This data comes in different formats- some of it structured like conventional database entries, some of it semi-structured like images with metadata, and the rest completely unstructured like text, graphics, raw imagery (e.g. satellite imagery), audio files or streaming video. To get the most out of big data, all this content must be processed dynamically to generate immediate results. In other words, velocity is of the essence. With modern advances in analytical algorithms (Big analytics) and data transmission infrastructures, it is now becoming possible to feed data into business processes on the fly. Data veracity looks into the abnormality, noise and biases in data. This data has to be cleaned and verified before it can be put to any use. Accumulation of ’dirty data’ must be avoided at all costs as it serves no purpose and hinders business intelligence. While there are existing tools to cleanse and prepare this big data, they are still in their infancy. There is an immediate need for a robust and effective approach to solve the data veracity issue today.
shortcomings of the other.
2.2
Crowdsourcing
The etymology of the word ”crowdsourcing” comes from a combination of ’crowd’ and ’outsourcing’. In layman’s terms, crowdsourcing is the process of making content openly available to the public for use and verification. Crowdsourcing is the practice of engaging a ’crowd’ or group for a common goal - often innovation, problem solving, or efficiency. Thanks to our growing connectivity, it is now easier than ever for individuals to collectively contribute - whether with ideas, time, expertise, or funds - to a project or cause. The underlying idea is to divide a project or task into smaller pieces and assign it to the masses. The major advantage is that one has the resources of tens of thousands of people at one’s disposal to accomplish the task. Owing to the large number of participants, the quality of resulting content is far more superior, especially in terms of ideas and diversity. Through the model proposed in this paper, we hope to combine the two approaches of Big Data Analytics and Crowdsourcing and see how one can be used to substantiate the
3.
RELATED WORK
As early as 2002 Bo Pang et al[8] after extensive research in the field of sentiment analysis of textual data, concluded that the machine learning methods they employed (NaiveBayes (NB), maximum entropy classification, and support vector machines (SVM)) do not perform as well on sentiment classification as traditional topic-based categorization. In the context of movie reviews, due to outliers like ”thwarted expectations” and ”sarcasm”, it is not easy for the machine to classify the sentiment. In 2010, A. Celikyilmaz et al came up with a probabilistic model for the sentiment analysis of tweets using a 2 point classifier which was able to classify tweets into polar or nonpolar[1]. During the next year, V. M. K. Peddinti et al refined the classification model by adapting data from different domains - which focused on a three point classifier - mainly positive, negative and neutral sentiments[9]. This method provided better accuracy levels as noise was filtered by the use of (ExpectationMaximization) EM and Rocchio SVM. Hence, only valid tweets were analysed. They used the NB classifier to calculate the effectiveness of their feature reduction technique and multiple data sources like IMDB (International Movie Database) and Blippr were used to get a wholesome opinion. Later in 2013, Neethu MS et al[7] introduced machine learning techniques to solve the problem of sentiment analysis in tweets - in specific the NB, SVM, Maximum Entropy and Ensemble classifiers. On comparison of their accuracy levels, it was found that all these classifiers have a similar accuracy level for their new feature vector. Thereafter, there has been sufficient research to affirm that sentiment analysis of tweets is of great commercial value and there has been some challenges in finding the best way to do it. In 2013, Tom Narock and Pascal Hitzler proposed a model to crowd source semantics for big data in the context of geoscience[6]. With the growing density of data, this approach argues that augmenting semantic algorithms with crowdsourcing is a viable solution. It also stresses the fact that people, unlike computer systems, need incentives and we’ve made sure to incorporate this facet in our prototype. This model also stresses the importance of automated metrics for assessing the value of the crowd. Crowdsourcing has also been used for tasks such as image analysis, pro-
a month and since each data set contains 1000 tweets, we had 36,000 tweets tagged by our participants. The volume of tweets being analyzed manifests the big data aspect of the app. In our paper, we use the crowdsourced results received from the application as input into the machine based classifier, thereby making the classifier emotionally intelligent. Apart from the tagging aspect, we have introduced a gamification aspect to the app. Tag Me! calculates points each time the user tags a tweet and uses this to create a leaderboard for all the users, thereby bringing a competitive and fun spirit into the crowdsourcing part of the system. The leaderboard is dynamically updated based on user interactions with the app. Appendix A contains screenshots of the app. The app is currently available for online access1 . Figure 3: Sequence diagram for interactions between user and app
tein structure determination and genome annotation that require human input, establishing the significance of human input in the field of bioinformatics[2]. They have designed systems for solving large-volume ’microtasks’ and systems for solving high-difficulty ’megatasks’. It infers that crowdsourcing is indeed beneficial in such a use-case. As another example, human input through crowdsourcing can also be used to identify suspects and designate suspicious behavior in everyday activity by crowdsourcing CCTV surveillance on the internet[14]. Thus, crowdsourcing is a tried and tested method for verification of data in a variety of fields. As recently as last year, M. Hosseini et al provided a few guidelines as to what are the different problem types in which crowdsourcing can be employed as a viable strategy[4]. They have also categorized crowdsourcing tasks into various types and listed critical features in each area which can help building a better model. Our own research falls into Opinion-Based Problems and a few features listed have been incorporated in our prototype.
4.
OUR APPROACH
In our approach to big data veracity, we propose the use of crowdsourcing techniques to verify big data. We use sentiment analysis as a proof of concept. To verify the method, we developed Tag Me! - an app that extracts tweets from Twitter and displays them to the user for sentiment classification. This is then validated against verified sentiment classified tweets.
4.1.1
1. Positive 2. Negative 3. Neutral The above data is collected and stored alongside the statuses. The number of users classifying the status into each of the above classes is considered. The maximum of the three counts for each status is taken as the output. The output of the crowdsourced tagging is then used to train a Bayesian predictor using a trinomial model. At the same time, the verified data set is also used to train the Bayesian predictor. The predictions made in both cases are compared to achieve an accuracy estimate of the crowdsourcing model to handle big data veracity. An ROC analysis and MAP analysis are also done to prove the efficiency of the results.
4.1.2
4.1
Overview of Tag Me!
Tag Me! is a web-based application that helps users easily tag tweets from their smartphones or computers. Fig. 3 shows the workflow of the web app through a sequence diagram. The web app acts like a testing bed where the crowd helps us tag the emotion associated with each tweet. After every 20 minutes, the data set used for tagging is automatically refreshed to ensure that all tweets in the provided data set are evenly tagged by our participants. This velocity of refreshing the tweets increases with the size of the crowd. Since the data keeps getting refreshed, the participants are presented with new tweets each time they log in to the app. As a pilot run, we performed the analysis over
Methodology
In this model, we aim to use the characteristics of both big data and crowdsourcing and combine them into a single model, demonstrating how one can support the shortcomings of the other. To bring out the big data aspect of the model, we use Twitter statuses or Tweets. The model has been implemented as a web app that retrieves the statuses of users and analyses them. Hence, the characteristics of big data are incorporated. To bring out the crowdsourcing aspect, the users are asked to validate the statuses and classify them into one of the three following categories:
Data Acquisition
The first stage of any acquisition process is extraction, which is followed by transformation and later complemented by loading extracted data into the data pool. In this model, data has been extracted from Twitter using Twitter’s OAuth API. Extracted data includes a wide range of tweets and their meta information. Next step is transformation, wherein the unnecessary parameters (for example, the device used to Tweet) are removed. The output of the transformation process is an array of tweets in JSON format, with each array containing the Tweet id allocated by Twitter as well is the associated Tweet’s text. The Tweet text is later used by the Tag Me! app for applying the crowdsourcing procedure and 1
http:abhiramrk.com/tests/codex
Tweet ID is used by the backend team for mapping every single tweet to its author and provides an identity. Algorithm 1 given below explains the entire process involved during the data acquisition process. Based on Twitter’s situational trends, a few keywords are selected beforehand to make the app relevant to users. The algorithm then takes these keywords and streams tweets in real time which serves as input for the app. Once a relevant tweet is identified, it is captured in the raw json format from which the tweet text and tweet id is carefully separated. The separated data items are stored in a new file - which is later provided as input to the crowdsourcing module. Since Twitter offers tweets in the form of structured data, parsing through the data becomes easier. For the purpose of this paper, we have considered tweets only in the English language. Algorithm 1 Dataset filtering and pruning algorithm Initialize: -list of basic terms to track; -Twitter API OAuth application id and secret token; -Output file descriptor of txt type Input: -streaming tweet content; -terms to track (based on situational trends) Output: -tweet id and tweet text which forms the test data set;
that is the verified emotion tag from the machine classified output versus the emotion tag retrieved from our crowdsourced participant. For each tweet under analysis, if the machine provided tag matches with the tag retrieved from the crowdsourced results, we increment the number of matches. The match ratio acts as an efficiency checker, which is the number of matches encountered divided by the total number of tweets. Algorithm 2 Comparator and match coefficient calculation algorithm Initialize: - tweet list(test data set containing tweet id and tweet text) -database username, host, name and password -API endpoint for naive bayes machine classifier - match count = 0 (measures the number of matches encountered) - total count = 0 (keeps track of total number of tweets getting tagged) - match ratio = 0.0 (Match ratio between crowdsourced trial and machine trial) Input: - User’s Google credentials to generate oAuth token for authentication and login Output: - match ratio
for each streaming tweet do relevance = filter(tweet, list basic terms to track); identif y tweet language(tweet); if relevant and english then tweet parse json(tweet); tweet clean text(tweet); split tweet text into id and text(tweet); output tweet id and tweet text to output txt file end if end for
4.2
Verified Data
The datasets for this project were downloaded from the SemEval- 2015 Task 10: Sentiment Analysis in Twitter [12]. SemEval is an annual competition or an on-going series of evaluations of computational semantic analysis systems. The evaluations focus on sentiment evaluation in language. While these sentiments are quite straightforward and obvious to humans, they are computationally a puzzle that continues to elude mankind. The evaluations provide a series of tasks that are openly available to the public. Our focus is on Task 10- which pertains to sentiment analysis in Twitter. Each task is further divided into a set of problem statements or subtasks. We deal with data from Subtask B- Message polarity classification. The training and test data provide us with a set of tweets classified into three sentiments- positive, negative and neutral. The data comprises a total of 7226 classified tweets. Algorithm 2 given below explains the comparator module of the analysis. In this approach, we compare two datasets,
for each tweet IN tweet list do user tagged emotion get emotion user(tweet id, tweet text); machine tagged emotion get emotion machine(tweet id, tweet text); if user tagged emotion machine tagged emotion then match count+ = 1; total count+ = 1; else total count+ = 1; end if end for match ratio = match count/total count; return match ratio
4.3
= = EQUALS
Trinomial Function
The trinomial distribution is used to model the behavior of a function that has three possible outcomes. It describes the behavior of a discrete random variable X, where X is the number of successes in n trials, with each trial resulting in one of the three possible outcomes. Suppose we repeat an experiment n independent times, with each experiment ending in one of three mutually exclusive and exhaustive ways (success, first kind of failure, second kind of failure). If we let X denote the number of times the experiment results in a success, let Y denote the number of times the experiment results in a failure of the first kind, and let Z denote the number of times the experiment results in a failure of the second kind, then the joint probability mass function of X and Y is:
P (X = x, Y = y, Z = z) =
n! x y z p1 p2 p3 x!y!z!
(1)
where p1 is the probability of success, p2 is the probability of the first kind of failure and p3 is the probability of the second kind of failure, with: • x = 0, 1, · · · , n • y = 0, 1, · · · , n • x + y