Consequently, haptic research and development has been focused to .... The software application is able to record two types of 3D world ..... These biometric profiles are formed, as we discuss next, by processing the rich force and torque data.
A Novel Biometric System for Identification and Verification of Haptic Users Abdulmotaleb El Saddik, Mauricio Orozco, Yednek Asfaw, Shervin Shirmohammadi and Andy Adler Multimedia Communications Research Laboratory (MCRLab) School of Information Technology and Engineering University of Ottawa, Ottawa, Canada
{abed, morozco,shervin}@mcrlab.uottawa.ca, {adler,yasfaw}@site.uottawa.ca
Abstract Currently, almost all systems involve an identity authentication process before a user can access requested services; such as, online transactions, entrance to a secured vault, logging into a computer system, accessing laptops, secure access to buildings, etc. Therefore, authentication has become the core of any secure system; wherein, most of the cases rely on identity recognition approaches. Biometric systems provide the solution to ensure that the rendered services are accessed only by a legitimate user and no one else. Biometric Systems identify users based on behavioural or physiological characteristics. The advantages of such systems over traditional authentication methods, such as passwords and ids, are well known; hence, biometric systems are gradually gaining ground in terms of usage. We investigate the issues related to the usage of Haptics as a mechanism to extract behavioural features that define a biometric identifier system. In order to test this possibility, we design a Haptic system in which position, velocity, force, and torque data from the instrument is continuously measured and stored as users perform a specific task. We analyze the information content of the haptic data generated directly from the instrument’s interface. We then measure the physical attributes, such as force and torque that provide the richest information content pertaining to a user’s identity. Through of series of experimental work, we discover that haptic interfaces are more suited to verification mode rather than identification mode. Finally, we implement a biometric system based on Haptics.
1. INTRODUCTION In general, biometric recognition systems use physiological and behavioural identifiers for recognizing individuals [1]. Such given identifiers need to meet requirements like Universality, Distinctiveness, Permanence and Collectability. In practical terms, additional issues should be considered: Performance, Acceptability and Circumvention [2]. These systems are based on pattern recognition methodology, which follows the acquisition of the biometric data by building a biometric feature set, and comparing versus a pre-stored template pattern. Depending on the application context, the biometric system could operate in two modes: identification or verification [2]. In identification mode, an attempt is made to establish the identity of an unknown individual; whereas, in verification mode, an attempt is made to verify the claimed identity of an individual. Put otherwise, identification systems respond to the query “who is this user?”, while verification systems respond to the query “is this user who s/he claims to be?”. Identification can only be established through biometrics, while traditional methods such as keys, smartcards, Tokens and personal Identification Numbers (PINs) have been used as methods of personal recognition for verification systems. The precision of such systems is reliant on the choice of biometric identifiers and also on the operational mode of the application. For accurate identity recognition, identifiers must be chosen so that they are unique for each individual. Conventional choices of biometric identifiers in use include writing style, hand geometry, iris, facial, DNA, ears, voice and fingerprint features among others. Recently, it has been shown that identity recognition based on human-haptic interactions is feasible [3] [4]. In this paper, we are interested in identity recognition based on human manipulations of the haptic interface PHANTOM Desktop™ Stylus [5] integrated in the Reachin system [6]. We use position, velocity, force, and torque data
as biometric identifiers. This data was collected from the stylus as users solved a haptic-based maze application [3] and signed a virtual cheque based application [4]. The purpose of our analysis is to evaluate the information content of this data. Hence, we assess the uniqueness of each biometric identifier. To measure the uniqueness of identifiers, we calculate the relative entropy of different users’ biometric feature distributions with respect to the population distribution. Such a measurement reveals the information content of each feature. Our analysis shows that the information content of identifiers is variant among the users. Therefore, we propose the construction of entropic signatures to characterize both the way in which an individual is unique, and the magnitude of that uniqueness. We also evaluate the performance of haptic-biometric systems employing force and toque data to form and match biometric feature profiles, in order to distinguish the interaction mode that best suits haptic biometric systems. In addition we propose a complete biometric system based on our findings of the biometric data content and the suitability of the haptic interfaces as biometric mechanism. The remainder of this paper is organized as follows: in section 2 we provide a brief introduction to the world of haptics, while in section 3 we address the state of the art and technology related to our proposed research. In section 4 we develop an experimental framework for our study, and in section 5 we introduce the construction of a biometric system based on haptics using the physical parameters with the most userclassificatory value, and we evaluate the system’s performance. The results are described in section 6 where we also provide a direction for further work in this field. Finally, in section 7, we draw conclusions.
2. HAPTIC SYSTEMS 2.1. Introduction Haptics is related to the study of touch and the cutaneous senses. The word “Haptic’ derives from the Greek haptesthai, meaning ‘able to touch’. This word was introduced at the beginning of 20th century by research work in the field of experimental psychology. Currently, such a term has brought many disciplines, including biomechanics, psychology, neurophysiology, engineering, and computer science to meet for the important aim of contributing to the study of human touch and interaction with the external environment. This concept is mainly associated with active tactile senses, such as those of our hands. These senses can be categorized in several ways and they form a link to the kinesthetic senses. By using special input/output devices (joysticks, data gloves, or other devices), users can receive feedback from computer applications in the form of felt sensations in the hand or other parts of the body [22]. The development of haptics has been distributed in several research fields, but especially significant contributions have surfaced from particular domains. First, psychophysical experiments provided the contextual clues involved in the haptic perception between the human and the machine. Second, the area of tele-operation and tele-presence provided the practical essence of this new technology.
2.2.
Applications
In combination with a visual display, haptics technology can be used to train people for tasks requiring hand-eye coordination, such as surgery and handling hazardous substances. It can also be used for games that connect the visual experience to the cutaneous senses. For example, you might play a “haptic paddle pong game” with another computer user somewhere else in the world. Both of you can see the moving ball and, using the haptic device, position and swing your pong racket and feel the impact of the ball [23]. By gaining access to the perceptual information of the objects such as shape, weight and object stiffness through the haptic display, the computer generation world is extended to simulate real applications. Therefore, the application spectrum is quite vast, and its trend of expansion is expected to continue. Applications of this technology have rapidly spread to devices applied to graphical user interfaces (GUI’s), games, multimedia publishing, scientific discovery and visualization, arts and creation, editing sound and images, vehicle industry, engineering, manufacturing, tele-robotics and tele-operation, education and training, medical simulation and rehabilitation. Consequently, haptic research and development has been focused to design and evaluate several prototypes of different characteristics and capabilities for use in virtual environments. Recently some of these prototypes have become commercially available in the market. Haptic interfaces are becoming part of research studies being conducted in many disciplines such as neuroscience, robotics, virtual reality, and
medicine and although they are not yet as commonplace a tool as the computer itself is today in our environment, they are gaining ground in terms of usage in real-world applications, and, like any other system, authentication and/or verification of users becomes a necessity. Hence, in this work we set out to create such authentication and verification system for applications that use haptic Tools and instruments.
3. RELATED WORK Using haptics as a mechanism for identifying and verifying the authenticity of users is a novel avenue for research in haptics, which involves disciplines such as traditional behavioural biometric systems, physiological studies and haptic perception. It has been shown that haptic-based biometrics can be feasible [3][4]. Biometrics is a wide field of study which can be related with disciplines that fall into behavioral approaches such as, keystroke dynamics, speaker recognition, gait analysis, signature verification and physiological methodologies. Among the most popular of these approaches are iris recognition, fingerprints, retina scans, hand and ear geometry, DNA analysis, and palm prints. Our methodology is related to dynamic signature verification and keystroke dynamics, due to the specification of the hapticbased applications that we implement. The initial motivation for the use of these methods is that there are special features that define, for example, a Handwriting human skill, which consists of artificial graphic marks on a surface. In addition, its purpose is to communicate something based on a standard that represents the content not only in terms of language, but also by personalizing the characters that represent the information content [7]. Several types of analysis, recognition, and interpretation can be associated with handwriting [8] [9]. Consequently, numerous methods and approaches have been proposed in this domain [10] [11]. However, due to the technology available, this research was initially focused on static variables that were not directly associated with a function of time. On the other hand, time-based comparison can be performed by Dynamic Signature Verification (DSV), which analyzes different features such as the shape, speed, stroke, pen pressure and timing information of a test signature during the act of signing. This requires the extraction of writer-specific information from the signature signal, regardless of its handwritten content [12]. Several approaches have been proposed to provide favourable conditions for the deployment of dynamic signature verification (DSV) systems [13], [14]. An idea associated with DSV is the use of haptic devices to provide users with force feedback information on the motion and/or the force to simulate a realistic environment with the real world. Based on a virtual environment with force feedback, the haptic parameters output from the devices such as force, velocity and position have not been exploited exhaustively yet [15]. Guerraz et al in [15] have presented a framework for active haptic evaluation using parameters coming directly from the haptic device. Their work is focused on the quantitative approach of measuring physical parameters as important threshold to validate the haptic user interface or experiments involved with haptic devices. In this paper we are using and evaluating physical attributes in order to build a biometric identifier to authenticate the identity of a user in a haptic system environment, helping us to understand the human behaviour when interacting with machines. In addition to identifying a user, we also propose approaches for verifying a user: a concept not explored in the related literature.
4. MODELING THE INFORMATION CONTENT OF HUMAN-HAPTIC INTERACTION
4.1.
General Experiment procedure
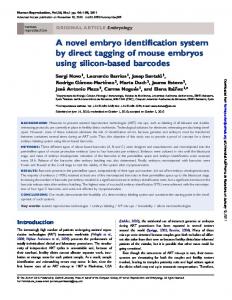
Every day, people interact with different devices, such as checking e-mail messages via the computer, driving a car, or using mobile phones. These devices have become part of our daily environment. It is probable that almost everybody has a unique way of opening a door, typing a massage, etc. In order to discover such patterns, we designed a set of experiments to conduct a simple hapto-task operation. First, one must realize that the data offered in a haptic environment is much broader than that of the traditional authentication tools, and therefore can be used for more elaborate authentication. Haptic systems can provide us with direct measurements of physical attributes such as force, angle, torque, and position, from which we can indirectly measure speed, pressure and acceleration of the user’s interactions. Second, all of the above features are provided in a 3D space covering width, height, and depth. We constructed a haptic maze application built on an elastic membrane surface, as shown in figure 1a. The user is asked to navigate
the stylus through a maze, which has sticky walls and an elastic floor. Such a task allows many different behavioural attributes of the user to be measured, such as reaction time to release from a sticky wall, the route, the velocity, and the pressure applied to the floor. Referring to figure 1a, the user is required to begin at “enter” and follow a path to “exit” without crossing any walls.
4.2.
Experiment Setup
The experiment was conducted by introducing a total of 22 different participants to the haptic interfaces and by providing a brief explanation about those devices and the purpose of the experiment. Each person performed the exact same maze 10 times, one trial immediately after the other. Participants were given the opportunity to practice the maze before the trials are actually recorded, in order to mitigate the warm-up effect. Participants’ movements were captured for the purposes of analysis. Since there is only one correct path through the maze and the ability to solve the maze was not being judged, we ensured participants knew how to correctly solve the maze in advance.
Figure 1 a. Screenshot of a user navigating the maze. The stylus path is indicated with the blue line. The picture besides shows the color codes of the Maze Recording Process
Figure 1 b. The PHANToM device used as the haptic instrument.
Therefore the maze was used to capture psychomotor patterns of each individual. The haptic software application was developed in a combination of Python script code and VRML-based scene graph module using the PHANToM haptic interface [5] which is shown in figure 1b.. The 3D environment was defined by using VRML-node-fields approach, while Python provided the procedural processes to handle certain events, and to output the data to a file. The haptic stimuli are provided by accessing the Reachin API [6], which handles the complex calculations for the touch simulation defined in the haptic rendering loop and the synchronization with graphic rendering. As can be seen in figure 1, the process starts with recording data when the user first makes stylus contact within a reasonable radius of the starting point of the maze, marked as “enter”. The trial ends when the user reaches the end point of the maze marked as “exit”, at which point the application stops recording data (the maze changes colour to indicate this). The software application is able to record two types of 3D world coordinates: the weighted-position and the device position. The weighted-position is calculated as an average of the pen’s real location versus its position on the maze if it was not elastic. The device position is a format for expressing the real position of the pen. The data files also record the force and torque applied by the pen on the maze as 3D vectors, as well as the pen’s angular orientation. Furthermore, all of the aforementioned physical attributes are recorded as a function of real time. A second application was implemented with the target to remove any mental interference that could influence the performance of a user. This application, essentially a cheque signing application, allows for the extraction of human patterns observed during a human-computer interaction session. In order to discover such patterns, the application asked users to perform their hand written signature on a virtual check. It was built on a rigid membrane surface where the user was asked to perform their signature by navigating the stylus. The pen’s position, force exerted, and velocity are computed from the haptic-based application to provide input for obtaining the user’s patterns.
Figure 2: Screenshot of a virtual check application. The user is required to perform his/her hand written signature by using the haptic stylus in the area selected
Sixteen subjects, 4 females and 12 males, took part in this experiment. Most subjects were unfamiliar with haptics; therefore, they were first familiarized with the devices by way of several demonstrations where they subsequently became accustomed to the virtual environment. Written instructions were prepared to explain the task requirements. The task of signing the cheque was only a subsidiary exercise within a larger program (game). This is in contrast to the maze application, where users had only one objective. The idea of placing the cheque within a larger application was implemented to lessen the test anxiety.
4.3.
Haptic Data Collected
The data source created a database repository represented by a flat files system. The data files recorded the 3D world coordinates of the pen’s position, force exerted, and angular orientation. Indirectly, other features were generated such as velocity, acceleration and pressure. These features were computed from the hapticbased applications, in order to provide the input for obtaining users’ patterns. Table 1 shows an example of some of the physical parameters obtained from the output of the haptic devices.
Trial
Timestamp
Position X
Position Y
1 1 1
0 … 0.0123090
0.23344 … 0.37676
0.56768 … 0.98989
…
Force X (N) 0.00456 … 0.03767
Table 1: Data describing physical characteristics of the human-haptic interaction
Additional features were also calculated from the output files, such as mean value, standard deviation and maximum and minimum values of each of the original physical attributes. The additional features provide an insight about the content of the haptic data. A set of ten trials was conducted by each participant; however, missing data from some of them was detected. Based on that set we could afford to discard one or two trials to keep a homogenous number for each participant, with which we form the feature vectors.
5. Building a Biometric Identifier In this section we discuss the rationale behind the design and implementation of our biometric identifier system.
5.1.
Haptic System State Vectors and their Distribution
The first step to identify measurable quantities that make users distinct from each other is to characterize the state of a haptic system. First, by capturing different physical attributes such as velocity (v), force (F), torque (T), and angular orientation of the stylus (θ), we built a vector r defined as an instance of the state vector which in the more general case contains m features described as rm = (vx, vy, vz, Fx, Fy, Fz, Tx, Ty, Tz, θ), where the subscripts x,y,z indicate spatial dimensions. For example, vx is the projection of the velocity vector onto the x axis. In order to evaluate the information content of specific features, we consider state vectors of a reduced dimension. For instance, in the analysis of the information content of velocity data, we consider state vectors of the form r = (vx, vy, vz). Due to each state vector, r provides a quantitative characterization of the system’s features at some moment in time. Therefore it is possible to define the state of the haptic system by the collection of such vectors. In terms of a dynamic system, there exists a set S of all state vectors with a finite, non-zero probability of measurement. The definition of S assumes the existence of a probability distribution function: f: S -> (0, 1]. Via the formulation of f, we define the probability of measuring a system to be in some unique state u, as: f(r = u).
5.2.
Relative Entropy
In order to investigate what variables involved in the state of the haptic system do not share information in order to apply such values to our a biometric system, we followed the measurement approach between two distributions called relative entropy. The relative entropy between probability distributions belonging to inter-person p(r) and intra-person q(r) on an entire population S is given by: D (p||q) = ∫ p(r)log(p(r)/q(r))dr. [16] . The relative entropy or Kullback and Leibler divergence, we can think of D(p||q) as describing the ‘distance’ of q from p . The term ‘distance’ is not intended to be taken in its most literal sense, since D (p||q) is not a true metric and also is not symmetric. Indeed, D (p||q) ≠ D (q||p) in the general case. From an information theory viewpoint, we interpret D (p||q) as a measure of how much information is contained in the assumption of a distribution p on S, when the distribution is actually q on S [17]. By the definition of D (p||q) : D (p||q) = 0 � p = q . This result indicates that no information is gained by correctly assuming that the distribution is p. The choice of logarithmic base used in the integration of p(r)log(p(r)/q(r))dr corresponds to the units used to measure information [18]. In our study, we choose log2, yielding information measurements in ‘bits.’ This choice suits the potential application of our findings to a system where information is also measured in bits.
5.2.1. Analysis of Haptic Information Content For a given biometric feature, we average the information content for each individual user as shown in figure 3. On average, certain features are more informative than others. Indeed, using force as an identifier
Average Relative Entropy [bits]
would, on average, reveal the most information about a user (15 bits); whereas, using xy-Torque would reveal the least amount of information (3 bits). 16 14 12 10 8 6 4 2 0
xy Torque
Weighted Velocity
Stylus Velocity
xyz Torque
Force
Angular Orientation
Figure 3: Average Information Content of Biometric Features
Standard Deviation [%]
250
200
150
100
50
0
xy Torque
Weighted Velocity
Stylus Velocity
xyz Torque
Force
Angular Orientation
Figure 4: Standard Deviations from Mean Values of Information Content
However, the amount of information in features is extremely variant amongst the different users (See Figure 4). The most information found in any feature was in User 9’s angular orientation distribution (142 bits). The least amount of information was found in User 14’s xy Torque distribution (< 1 bit). The standard deviations from mean values of information content suggest that choosing a single identifier would not be the most effective approach in identifying individuals.
5.3.
Construction of Biometric Identifier
The Gaussian distribution is a suitable model of quantitative phenomena in the natural and behavioural sciences. Additionally, the normal distribution maximizes information entropy among all distributions with a known mean and variance; making it the natural choice of the underlying distribution for data summarized in terms of sample mean and variance [21]. Therefore, we conducted an analysis to investigate the content of a biometric feature representation of a single individual with respect to the feature distribution for the population.
Based on the average information across all population in the haptic system the mean vector, µ, and covariance matrix, cov, were used to characterize a Gaussian probability distribution f on S. For an arbitrary dimension ‘n’ of all r ε S, µ = (E[r1], E[r2],…, E[rn]) and covij = cov(ri,rj) = cov(rj,ri). If we define two Gaussian distributions p and q on S then the relative entropy measured in bits is:
(| cov p |)( e 1 D( p || q) = log 2 ( 2
trace ((cov p + (cov p − cov q )t (cov p −cov q ))
| cov q |
−1
cov q − I )
)
wherein, subscripts refer to the distributions p and q, and I is the identity matrix of rank n. [17]
5.3.1. Feature Distribution To evaluate the uniqueness of a user’s biometric features, we compare the probability of measuring that user’s interaction to be characterized by r vs. the probability of measuring any user’s interaction to be characterized by r. This comparison is done by calculating the relative entropy between the general (interpersonal) biometric feature distribution, p, and the specific (intra-personal) biometric feature distribution, q. D(p||q) measures the information content of the assumption that all individuals will have a feature distribution p, when indeed each individual has their own feature distribution q. To construct the general p distribution, we fit the measurements of all users’ identifiers to a Gaussian distribution. For each individual user, we construct a different feature distribution q. We formulate q by fitting of measurements of a single user’s identifiers to a Gaussian distribution. We use 21346 data points to construct the interpersonal distribution for each biometric feature. These points are collected from 22 different users’ completion of the haptic-based maze application. To construct the intra-personal distributions, we consider data from the last 5 trials of a user completing the maze. In the data collection process, each user completed the task 10 times. We choose to compile intra-personal distributions based on the last 5 trials completed by the user, to mitigate the warm-up effect [3].
5.3.2. Entropic Signatures The information content of biometric features differs amongst users of the haptic system, as evident from figure 5). As D (p||q) = 0 � p = q, and considering that all users had non-zero information content of all features, our analysis confirms that the biometric identifiers are at least somewhat unique to an individual. Our measure of that uniqueness is D (p||q). Therefore, we can characterize the identity of an individual by how unique their features are. The characterization takes the form of an entropic signature. From a statistical perspective, an entropic signature is a vector s = (D (p1||q1), D(p2||q2),…D(pn||qn) ), where subscripts denote the different biometric identifiers. By its definition, s characterizes the uniqueness of each individual’s various biometric features. From a geometrical perspective, an entropic signature can be modeled as a curve in the plane. Figure 6 presents a small collection of entropic signatures obtained from 10 users. We propose the following analogy: users interact with the haptic system in a similar way to how people sign their name. The scale and size of each letter in a handwritten signature is analogous to the magnitude of each D (pi||qi) in an entropic signature. The shape of letters in a handwritten signature is analogous to the distribution of information content in an entropic signature.
60
Relative Entropy [bits]
50 xy Torque
40
xyz Torque Force
30
Weighted Velocity Stylus Velocity
20
Angular Orientation
10
0
1 2 3 4 5 6 7 8 9 10 11 12 13 14 15 16 17 18 19 20 21 22 User
Figure 5: Relative Entropy of User Features.
A biometric recognition system based on handwritten signatures would operate differently from a system based on entropic signatures. The underlying assumption of identity recognition based on handwritten signatures is that each signature is unique. From this assumption, the system makes a geometrical analysis of a sample of handwriting. A biometric recognition system based on entropic signatures would operate differently. The uniqueness of the signature features are evaluated, not assumed. So instead of evaluating geometry based on an assumption of uniqueness, this system would evaluate uniqueness based on an assumption of geometry. The geometric assumption translates into the statistical assumption that one can indeed construct s for any individual.
User 1
Relative Entropy [bits]
70
5
20
5
0
0
0
60 50 40
50
20
20
0
0
0
30 20 10 0 1
2
3
4
Biometric Feature
5
6
1
200
10
100
0
0
0
Figure 6: Sample entropic signature of User 1 (left). Sample entropic signatures of different users (right).
5.4.
Construction of Biometric Identifier: IDENTYFICATION VS VERIFICATION
We are interested in identity recognition and/or verification based upon measurements of the human-haptic interaction. The fundamental assumption of our study is that each person interacts with haptics in a unique
way. As already mentioned, measurements have been taken from a small group of users interacting with the PHANTOM Desktop Stylus. These measurements are of position, force, torque, and time. In the previous section, we stated that, on average, force and torque measurements contain the most information. In general, biometric systems are of two varieties: identification and verification systems [2][19]. The former is designed to establish the identity of an unknown individual: the system recognizes an individual by searching patterns of all users in database for a match whereas. The latter is designed to verify the claimed identity of an individual: the system validates an individual’s identity by comparing the captured biometric data with its own biometric pattern or patterns which have been stored in the database previously. Put otherwise, identification systems respond to the query “who is this user?”, while verification systems respond to the query “is this user who s/he claims to be?” As we will show next, our results indicate that haptic-biometrics is best suited for verification, where it achieves much better performance compared to identification.
5.5.
Methodology
The precision of a biometric system is reliant on the choice of features used to form biometric profiles. For accurate identity recognition, features must be chosen so that they are unique for each individual. Relative entropy calculations allow us to identify such features embedded in raw human-haptic interaction data. Using signal processing techniques, we extract these features from the raw data to form biometric profiles of haptic users. Next, we employ pattern recognition methods to authenticate the identity of these users. Authentication decisions are made by measuring the match score between two profiles. A predetermined threshold value places an upper bound on acceptable match scores. Our haptic-biometric system is structured into modules corresponding to the different phases of this process, as shown in figure 7.
Figure 7: Overview of the proposed Framework
5.5.1. Feature Extraction There exists a vast array of possible features that we can extract from the raw human-haptic interaction data. To maximize the precision of our biometric system, we choose to only extract features that are the most indicative of a users’ identity. The relative entropy measure provides us with a mechanism to assess the information content of all features; thus, calculations of relative entropy allow for us to evaluate the user-classificatory worth of the different features. As we discuss in section 5.2.1, force and torque data contain the most information pertaining to identity. Therefore, we choose to extract features from raw force and toque signals. This choice is made in order to maximize the variance between the profiles of different users. These biometric profiles are formed, as we discuss next, by processing the rich force and torque data.
5.5.2. Signal Processing: Biometric Profile
The function of the signal processing sub-system (SPS) is to form the biometric profile of a user given the input of raw force and torque data and the decision-making process carried out in the relative entropy analysis. The format of the raw data is a set of six-dimensional state vectors obtained via frequent measurements of the haptic interaction. These state vectors provide quantitative snapshots of the interaction. The rate of sampling is ~ 15 milliseconds. For each dimension of the state space, there is the associated biometric feature; i.e., ‘force in the z direction’. We consider measurements of different features as separate signals. To process these signals with the most rich content and asses them in order to quantify the shared information between two distributions; we first apply a hamming window of length 256. Subsequently, we take the fast Fourier transform of each windowed signal. Hence, the input data to the SPS is transformed into a 256x6 matrix in frequency domain, whose 6 columns are associated with pairwise distinct biometric features. We refer to this matrix as the biometric profile.
5.5.3. Profile Recognition A biometric system is essentially a pattern recognition system that operates by acquiring biometric data form an individual, extracting a feature set from the acquired data, and comparing this feature set against the template set in the database.
5.6.
Classifier Design
In this section we describe the rationale behind our classifier design.
5.6.1. Quantitative Score The sample vs. template comparisons produce a quantitative match score. The match score between two biometric profiles d1 and d2 is calculated using: 6
MS = ln{
256
∑∑
( ||d1,i,j|| - ||d2,i,j|| ) ^2 }.
i =1 j =1
In the above equation, ln denotes the natural logarithm and ||d1,i,j|| denotes the complex norm of the i,jth element of biometric profile 1. The summation indices run to the number of features (6), and the length of the windowed signals (256). By definition, a low MS implies a small difference between two profiles, while a high MS implies a large difference. Essentially, the MS measures the separation between two biometric signals.
5.6.2. Decision Sub-System The decision sub-system (DS) serves to either accept or reject a user. The identification DS accepts a user by establishing their identity, and rejects a user if this establishment cannot be formed. To identify a biometric profile, the match score between that profile and one of the template profiles must be less than or equal to some upper bound τ. The performance of the identification system is variant with the choice of this upper bound. If τ is chosen to be large, lots of imposters will match with template profiles; whereas, if τ is chosen to be too small, some genuine users will fail to match with their template profile, as shown in Figure 8.
# of Comparisons
Genuine Distribution Imposter Distribution
Match Score τ1
τ2
Figure 8: Match scores less than τ2 would allow access to a significant portion of imposters; whereas, Match scores less than τ2 would deny access to a significant portion of genuine users.
By sending many raw signals through the SPS and the PRS, we evaluate the system performance. Comparisons between profiles of the same user yield a ‘genuine’ MS distribution. Comparisons between dissimilar profiles yield an ‘imposter distribution.’ For different values of τ, we calculate the FAR (false accept rate) by integrating the imposter distribution from zero to τ. We calculate the FRR (false reject rate) by integrating the genuine distribution form τ to infinity. The set of points FRR (τ), FAR (τ ) form the ROC (Receiver Operating Curve). The verification DS operates differently. Using the pre-stored template profiles, we determine a different threshold Match Score for each user. To calculate a specific threshold for a user, we first construct a genuine distribution based only upon comparisons of this user’s template profiles. Then, we form an imposter distribution by comparing all dissimilar user profiles to this user’s profiles. We construct several sets of threshold values where the FAR rate is constant amongst the users; hence, allowing the construction of the ROC.
5.7.
Results
In this section, the results of our trials and analysis are presented.
5.7.1.
Spectral Analysis
Our methodology requires the spectral analysis of biometric signals produced by the SPS. We assume that two signals from the same user will have a closer match when compared with the signal from another user. Our findings support this claim; however, due to the time-variability of an individual’s biometric profile, the like-signals are not perfectly matched, as illustrated by Figure 9.
Figure 9: window #1 and window #2 are from the same user; whereas window #3 is from a different user.
5.7.2.
Identification Mode
As mentioned earlier, 22 different participants completed the haptic maze application 10 times. Our analysis shows that the probability of successful identification (PV) depends on which sections of the windowed signals are used in the calculation of MS. PV is calculated as 1 – FRR, and figure 10 shows the variance of PV with signal section. At 25% FAR, PV was highest for data from the 6th,7th,and 8th trials completed by the users. The genuine and imposter distributions drawn from these data sets are shown in figure 11. The analysis of these trials through window 8 (see figure 12) allowed for the highest PV @ 25% FAR. The ROC curve using data from the 7th,8th,and 9th trials is shown in Figure 11. PV also depends on the length of the hamming windows that are applied to the raw data. By doubling the length of the window, PV improves from 71.2% @ 25.5% FAR to 75.5% @ 24.7% FAR. Despite the improvement of PV with an increase in window size, one cannot simply choose an arbitrarily large window size, due to the finite length of a raw signal. In the cases where the length of the window exceeded the length of the raw signal, the signal was padded with zeros. PV vs. Windowed Signal Sections 70
PV @ 25% FAR
68 66 64 62 60 58 56 1
3
5
7
9
11
13 15
17
Window Section
19 21
23
25
Figure 10: Probability of Verification seen through different windowed signal sections.
Figure 11: The imposter (left) and genuine (right) match score distributions from profiles constructed from trials 7,8 and 9 of the maze test. The genuine distribution is bimodal, which shows the significant inconsistency certain users have between their different profiles.
Figure 12: ROC for the identification system based on 3 trials from the maze tests seen through window 8. The line of identity is used to show the equal error rate of (EER) ~ 27%.
PV @ 25% FAR
The Data from the virtual cheque signatures was also analyzed as input to an identification system. Each of 14 users signed their cheque 9 times. Using the samples taken from the first 8 trials, PV was calculated as 50% at 25% FAR. By removing samples from the first 4 ‘warm-up’ trials, PV increased. This trend continued as shown in Figure 13. 90 80 70 60 50 40 30 20 10 0
First 8 Trials
Last 4 Trials
Last 3 Trials
Last 2 Trials
Dataset
Figure 13: The probability of successful identification as a function of the dataset used for testing.
5.7.3.
Verification Mode
The identity verification system is more precise than the identification system. With raw data obtained from human interactions with the maze application, we form three template profiles for each user. The aforementioned templates are generated using data from the seventh, eighth, and ninth trials completed by each user. We then use data from trials six and ten to create sample profiles, in order to make comparisons against the templates. The test results from trial ten were more accurate than the test results using samples from trial six. This agrees with the notion that users behave more consistently as they become more familiar with using the haptic application.
In verification mode, we integrate additional features into the biometric profiles: total time taken to solve the maze, and average angular orientation of the stylus. The system accepts a user claiming to be X, if their biometric profile meets the following criteria: (1) the spectral analysis match score (with template X) is below a predetermined user-dependent threshold, (2) the total time taken to solve the maze no more than 26.4% different than the average of times recorded in the X’s template, and (3) the average angular orientation is no more than 20% different than that of the X’s template. Using test samples gathered during trial 10, the system performance is evaluated: PV = 95.4% @ 4.5% FAR; moreover, the equal error rate of the system is 4.5%. When presented with feature vectors characterizing users’ interactions with the virtual cheque, our verification system performance is variant with the methodology chosen for match score generation. Template profiles are formed using each user’s first five signatures, and sample profiles are created using the remaining four signatures. Using a spectral analysis approach, the percentage of the equal error rate of the system is quite high: 18.8%. This result motivates us to propose two different methods for signature verification, among which is dynamic time warping, whose successful application to dynamic signature verification is well known. The dynamic time warping algorithm produces a match score between two biometric profiles by computing the minimum cost of aligning two sets of time-series measurements. We use two-dimensional time-series position data to characterize the virtual signature, and thus for use in the dynamic time warping calculations. The identity of a user is verified by the system if their sample signature produces a match score, less than a predetermined threshold, with at least two of the associated template signatures. The performance of dynamic time warping supercedes that of spectral analysis, as depicted in Figure 14. We also take another approach is towards virtual signature verification, where the match scores are produced via a simple calculation of the Euclidean distance between the 2nd and 3rd virtual 3D world coordinates of template and sample signatures. The results of employing this method for user verification are quite good, considering its simplicity. These results are also depicted in Figure 14. The false accept rates shown in Figure 14 are generated by the acceptance of ‘random’ forgeries. A random forgery is a signature that is falsely verified, despite the fact that no such verification was intentionally sought. We also evaluated the false accept rates generated by ‘skilled’ forgeries – intentionally fraudulent submissions. These skilled forgeries were made using, as a visual reference, handwritten signatures of five participants who signed the virtual cheque. At an operation level of 97.0% PV, the Euclidean method falsely accepted 20% of the skilled forgeries. Using dynamic time warping, 26% of the skilled forgeries were accepted at an operation level of 93.8% PV.
Figure 14: Receiver Operating Curves depicting the performance of several verification algorithms. The ‘Euclidean’ method allows for the highest (98%) PV at 25% FAR; however, the dynamic time warping algorithm is more reliable at low FAR operating levels.
6.
CONCLUSIONS and FUTURE WORK
One distinct advantage of using relative entropy as a measure of biometric feature uniqueness is that it accounts for both the mean and variance of a distribution. Analyzing the means and variances separately, using a first order statistical approach, cannot characterize uniqueness in the same way as D (p||q). For example, consider the velocity distributions of the users. The magnitude of the mean velocity is directly proportional to the variance [2]. Put otherwise, the user with the fastest mean velocity exhibited the most variability in their behaviour. On the other hand, the user with the slowest mean velocity exhibited the least variability in their behaviour. It turns out that we get more information from the slower user. The slow user’s behaviour is a more consistently characteristic; hence, a higher level of relative entropy exists between that user and the population. Suppose that two users have the same mean velocity. Then, from a first order statistical perspective, they are identical users. However, if the variance of user A’s speed is greater than and the variance of user B’s speed, more information is contained in user B’s velocity distribution. In this case, user B is more unique than user A, and so we get more information from the behaviour of user B. The results of our study suggest that haptic-based biometric systems are best suited to verification applications. At 25% FAR, the PV of our maze-based identification system was at best 75.5%, while the PV of the verification system was at best 95% at 4.5% FAR. The equal error rate of the identification system was 27%, compared to the 4.5% EER of the verification system. The majority of conventional biometric systems (iris scanners ,voice recognition, fingerprint/hand geometry, etc) can only assure that the correct user is present at the time of login. Indeed, such systems perform much better than the haptic identification systems studied in this report [20]; however, after a user logs in, these systems have no way to detect if the correct user is still present. The haptic verification systems overcome this difficulty. During the usage of the haptic application, our haptic-biometrics system can determine continuously and as needed whether the user who is using the system is still the user that originally logged in. This operation is applicable to high-security environments, where each manipulation of the system would ideally be followed by identity conformation/rejection. We also believe that the haptic biometric system can be improved by incorporating an adaptive feedback between the feature extraction and feature selections process. Adaptive feedback can be developed based on the nature of the requirements of the haptic based application but also by the preliminary analysis from the relative entropy approach.
ACKNOWLEDGEMENTS The authors acknowledge the research and development contributions of Matthew Graydon, specially with the relative entropy analysis and the verification system, as well as the financial assistance of the Natural Sciences and Engineering Research Council (NSERC) of Canada and the scholarship given to Mauricio Orozco Trujillo by the Consejo Nacional de Ciencia y Tecnologia de Mexico (Mexican National Council for Science and Technology).
REFERENCES [1] D. Maltoni, D. Maio, A. K. Jain, S. Prabhaker, “Handbook of Fingerprint Recognition”, pages 2-3, Springer, New York, 2003. [2] Jain, A.K.; Ross, A.; Prabhakar, S.;” An introduction to biometric recognition” Circuits and Systems for Video Technology, IEEE Transactions on Volume 14, Issue 1, Jan. 2004 Page(s):4 - 20 [3] Y. Asfaw, M. Orozco, S. Shirmohammadi, A. Adler, and A. El Saddik, “Haptic-Based Biometrics: A Feasibility Study”, Proc. IEEE Symposium on Haptic Interfaces for Virtual Environment and Teleoperator Systems, Alexandria, VA, USA, March 25-29 2006, pp. 265 – 271.
[4] M. Orozco and A. El Saddik, "Haptic: The New Biometrics-embedded Media to Recognizing and Quantifying Human Patterns" In proceedings of 13th Annual ACM International Conference on Multimedia (ACM-MM 2005), Singapore, November 06-12, 2005. [5] Massie, T., and K. Salisbury, “The PHANToM Haptic Interface: A Device for Probing Virtual Objects”, Proc. ASME Symposium on Haptic Interfaces for Virtual Environments and Teleoperator Systems, Chicago, IL, U.S.A., November 1994, DSC-Vol. 1, pp. 295-301. [6] Reachin Technologies http://www.reachin.se/, last visited May 2006 [7] C. F. Colmas, “The Writing Systems of the World”, Blackwell, 1980. [8] L. D. Earnest, “Machine reading of Cursive Script”, IFIP Congress, pp. 462-466, Amsterdam, 1963. [9] M. Eden, “Handwriting and Patten Recognition”, IRE Transactions on Information Theory, vol. 8, 1962. [10] R. Plamondon, D. Lopresti, L.R.B. Schomaker, and R. Srihari, "On-Line Handwriting Recognition: A Comprehensive Survey", Encyclopedic of Electrical and Electronics Engineering, J.G. Webster, ed., vol. 15, pp. 123-146, New York, Wiley, 1999. [11] C.C. Tappert, C.Y. Suen, and T. Wakahara, "The State of the Art in On-Line Handwriting Recognition", IEEE Transactions on Pattern Analysis and Machine Intelligence, vol. 12, no. 8, pp. 179-190, 1990. [12] R. Plamondon and S.N. Srihari, "On-Line and Off-Line Handwriting Recognition: A Comprehensive Survey", IEEE Transactions on Pattern Analysis and Machine Intelligence, vol. 22, no. 1, pp. 63-84, 2000. [13 F. Lerclerc and R. Plamondon. Automatic signature verification: the state of the art -- 1989 - 1993. Int. Journal of Pattern Recognition and Artificial Intelligence, 8(3), 1994. [14] R. Plamondon et. al., “Pattern Recognition, Special issue on automatic signature verification”, R. Plamondon ed., vol. 8, no. 3, 1994. [15] A. Guerraz, C. Loscos, and H.R. Widenfeld, “How to use physical parameters coming from the haptic device itself to enhance the evaluation of haptic benefits in user interface?”, EuroHaptics 2003, Dublin, Ireland. [16] M. Lexa, "Useful Facts about the Kullback-Leibler Discrimination Distance," Technical. Report., Rice University, 2004. [17] A. Adler, R. Youmaran, S. Loyka, Towards a measure of biometric information Accepted for Can. Conf. Computer Elec. Eng. (CCECE), Ottawa, Canada, May 7-10, 2006 [18] C. E. Shannon, ``A mathematical theory of communication,'' Bell System Technical Journal, vol. 27, pp. 379-423 and 623-656, July and October, 1948. [19] J.L. Wayman, “Testing and Evaluating Biometric Technologies: What the Customer Needs To Know”, Proc. CTST’98, May 1998. [20] T. Mansfield, G. Kelly, D. Chandler, J. Kane, “Biometric Product Testing” Final Report, Centre for Mathematics and Scientific Computing National Physical Laboratory Queen’s Road Teddington Middlesex , 2001. [21] Wikipeddia http://en.wikipedia.org/wiki/Normal_distribution, last visited May 2006 [22] searchSMB.com Definitions:”Haptics”. http://searchsmb.techtarget.com/sDefinition/0,,sid44_gci212226,00.html [23] “The haptic battle pong” project presented at the Experimental Gameplay Workshop at Game Developers
Conference Game Developers Conference 2004 March 2004,San Jose, CA