The International Archives of the Photogrammetry, Remote Sensing and Spatial Information Sciences, Volume XLII-2/W7, 2017 ISPRS Geospatial Week 2017, 18–22 September 2017, Wuhan, China
A NOVEL FUSION-BASED UNSUPERVISED APPROACH FOR MULTISPECTRAL IMAGE CHANGE DETECTION WITH SALIENCY MAPS Along Zhang a, *, Gangwu Jiang a , Lei Shao a , Yi Zhang a, Junying Fang b, * a
b
Geospatial Information Faculty, Information Engineering University,Zhengzhou 450001,China -
[email protected] Facultéde Sciences Fondamentales et Biomédicales, UniversitéParis Descartes, 75006 Paris, France -
[email protected]
Commission III, WG III/6 KEY WORDS: Change detection, NSCT, Saliency maps, Image fusion
ABSTRACT: To fully utilize the spectral information and remove noise in multispectral image change detection, A fusion-based unsupervised approach, which exploits NSCT (Nonsubsampled Contourlet Transform) and multi-scale saliency maps for detecting changed areas by using multispectral images is presented in this paper. Firstly, aiming at make full use of multispectral information, each band of the multitemporal images is applied to get an initial difference image set (IDIS), which is then decomposed into several low-pass approximation and high-pass directional sub bands by NSCT; In order to remove most of the noise, saliency maps of each sub bands and each scales are obtained by processing only the low-frequency sub-band coefficients of the decomposed image; Finally the binary change map is extracted by using a novel inter-scale and inter-band fusion method. Experimental results validate the superior performance of the proposed approach with respect to several state-of-the-art change detection techniques. 1. INTRODUCTION Remote sensing image change detection is the technique of qualitatively or quantitatively analyzing and determining the characteristics of surface change in multi-temporal remote sensing images of the same geographical area but from different times(Singh, 1989). In recent years, with the development of aerospace and imaging technology, remote sensing image change detection technology has played an active and important role in many fields such as land dynamic detection, forest vegetation change, urban expansion and disaster monitoring(Radke and Andra, 2005). However, since the quality of remote sensing images is susceptible to seasonal change, atmospheric radiation and other factors, how to accurately determine the changed and unchanged areas from the image pairs still remains a difficult problem. Change detection algorithms can be divided into two categories on the basis of whether priori information is used during the process, supervised and unsupervised method. Unsupervised change detection is mainly implemented by using clustering algorithms (Celik 2009; Singh 2014; Ding et al. 2015) or statistical models (Bruzzone 2000; Bazi et al. 2005; Celik et al. 2011; Zanetti et al. 2016) based on the difference images. The advantage of unsupervised method is that there is no need for a prior knowledge of the ground truth information about the study area but it is hard to get an accurate difference map. Some fusion-based approaches on the ground of statistical models like DeNSCT (Li 2012) has also been proposed but it fails to balance the approximate part and detailed part of the difference image. The supervised change detection method mainly includes two aspects: post-classification algorithms (René2012; Seebach 2013) and classifier-based algorithms such as Support Vector Machine (SVM) (Volpi 2010), neural network (Wang 2015) and random forest (Wessels 2016). This method achieves higher accuracy and identify the type of land cover but proper
training set is needed, which may cause a lot of inconveniences. So unsupervised methods are still widely used and studied. To address the problems discussed above, in this paper, we proposed a fusion-based unsupervised change detection method with saliency maps for multispectral images. As is illustrated in Figure 1, firstly each band of the multitemporal images is applied to get an IDIS, which is decomposed into several lowpass approximation and high-pass directional sub bands by NSCT; Then saliency maps of each sub bands and each scales are obtained by processing only the low-frequency sub-band coefficients of the decomposed image; The final change map is extracted by a novel inter-scale and inter-band fusion method. Experimental results validate the effectiveness and feasibility of the proposed method.
Figure 1. Framework of the proposed method
* Corresponding author
This contribution has been peer-reviewed. https://doi.org/10.5194/isprs-archives-XLII-2-W7-1031-2017 | © Authors 2017. CC BY 4.0 License.
1031
The International Archives of the Photogrammetry, Remote Sensing and Spatial Information Sciences, Volume XLII-2/W7, 2017 ISPRS Geospatial Week 2017, 18–22 September 2017, Wuhan, China
while neglecting high-frequency information. Suppose the IDIS is decomposed into K levels, the approximated coefficient set is given by:
2. METHODOLOGY 2.1 Initial Difference Image Set
ADkn AD11 ; AD12 ... AD1n ... ADkn
In the first chapter, let us consider a pair of two registered multispectral images X 1 X 1 i, j | 1 i I ;1 j J and
X 2 X 2 i, j | 1 i I ;1 j J with the size of I J and N bands, acquired at the same location but different time distances. The initial difference image set (IDIS) is expressed as follows:
D n X 2n X 1n
for 1 n N ;
where D n is the initial difference image set and number of the band.
(1)
n
is the
2.2 Nonsubsampled Contourlet Transform(NSCT) The NSCT (Da 2006), based on the theory of contourlet transform(Do 2005), is a flexible multiscale, multi-direction, and shift-invariant image analysis method, which is able to sufficiently capture the geometrical details of the source image (Li 2012). The main structure of NSCT is composed of two filter banks, Non-Subsampled Pyramid Filter Banks (NSPFB) and NonSubsampled Directional Filter Banks (NSDFB) . The NSPFB is a multi-scale decomposed structure developed from átrous algorithm. Images or signals can be decomposed into a low-pass sub band (also called approximate sub band) and a bandpass one without subsampled processes. The sequent scale is repeated by decomposing the former low-pass sub band iteratively. As a result, a tree-like structure that enables multiscale decomposition is built. The NSDFB, constructed by combining the directional fan filter banks, is used to decompose the bandpass sub-band into several directional sub-bands without subsampled process, too. If L levels of directional decomposition on a sub-band that decomposed by NSPFB in a certain scale is conducted, then 2L number of band-pass subimages, the same size to original one will be produced. Compared with other multiscale methods (wavelet transform, contourlet transform et al.), NSCT is multi-directional, anisotropic, translation invariant, and capable of accessing the accurate edge, contour, and details information of an image. A brief structure of NSCT with two levels is depicted in Figure 2.
for
(2)
1 k K ,1 n N ;
where ADkn is the approximated coefficient set , k is the scale level and n is the number of band. 2.3 Saliency Maps Extraction Visual saliency is the perceptual quality that makes an object, person, or pixel stand out relative to its neighbors and thus capture our attention (Achanta 2009). It presents a hotspot in the area of image segmentation, video monitoring, target detection and tracking and so on. Recently, several researchers have applied visual saliency theories into remote sensing change detection due to the local contrast between changed and unchanged areas in difference image (Tian 2007; Hou 2016; Zheng 2016). In this paper, we introduce a frequency-tuned saliency detection (Achanta 2009) method (FT method for precision) to guide the change detection result. It can output full resolution saliency maps with welldefined boundaries of salient objects by retaining substantially more frequency content from the original image. FT method mainly consists of two parts: (1) DoG band pass filtering and (2) Saliency computation. Following are the details. (1) DoG band pass filtering is used to the initial image to avoid the impact of noise, coding artifacts, and texture patterns. The equation is defined as formula (3)
1 x y2 1 x y2 2 e 21 2 e 2 2 2 1 2
1 DoG ( x, y ) 2 where
1
2
2
2
(3)
and 2 are the two different standard deviations of
the Gaussian ( 1 2 ). To remove high frequency noise and textures, 1 is set to infinity. So formula (3) is just equal to a simple Gaussian filtering. The Gaussian blurred image is calculated as
I g x, y I x, y DoG x, y
(4)
where I g x, y is the Gaussian blurred image, I x, y is the initial image and stands for convolution operation. (2) Saliency map S of a specific image I is extracted from the Lab space. If I is a RGB image, it should be transferred into T Lab colour space and L, a, b vector is obtained at each pixel location. The final saliency map S is formulated as Figure 2. Brief structure of NSCT with two levels Since the directional sub bands contain the most part of the noise, which may cause high false alarm rate in change detection result, in our method, only the approximate sub band is considered. These approximated images on different scales are acquired only by reconstructing the low-frequency image
S I g( L ) I g( L ) ( x, y )
(5)
where I g( L ) is the mean image feature vector, and I g( L ) ( x, y) is the corresponding pixel vector value of the Gaussian blurred
This contribution has been peer-reviewed. https://doi.org/10.5194/isprs-archives-XLII-2-W7-1031-2017 | © Authors 2017. CC BY 4.0 License.
1032
The International Archives of the Photogrammetry, Remote Sensing and Spatial Information Sciences, Volume XLII-2/W7, 2017 ISPRS Geospatial Week 2017, 18–22 September 2017, Wuhan, China
image. In our case, since the single band is used for saliency detection, this process just is conducted on the original colour space and the formulation is as follows:
S I g I g x, y where
(6)
I g is the mean value of the intensity of the input image
and I g x, y denotes the intensity value of pixel at the location of
x, y .
The resultant saliency maps set of the
approximated coefficient collection is expressed in Equation (7).
SaDkn SaD11 ; SaD12 ...SaD1n ...SaDkn
7
2.4 Inter-scale and Inter-band fusion Based on the
k
SaDkn
in (7), the change detection mask at scale
from n th band (denoted as SaDM kn ) is acquired by EM
algorithm. Considering that the details would decrease and the approximated image would become vaguer and vaguer as the scale k increases, the communal part of the masks within a band may have the highest possibility to change. On the basis of this tuition, an inter-scale fusion is adopted to produce a series of change masks. Let SaDM n denote the inter-scale fusion result, the fusion method is shown in Equation (8).
SaDM n
K
SaDM kn
(8)
k 1
where
stands for the AND operator. Since each band of the
(a) (b) Figure 3. Experimental images. (a) image in 2009 (b) image in 2015 3.2 Results and Analysis To evaluate the performance of proposed method, we compared four existing change detection algorithms, PCAKmeans (Celik 2009), DeNSCT (Li 2012), FKLICM (Singh 2014), SHC (Ding 2015). The qualitative results are displayed in Figure 4 ((f) is the ground truth acquired by visual interpretation) while the quantitative results are presented in Table 1. From Figure 4 and Table 1 we can see that our method contains less false alarmed pixels, which can be seen clearly in the red rectangle, but the cost is the increase of the missed alarmed pixels (as shown in yellow rectangle). The PCAKmeans method uses block-based data analysis in order to reflect the contextual information, but if the false alarmed pixels cover a large region, it may fail to judge whether they change or not. DeNSCT employs both the high-pass and low-pass sub band for change detection, it can fully expresses the details information of the changed object, but it’s hard to decide the portion of the high-pass sub band. FKLICM exploits both the Kohonen network and FLICM to detect changed area of remote sensing images, the obvious problem is it fails to consider the relationship of different band of multi-spectral images. SHC method generates massive changed areas to avoid making fragmentary patches, which causes too much false alarmed pixels in the resultant mask.
multispectral image contributes to the change detection result, the final change detection mask can be generated by conducting an inter-band fusion operation, which is written as
SaDM
N
SaDM n
(9)
n 1
where SaDM represents for the final binary change mask and is the union operator.
(a) PCAKmeans
(b) DeNSCT
(c) FKLICM
(d) SHC
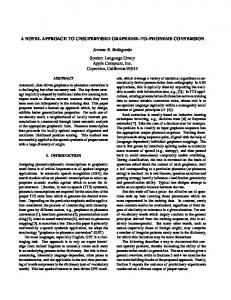
3. EXPERIMENTS AND RESULTS ANALYSIS 3.1 Dataset In order to validate the effectiveness of the proposed method, a pair of real bi-temporal images over Beijing urban area (Hou 2016) acquired on 28 June 2009 and 19 September 2015 respectively, is used in our experiment. This dataset contains 3 bands in visible spectrum with a size of 540×537 pixels and spatial resolution is 4 m. For the sake of achieving higher detection accuracy, typical pre-processing steps like image registration, radiation correction are executed in the first place. The pre-processed image is shown in Figure 3, from which we can clearly see that several buildings have changed greatly during this period of time.
(e) Ours (f) Ground truth Figure 4. Results of other method and ours and the ground truth
This contribution has been peer-reviewed. https://doi.org/10.5194/isprs-archives-XLII-2-W7-1031-2017 | © Authors 2017. CC BY 4.0 License.
1033
The International Archives of the Photogrammetry, Remote Sensing and Spatial Information Sciences, Volume XLII-2/W7, 2017 ISPRS Geospatial Week 2017, 18–22 September 2017, Wuhan, China
Table 1 Quantitative results of five methods (false alarm, missed alarm and total error stand for the number of pixels)
PCAKmeans DeNSCT FKLICM SHC Ours
False alarm 27090 14684 10984 32832 5255
Missed alarm 940 1121 1611 98 2207
Total error 28030 15805 12595 32930 7262
Accuracy rate 0.9033 0.9455 0.9566 0.8864 0.9742
In our experiment, decomposed scale was set as 4. In order to verify the impact the scale k would have on the final result, we set k as 1,2,3,4,5,6 respectively. The below histogram gives a general overview of the influence of different scales on the result. False alarm decreases and missed alarm increases when k changes from 1 to 6 and when k equals to 4, the total error reaches a minimum value, see Figure 5.
Transactions on Geoscience & Remote Sensing, 43(4), pp. 874887. Bruzzone, L., Prieto, D. F., 2000. Automatic analysis of the difference image for unsupervised change detection. IEEE Transactions on Geoscience & Remote Sensing, 38(3), pp. 1171-1182. Celik, T., 2011. Bayesian change detection based on spatial sampling and Gaussian mixture model. Pattern Recognition Letters, 32(12), pp. 1635-1642. Celik, T., 2009. Unsupervised Change Detection in Satellite Images Using Principal Component Analysis and K-Means Clustering. IEEE Geoscience & Remote Sensing Letters, 6(4), pp. 772-776. Da, C. A., Zhou, J., Do, M, N., 2006. The nonsubsampled contourlet transform: theory, design, and applications. IEEE Transactions on Image Processing. A Publication of the IEEE Signal Processing Society, 15(10), pp. 3089-3101. Ding, K., Huo, C., Xu, Y., et al., 2015. Sparse Hierarchical Clustering for VHR Image Change Detection. IEEE Geoscience & Remote Sensing Letters, 12(3), pp. 577-581. Do, M. N., Vetterli, M., 2005. The contourlet transform: an efficient directional multiresolution image representation. IEEE Transactions on Image Processing, 14(12), pp. 2091.
Figure 5. The influence of different scales
Hou, B., Wang ,Y., Liu, Q., 2016. A Saliency Guided SemiSupervised Building Change Detection Method for High Resolution Remote Sensing Images. Sensors, 16(9), pp. 1377.
CONCLUSION In this paper, an unsupervised approach with Nonsubsampled Contourlet Transform and multi-scale saliency maps change detection method is proposed for multispectral images . By decomposing the initial difference image set into several scales, most of the noise could be removed. Then a frequency-tuned saliency detection method is introduced to obtain the saliency maps in which the changed and unchanged area is clearly discrepant. Next EM algorithm is applied to these saliency maps to acquire the initial change mask set. In order to comprehensively utilize the information of each band and each scale, the final binary change mask is extracted by a novel interscale and inter-band fusion procedure. Given our experimental results, we find that this method can accurately detect the changed area for multi-spectral images. REFERENCES Achanta, R., Hemami, S. and Estrada F, et al., 2009. Frequencytuned salient region detection. In: Computer Vision and Pattern Recognition, 2009. CVPR 2009. IEEE Conference on. IEEE, pp. 1597-1604. Ashbindu, S., 1989. Review Article Digital change detection techniques using remotely-sensed data. International Journal of Remote Sensing, 10(6), pp. 989-1003. Bazi, Y., Bruzzone, L. and Melgani, F., 2005. An unsupervised approach based on the generalized Gaussian model to automatic change detection in multitemporal SAR images. IEEE
Li S, Fang L, Yin H., 2012. Multitemporal Image Change Detection Using a Detail-Enhancing Approach With Nonsubsampled Contourlet Transform. IEEE Geoscience & Remote Sensing Letters, 9(5), pp. 836-840. Radke, R. J., Andra, S., Alkofahi, O., et al., 2005. Image change detection algorithms: a systematic survey. IEEE Transactions on Image Processing, 14(3), pp. 294-307. René, R., Colditz, Joanna Acosta-Velázquez, José Reyes Díaz Gallegos, et al., 2012. Potential effects in multi-resolution postclassification change detection. International Journal of Remote Sensing, 33(20), pp. 6426-6445. Seebach, L., Strobl, P., Vogt, P., et al., 2013. Enhancing postclassification change detection through morphological postprocessing – a sensitivity analysis. International Journal of Remote Sensing, 34(20), pp. 7145-7162. Singh, K. K., Nigam, M. J., Pal, K., et al., 2014. A Fuzzy Kohonen Local Information C-Means Clustering for Remote Sensing Imagery. Iete Technical Review, 31(1), pp. 75-81. Tian, M., Wan, S., Yue, L., 2007. A Novel Approach for Change Detection in Remote Sensing Image Based on Saliency Map. Computer Graphics, Imaging and Visualisation. IEEE, pp. 397-402. Volpi, M., Kanevski, M., 2010. Supervised Change Detection in VHR Images Using Support Vector Machines and
This contribution has been peer-reviewed. https://doi.org/10.5194/isprs-archives-XLII-2-W7-1031-2017 | © Authors 2017. CC BY 4.0 License.
1034
The International Archives of the Photogrammetry, Remote Sensing and Spatial Information Sciences, Volume XLII-2/W7, 2017 ISPRS Geospatial Week 2017, 18–22 September 2017, Wuhan, China
Contextual Information. International Journal of Applied Earth Observation & Geoinformation, 20(2), pp. 77–85. Wang, Q., Shi, W., Atkinson, P. M., et al., 2015. Land Cover Change Detection at Subpixel Resolution With a Hopfield Neural Network. IEEE Journal of Selected Topics in Applied Earth Observations & Remote Sensing, 8(3), pp. 1339-1352. Wessels, K. J., Bergh, F. V. D., Roy, D. P., et al., 2016. Remote sensing Rapid Land Cover Map Updates Using Change Detection and Robust Random Forest Classifiers. Remote Sensing., 8(11), 888. Zanetti, M., Bruzzone, L., 2016. A generalized statistical model for binary change detection in multispectral images. IGARSS 2016 - 2016 IEEE International Geoscience and Remote Sensing Symposium. IEEE, pp. 3378-3381. Zheng, Y., Jiao, L,, Liu, H., et al., 2016. Unsupervised saliencyguided SAR image change detection. Pattern Recognition, 61, pp. 309-326.
This contribution has been peer-reviewed. https://doi.org/10.5194/isprs-archives-XLII-2-W7-1031-2017 | © Authors 2017. CC BY 4.0 License.
1035