A novel fuzzy C-means algorithm for unsupervised heterogeneous tumor quantification in PET Saoussen Belhassen Division of Nuclear Medicine, Geneva University Hospital, CH-1211 Geneva, Switzerland
Habib Zaidia兲 Division of Nuclear Medicine, Geneva University Hospital, CH-1211 Geneva, Switzerland and Geneva Neuroscience Center, Geneva University, CH-1205 Geneva, Switzerland
共Received 27 July 2009; revised 25 December 2009; accepted for publication 7 January 2010; published 25 February 2010兲 Purpose: Accurate and robust image segmentation was identified as one of the most challenging issues facing PET quantification in oncological imaging. This difficulty is compounded by the low spatial resolution and high noise characteristics of PET images. The fuzzy C-means 共FCM兲 clustering algorithm was largely used in various medical image segmentation approaches. However, the algorithm is sensitive to both noise and intensity heterogeneity since it does not take into account spatial contextual information. Methods: To overcome this limitation, a new fuzzy segmentation technique adapted to typical noisy and low resolution oncological PET data is proposed. PET images smoothed using a nonlinear anisotropic diffusion filter are added as a second input to the proposed FCM algorithm to incorporate spatial information 共FCM-S兲. In addition, a methodology was developed to integrate the à trous wavelet transform in the standard FCM algorithm 共FCM-SW兲 to allow handling of heterogeneous lesions’ uptake. The algorithm was applied to the simulated data of the NCAT phantom, incorporating heterogeneous lesions in the lung and clinical PET/CT images of 21 patients presenting with histologically proven nonsmall-cell lung cancer 共NSCLC兲 and 7 patients presenting with laryngeal squamous cell carcinoma 共LSCC兲 to assess its performance for segmenting tumors with arbitrary size, shape, and tracer uptake. For NSCLC patients, the maximal tumor diameters measured from the macroscopic examination of the surgical specimen served as the ground truth for comparison with the maximum diameter estimated by the segmentation technique, whereas for LSCC patients, the 3D macroscopic tumor volume was considered as the ground truth for comparison with the corresponding PET-based volume. The proposed algorithm was also compared to the classical FCM segmentation technique. Results: There is a good correlation 共R2 = 0.942兲 between the actual maximal diameter of primary NSCLC tumors estimated using the proposed PET segmentation procedure and those measured from the macroscopic examination, and the regression line agreed well with the line of identity 共slope= 1.08兲 for the group analysis of the clinical data. The standard FCM algorithm seems to underestimate actual maximal diameters of the clinical data, resulting in a mean error of ⫺4.6 mm 共relative error of −10.8⫾ 23.1%兲 for all data sets. The mean error of maximal diameter estimation was reduced to 0.1 mm 共0.9⫾ 14.4%兲 using the proposed FCM-SW algorithm. Likewise, the mean relative error on the estimated volume for LSCC patients was reduced from 21.7⫾ 22.0% for FCM to 8.6⫾ 28.3% using the proposed FCM-SW technique. Conclusions: A novel unsupervised PET image segmentation technique that allows the quantification of lesions in the presence of heterogeneity of tracer uptake was developed and evaluated. The technique is being further refined and assessed in clinical setting to delineate treatment volumes for the purpose of PET-guided radiation therapy treatment planning but could find other applications in clinical oncology such as the assessment of response to treatment. © 2010 American Association of Physicists in Medicine. 关DOI: 10.1118/1.3301610兴 Key words: positron emission tomography 共PET兲, FCM segmentation, intensity heterogeneity, anisotropic diffusion filtering, à trous wavelet transform I. INTRODUCTION Whole-body positron emission tomography/computed tomography 共PET/CT兲 imaging using 18F-fluorodeoxyglucose 共FDG兲 as probe of tumor metabolism has been recognized as an effective tool for diagnosis, staging, restaging, assessment 1309
Med. Phys. 37 „3…, March 2010
of response to treatment, and radiotherapy planning in oncological imaging.1 Diseased areas appearing as high uptake hot spots are usually carefully assessed qualitatively and quantitatively for clinical decision making. As a result, PET/CT had a significant impact on the management of patients as it precluded the need for further assessment, guided
0094-2405/2010/37„3…/1309/16/$30.00
© 2010 Am. Assoc. Phys. Med.
1309
1310
S. Belhassen and H. Zaidi: Unsupervised segmentation of heterogeneous tumors in PET
further diagnostic procedures, and assisted in planning therapy for a substantial number of patients. The introduction of the idea of biological target volume, in addition to the well established gross tumor volume 共GTV兲 and clinical target volume concepts, arose in order to include tumor biology into the radiation therapy treatment planning process.2 This has further stimulated the use of PET-guided radiation therapy treatment planning. In this context, the accurate delineation of target volumes on typical low resolution and noisy PET images was identified as one of the most complicated and challenging tasks facing PET-based GTV delineation for radiation therapy treatment planning.3,4 In addition to the above discussed application, accurate tumor segmentation from PET images plays a pivotal role in clinical diagnosis, volumetric assessment of tumor growth, and therapy response.5 Given that manual delineation of lesions is fastidious, subjective, and suffers from high intra- and interobserver variability, accurate and reproducible segmentation is difficult to achieve, in practice, particularly when dealing with complex shapes and heterogeneous activity distributions. Despite the difficulties and recognized limitations, several image segmentation approaches have been proposed and used in clinical setting.4,6–8 Commonly used semiautomated segmentation methods using constant or adaptive thresholding techniques have limited performance for accurate quantification of small 共relative to PET scanner’s spatial resolution兲 lesions and tumors with varying levels of perfusion and metabolism patterns 共inhomogeneous uptake inside the tumor volume兲. On the other hand, numerous works have attempted to address the difficult issue of automated lesion quantification and volume determination from the PET data.9,10 Nevertheless, none of the above referenced contributions has been assessed in the presence of nonspherical heterogeneous lesions, which, to the best of our knowledge, was addressed only by very few investigators.11 In this work, we use the fuzzy segmentation concept owing to its inherent suitability to the PET image formation process, namely, the high noise characteristics combined with the low spatial resolution and the resulting partial volume effect, and physiological motion. Partial volume effect is recognized as one of the most important physical degrading factors impacting lesion detection and quantitative analysis in oncological imaging.12 Owing to the limited spatial resolution of clinical PET systems, the resulting images will be blurred by the system response and, as a consequence, smaller lesions will appear larger. Although the total number of counts is preserved, they are distributed over a larger volume. Partial volume is usually addressed in the context of “small” lesions, i.e., with dimensions smaller than around two to three times the full width at half maximum of the PET scanner’s point-spread function.13 The fuzzy C-means 共FCM兲 algorithm has been successfully used in a wide variety of multimodality medical image segmentation tasks14–23 and particularly for segmentation of oncologic PET studies.11,24–26 Its advantages include a straightforward implementation and the ability to model uncertainty within the data. However, the major drawback of Medical Physics, Vol. 37, No. 3, March 2010
1310
FCM for medical image segmentation is that it does not incorporate information about the spatial context, which hampers its performance and increases its sensitivity to statistical noise and other physical degrading factors. Since PET data are noisy and subject to various sources of artifacts owing to the physics of the modality, several investigators attempted to incorporate local spatial information in the standard algorithm FCM to improve the performance of the segmentation process through modification of the objective function.27–31 In Ref. 27, the authors presented a spatial fuzzy clustering algorithm that exploits the spatial contextual information in image data. Note that the spatial contextual information refers to the neighborhood of each voxel to account for spatial voxel interdependencies with the aim to make the segmentation dependent not only on the voxel intensity but also on the voxel position with regard to neighborhood. The objective function of their method uses a new dissimilarity index that takes into account the influence of the neighborhood of the current voxel. Their algorithm is adaptive to the image content in the sense that the influence of the neighboring voxels is suppressed in heterogeneous regions of the images. In Ref. 28, the FCM objective function is generalized to include a spatial penalty on the membership functions. The penalty term leads to an iterative algorithm that is only slightly different from the original FCM algorithm and allows the estimation of spatially smooth membership functions. In Ref. 29, a novel modification of the objective function was made by adding a second term of regularization, which takes into account the neighborhood of each voxel of the image. In Ref. 30, the authors modified the objective function by using this time the filtered image calculated in advance. The technique was successfully used in the segmentation of magnetic resonance images. In the conventional FCM algorithm, the initial membership matrix is randomly generated. To overcome this drawback, Kannan32 described a more recent version of the FCM technique which rigorously defines the membership matrix in a fuzzy way. In addition, another new version of FCM was proposed in Ref. 20 with the aim to reduce the effect of noise during segmentation. The proposed method incorporates both the local spatial context and nonlocal information into the standard FCM algorithm using a novel dissimilarity index instead of the usual distance metric. Our initial trials for segmentation of oncological PET volumes using some of the above referenced techniques8,9 and the standard FCM algorithm used by our group for transmission image segmentation16 in addition to experience gathered by other investigators for this particular application11,24–26 motivated us to modify the FCM algorithm thoroughly by incorporating additional features adapted to the nature of PET imaging. On the basis of these observations, we developed a novel FCM classification technique more suited to typical oncological PET images presenting with lesions of arbitrary shape and tracer uptake. Our new approach modifies the objective function at three levels: 共1兲 A first regularization term using an anisotropically filtered image was added to the objective function to stabilize the segmentation; 共2兲 an adaptive regularization parameter is also added in order to control the intervention of this regularization term
1311
S. Belhassen and H. Zaidi: Unsupervised segmentation of heterogeneous tumors in PET
1311
II.A.2. Membership initialization The image component clustering process into c clusters is initialized through means-based thresholding. The algorithm requires two consecutive steps. First, the mean of all image voxel intensities is computed and the initial split is performed by assigning all voxels having intensities less than the overall mean to the first cluster. Second, all the voxels belonging to the first cluster are taken off from the obtained image data. Subsequently, the mean of the remaining voxels is computed and the voxel assignment for cluster 2 of this reduced sample set is achieved exactly in the same way as that for the first cluster. This procedure is repeated iteratively until all cluster assignments have been worked out for the defined number of clusters. Once the clustering step is done, the membership function can be easily initialized.
II.A.3. FCM-SW segmentation FIG. 1. Flowchart of the proposed unsupervised PET image segmentation algorithm.
with respect to the current voxel localization; and 共3兲 a second regularization term using the transformation result of the PET image by the à trous wavelet transform 共AWT兲 is also added to the objective function with the aim to incorporate information about lesion heterogeneity. The technique is validated using simulated phantom studies and clinical PET data of patients presenting with histologically proven nonsmall-cell lung cancer 共NSCLC兲 where the maximal tumor diameters were measured from the macroscopic examination of the surgical specimen and 7 patients presenting with laryngeal squamous cell carcinoma 共LSCC兲 where the 3D macroscopic tumor volume was considered as the ground truth for comparison with the corresponding PET-based volume.
II. MATERIALS AND METHODS II.A. Overview of the image segmentation algorithm
The developed unsupervised PET image segmentation algorithm is summarized in the following steps. The complete image segmentation system flowchart is shown in Fig. 1.
The proposed novel FCM segmentation procedure exploits the relationship of each voxel with its neighbors. The principles of the technique are summarized in the following items 共see Sec. II C兲: • The standard deviation of all 26 neighbors of a voxel is calculated in advance to refine the intervention of the regularization term. • Anisotropic diffusion filtering 共ADF兲 of the PET data is performed. • The original PET data are decomposed using the à trous wavelet transform, allowing the generation of three wavelet scales. • The original image, ADF-denoised data set, and the selected wavelet scale 共1, 2, or 3兲 are used, in conjunction in the optimization step of the novel FCM objective function. II.B. FCM clustering
The FCM algorithm was initially proposed in the 1970s by Dunn35 and extended later by Bezdek et al.36 as an improvement of the K-means algorithm. It assigns to every data element a membership function to each cluster. The objective function in the conventional FCM algorithm that allows the subdivision of the image into c clusters is given by the following equation: n
c
c
JFCM = 兺 兺 共uik兲m储xk − vi储2 subject to兺 uik = 1, k=1 i=1
II.A.1. Cluster number initialization In clustering analysis, one often faces the difficult issue of choosing the number of clusters. In this work, the number of clusters is computed by optimizing the Bayesian information criterion 共BIC兲, a model selection criterion derived from the statistics literature that uses Bayesian inference.33 It was shown that the BIC allows one to choose the number of clusters according to the intrinsic complexity present in the data.34 This approach was adopted in the present study. Medical Physics, Vol. 37, No. 3, March 2010
共1兲
i=1
where X = 兵x1 , x2 , . . . , xn其 is a data matrix of dimension p ⫻ n, p refers to the feature data vectors xk and n is their number, V = 共v1 , v2 , . . . , vc兲 is a vector of unknown cluster centers 共prototypes兲, while uik denotes the membership function of the kth vector to the ith cluster, 储 . 储 stands for the Euclidian norm, and m 苸 共1 , ⬁兲 is a factor to adjust the membership degree weighting effect. In this work, we choose m = 2 to reduce the computation time 共the power functions are replaced by squares兲.
1312
S. Belhassen and H. Zaidi: Unsupervised segmentation of heterogeneous tumors in PET
1312
structural features enhancement. It was initially introduced in image processing by Perona and Malik38 to improve the existing linear diffusion processes. The essential peculiarity of this technique is that, unlike linear diffusion processes, it avoids the blurring of the edges and many other localization problems. An important property of ADF is the average graylevel invariance, which allows preserving the average activity within a region. Anisotropic diffusion filtering was used to denoise the images while preserving the contrast. The model can be written as
ut = div共g共储ⵜu储兲 ⵜ u兲,
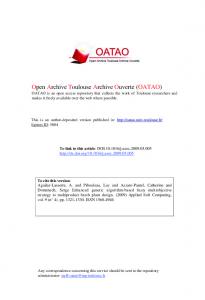
FIG. 2. Top: Representative slice from a PET study of a patient with histologically proven nonsmall-cell lung cancer showing 共a兲 the original PET image, 共b兲 FCM segmented image, and 共c兲 FCM-S segmented image. Bottom: Representative slice from a second clinical PET study showing 共d兲 the FCM segmented image, 共e兲 FCM-S segmented image, and 共f兲 FCM-SW segmented image.
According to Bezdek et al.,36 the resolution of the optimization problem described in Eq. 共1兲 returns to iteratively update the cluster centers and the membership function in accordance with the following equations until the considered algorithm reaches convergence:
兺k=1 umikxk , vi = n 兺k=1 umik n
1ⱕiⱕc
共2兲
and uik =
c
兺 j=1
冉
1 储xk − vi储 储xk − v j储
冊
2/共m−1兲
,
1 ⱕ i ⱕ c,
1 ⱕ k ⱕ n. 共3兲
In this work, we used the algorithm given in Ref. 37, which proved to always converge to local minima or saddle points. In practice, the program is stopped if the convergence error is smaller than 10−3 or 300 iterations are achieved. II.C. Modified FCM classification by incorporation of spatial information „FCM-S…
Among the well known limitations of the classic FCM algorithm is that the classification of each voxel is carried out without consideration of its spatial context 共i.e., independent of its neighborhood兲. As a result, the voxels of the image are classified in noncompact regions 共Fig. 2兲. To incorporate spatial information into the classic FCM algorithm, we add anisotropic diffusion filtered PET data as input to the FCM algorithm 共FCM-S兲. This algorithm is described in the remainder of this section.
共4兲
u共0兲 = u0 ,
where u0 is the original image, u is the smoothed image, ut is the partial derivative of u with respect to diffusion time t, div denotes the divergence operator, 储ⵜu储 is the gradient magnitude of u, and g共储ⵜu储兲 is the diffusivity function. An essential feature of this method is the choice of the diffusivity function g. For a rapidly decreasing diffusivity function g, the resulting image provides stable edges even after a large number of iterations. Only the edges for which the gradient is smaller than a noise threshold parameter are affected. We refer to Ref. 39 for a compelling review of anisotropic diffusion. In the present work, we shall use the following diffusivity function proposed by Weickert39 and given by g共x兲 =
再
1,
xⱕ0
1 − exp共− 3.15/共x/兲4兲, x ⬎ 0,
冎
共5兲
where is the noise threshold, which is appropriately adjusted and computed for the entire image using the noise estimator described by Canny40 and used by Demirkaya41 for the filtering of oncological PET images. For values larger than , this function decreases more rapidly than alternative functions reported in literature, which increases its ability to suppress diffusion near edges. As a result, it achieves better preservation of edge sharpness.39 For the sake of an easy implementation, it is natural to think of a discretization of Eq. 共4兲. A finite difference approach was used to this end.41 We used a Gaussian kernel function 共 = 0.7兲 with kernel sizes of 1 and 10 iterations.38,39 Edge-preserving filters are specifically adapted to the noise characteristics of low count PET images. ADF is a highly efficient method to improve the quality and quantitative accuracy of clinical oncological PET images.41 Figure 3 illustrates the impact of ADF on a clinical PET volume. The results show that the filtering process is able to substantially reduce the noise while keeping the morphological feature details. This entails the importance of exploiting this technique within our framework to improve initially PET image quality. Both the original and filtered PET images are then used as input by our new segmentation algorithm 共see Sec. II C 2 for more details兲. II.C.2. FCM-S algorithm
II.C.1. Anisotropic diffusion filtering „ADF… Nonlinear diffusion is a very powerful tool in image processing. It is widely used to reduce the noise and to perform Medical Physics, Vol. 37, No. 3, March 2010
As discussed above, the original FCM algorithm suffers from sensitivity to noise since it does not make use of spatial information 共or spatial constraints兲 in the objective function
1313
S. Belhassen and H. Zaidi: Unsupervised segmentation of heterogeneous tumors in PET
1313
FIG. 3. Illustration of the level redundant wavelet decomposition of a transaxial slice of the simulated NCAT phantom study with inserted heterogeneous lesion showing 共a兲 the original simulated PET image, 关共b兲–共d兲兴 wavelet scales 1–3, and 共e兲 vertical line profiles through the original image and its wavelet scales. The position of the line profile is also shown. Note that tumor heterogeneity remained visible in the first and second wavelet scales, yet it is toned down in the third wavelet scale and the tumor becomes more homogenous.
optimization step. In other words, the classification of each voxel is independent of its neighborhood. In Ref. 31, the objective FCM function is defined as follows: n
c
n
c
¯ ⴱk − vi储2 , JKang = 兺 兺 共uik兲m储xk − vi储2 + ␣ 兺 兺 共uik兲m储x k=1 i=1
k=1 i=1
共6兲 where xⴱk denotes the intensity of voxels in the adaptive weighted averaging image, ␣ refers to a real constant, and 储 . 储 indicates the Euclidian norm. This modified FCM objective function allows the neighborhood intensity value to influence the optimization process. In this work, we suggest to use ADF in order to drive the optimization of the objective function with prior knowledge about spatial constraints. Consequently, we propose the objective function given in Eq. 共7兲, which incorporates spatial information related to the voxel position in the PET data in a flexible manner, n
c
JFCM-S = 共1 − ␣k兲JFCM + ␣k 兺 兺 共uik兲m储xf k − vi储2 ,
where xf k stands for voxels of the ADF filtered PET image and
1+
冑
1 26
,
1 兺 共xf p − xf k兲2 26 p=1
where the set 兵xf 1 , xf 2 , . . . , xf 26其 denotes the voxel intensity belonging to the 3D window formed by the 26 neighbors of the current voxel xf k. Formally, the FCM-S optimization problem becomes represented in the following form: Medical Physics, Vol. 37, No. 3, March 2010
where U = 共ui,k兲c⫻N, V = 共v1 , . . . , vk兲. In a way similar to the standard FCM algorithm, the objective function JFCM-S can be minimized under the constraint of U, as stated in Eq. 共1兲. By following the same demonstration steps described in Ref. 31, we can show that vi and uik must satisfy the following equality:
兺k=1 umik共共1 − ␣k兲xk + ␣kxf k兲 , vi = n 兺k=1 umik n
1ⱕiⱕc
共9兲
and
uik =
c
兺 j=1
冉
1 共1 − ␣k兲储xk − vi储 + ␣k储xf k − vi储2 共1 − ␣k兲储xk − v j储2 + ␣k储xf k − v j储2 2
冊
1/共m−1兲
,
共7兲
k=1 i=1
␣k =
共8兲
min JFCM-S ,
共U,V兲
1 ⱕ i ⱕ c,
1 ⱕ k ⱕ n.
共10兲
The main objective of using the filtered PET data is to perform the segmentation of the features of interest 共lesion兲 by taking into account the contextual information around the current voxel. The influence of spatial constraints is controlled by the coefficient ␣k. It is dependent on the voxel position with regard to neighborhood homogeneity. Hence, the update of voxel clustering is strongly influenced by its neighborhood when it is inside a homogeneous filtered region and increasingly less influenced when it is close to edges. Figure 2 illustrates the differences between segmentation results when using the conventional FCM algorithm and the FCM-S algorithm using a clinical PET study.
1314
S. Belhassen and H. Zaidi: Unsupervised segmentation of heterogeneous tumors in PET
II.D. FCM-S with the à trous wavelet transform „FCM-SW…
cients must satisfy the following linear and quadratic constraints:
Up to this level, the proposed algorithm still suffers from the incapability to deal properly with lesions in the presence of intensity heterogeneity 共lesions presenting with heterogeneous uptake兲. Among the many mathematical tools available, wavelets and multiscale methods have been widely applied in PET imaging. They have been applied in PET image analysis tasks such as lesion segmentation in clinical oncology.9 In quantitative analysis, multiscale denoising has been applied to postprocess dynamic PET images at the voxel or ROI level. Wavelets have also been incorporated in emission tomographic reconstruction of individual image frames and in spatiotemporal reconstruction of dynamic PET images.42 In the remainder of this section, we describe a novel multiscale methodology that allows the extension of the FCM-S algorithm described above in order to minimize the effect of lesion heterogeneity in typical oncological PET data. This methodology allows the decomposition of the image features into various wavelet scales according to their relevance. A correct selection of the scales to be retained and used as input in the suggested algorithm allows the reduction in lesion heterogeneity put into perspective in the smallest scales 共Fig. 3兲.
II.D.1. The à trous wavelet transform „AWT… Wavelets are powerful mathematical tools for analysis of finite, nonperiodic, and/or nonstationary signals. Wavelet transforms differ from traditional Fourier transforms by their inherent ability of localizing information in the timefrequency domain. The wavelet transform allows the decomposition of a signal with finite energy into multiple scales, each one having a different degree of resolution. II.D.1.a. The discrete wavelet transform. In the wavelet analysis, unlike Fourier analysis, we analyze signals using wavelet functions. Translations and dilations of the “analyzing wavelet” ⌽共x兲, define the wavelet basis as ⌽共s,l兲共x兲 = 2−s/2⌽共2−sx − l兲,
共11兲
where s is the scale index that indicates the wavelet’s width and the location index l gives its position. The wavelets are generated by scaling and dilating the analyzing wavelet ⌽. The self-similarity caused by the scales and dilatations makes wavelet bases particularly attractive. Consequently, if the analyzing wavelet is known, it is possible to know everything about the basis. The scaling function ⌿ associated with the analyzing wavelet ⌽ is defined according to the following equation: N−2
⌿共x兲 =
兺 共− 1兲 ck+1⌽共2x + k兲, k
共12兲
k=−1
where ck are the wavelet coefficients. The wavelet coeffiMedical Physics, Vol. 37, No. 3, March 2010
1314
N−1
兺 k=0
N−1
ck = 2,
ckck+2l = 2␦l,0 , 兺 k=0
where ␦ is the delta function and l is the location index. The most important dissimilarity between Fourier and wavelet transforms is that individual wavelet functions are localized in space. This wavelet’s localization of frequency makes many functions, transformed into the wavelet domain, “sparse.” A number of applications such as contour detection on digital images, noise removal, and data compression are derived from this sparseness property. II.D.1.b. The à trous wavelet decomposition. Several algorithms were proposed in literature for discretization of the wavelet transform.43–45 In this work, we adopt the à trous 共with holes兲 algorithm,46 which was considered to be the most relevant for this particular application for the following reasons:47 共1兲 The transform is known in any point, which makes it possible to ensure detection without interpolation. 共2兲 The dimension of the transformed image remains similar to the original image. 共3兲 The wavelet transform is known in any point, which excludes the interpolation process. 共4兲 We operate in the direct space, thus avoiding typical artifacts introduced by the periodization. 共5兲 The algorithm is easy to implement in the form of a computer code. 共6兲 The required memory size is low. 共7兲 The computing time is reasonable. One should note, however, that the à trous wavelet transform is nonorthogonal and thus redundant, making the choice of the scale difficult. However, as opposed to the standard wavelet transform method, this transform is isotropic, and as such, it performs considerably better at high noise levels. This is the motive for its successful application on noisy functional PET images where the targets 共lesions兲 are diffuse in a highly active background.9 We have investigated other forms of wavelets reported in literature as being well adapted for medical image segmentation 共e.g., biorthogonal wavelets兲 but obtained poor results compared to the form of wavelets selected in this work given that they did not handle appropriately tumor heterogeneity. The associated “analyzing wavelet” is defined as the difference between the scaling functions of two successive scales as described by the following equation:
冉冊
冉冊
1 1 x x ⌽ = ⌿共x兲 − ⌿ . 2 2 2 2
共13兲
The third degree B-spline with filter coefficients 1 1 3 1 1 h = 兵 16 , 4 , 8 , 4 , 16 其 is the scaling function adopted in this work owing to its powerful interpolation properties. The associated analyzing wavelet 共or mother function兲 resembles a Mexican hat function with a central peak and negative side
1315
S. Belhassen and H. Zaidi: Unsupervised segmentation of heterogeneous tumors in PET
lobes. In Ref. 47, the authors provided an elegant algorithm for computation of the associated wavelet transform. In Ref. 9, the 1D à trous wavelet decomposition was extended into three dimensions using a 3D nonseparable convolution. An illustration of the four-level redundant wavelet decomposition is depicted in Fig. 3. It is apparent that in the first scale only the thin and tiny details 共typically edges兲 are extracted. In the second scale, the more assertive details are kept and so on. In the case of the nonorthogonal à trous wavelet, the signal-to-noise ratio increases toward the coarser scales, the noise being mainly concentrated at the finer scales. In previous studies, the scale selection technique used was not identified. In our previous contribution,9 the first and the second scales are used in the Markov random field segmentation under the assumption that the majority of image details are localized within these scales and the rest of scales are rejected. In Ref. 48, midlevel wavelet scales are used, where the highest and lowest wavelet scales are rejected. The first scale is ignored under the assumption that the majority of image noise is localized within this scale. The residual wavelet scale is ignored as it contains averaging coefficients with high numerical values which if processed can lead to overly smooth segmentation. It should be noted that the selection of resolution scales is lesion size dependent. This is achieved by applying FCM segmentation to provide a rough estimate of the lesion size, which is then used as a priori information for selection of the appropriate scale by the FCM-SW algorithm, as detailed below.
II.D.2. The FCM-SW algorithm As discussed earlier, the FCM-S algorithm is not able to deal with intensity heterogeneity. In this section, we describe how the à trous wavelet transform is incorporated in the proposed FCM-S algorithm to improve its effectiveness for the quantitation of heterogeneous lesions. To this end, we propose the objective function described in Eq. 共14兲, which incorporates in a supple manner the à trous wavelet transform of PET data,
兺k=1 umik共共1 − ␣k兲xk + ␣kxf k兲 , vi = n 兺k=1 umik
兺k=1 umikxwk ti = , n 兺k=1 umik
n
n
1315 c
JFCM-SW = JFCM-S + k 兺 兺 共uik兲m储xwk − ti储2 ,
共14兲
k=1 i=1
where xwk is the à trous wavelet transform of xk, ti 苸 R p共1 ⱕ i ⱕ c兲 stands for the cluster centers of the à trous wavelet transformed data, and
k =
冦
xwk max xwk
if
1ⱕkⱕn
0
xwk ⬎ max xwk
1ⱕkⱕn
if
xwk ⱕ , max xwk
1ⱕkⱕn
冧
where and represent two real constants set by the trialand-error technique, which is well established for solving problems where there are multiple chances to obtain the correct solution. These values were chosen 共 = 3 and = 0.36兲 in such a way that the influence of the wavelet filtered image remains the most important for most regions of the image presenting with high tracer uptake. The parameter xwk has a large value in a PET tumor region. Since the aim of using the wavelet analysis is the reduction in tumor heterogeneity, the k expression is chosen so that it carries a greater influence on the objective function for large values of xwk. Here, controls the strength of the wavelet transform influence and represents the threshold from which the wavelet transformed data are allowed to influence the objective function and hence the segmentation result. Formally, the FCM-SW optimization problem takes the following form: 共15兲
min JFCM-SW ,
共U,V,T兲
where U = 共ui,k兲c⫻N, V = 共v1 , . . . , vk兲, and T = 共t1 , . . . , tk兲. In a way similar to the standard FCM algorithm, the objective function JFCM-SW can be minimized under the constraint of U, as stated in Eq. 共1兲. By following the same demonstration steps described in Ref. 31, we can show that vi, ti, and uik must satisfy the following equality with small modifications:
n
1ⱕiⱕc
共16兲
and
uik =
c
兺 j=1
冉
1 共1 − ␣k兲储xk − vi储 + ␣k储xf k − vi储2 + k储xwk − ti储2 共1 − ␣k兲储xk − v j储2 + ␣k储xf k − v j储2 + k储xwk − t j储2 2
Medical Physics, Vol. 37, No. 3, March 2010
冊
1/共m−1兲
,
1 ⱕ i ⱕ c,
1 ⱕ k ⱕ n.
共17兲
1316
S. Belhassen and H. Zaidi: Unsupervised segmentation of heterogeneous tumors in PET
where k is the Lagrangian multiplier. We then take the partial derivatives of Fm with respect to each of the two independent variables, uik and k, set each equation to zero, and then solve them simultaneously, Fm = 0 ⇔ 共1 − ␣k兲m共uik兲m−1储xk − vi储2 + ␣km共uik兲m−1 uik
Following the derivation given in Ref. 31, we can solve the constraint optimization problem defined in Eq. 共15兲 by using the Lagrange multiplier method where the objective function is defined by Eq. 共14兲. The combination of the objective function to be optimized with the constraint yields
⫻储xf k − vi储2 + km共uik兲m−1储xwk − ti储2 − k = 0,
c
n
共19兲
Fm = JFCM-S + k 兺 兺 共uik兲m储xwk − ti储2 n
k=1 i=1
冉
c
c
冊
+ 兺 k 1 − 兺 uik , k=1
uik =
冉
i=1
Fm = 0 ⇔ 兺 uik − 1 = 0. k i=1
共18兲
k m
k 2 m共共1 − ␣k兲储xk − vi储 + ␣k储xf k − vi储2 + k储xwk − ti储2兲
兺冉
1/共m−1兲 c
i=1
共20兲
From Eq. 共19兲, we get
冊
1/共m−1兲
By substituting Eq. 共21兲 into Eq. 共20兲, we obtain
冉冊
1316
1 2 共1 − ␣k兲储xk − vi储 + ␣k储xf k − vi储2 + k储xwk − ti储2
共21兲
.
冊
1/共m−1兲
= 1.
共22兲
.
共23兲
Consequently,
冉冊 k m
1/共m−1兲
=
1 c
共共1 − ␣k兲储xk − vi储 兺 i=1
2
+ ␣k储xf k − vi储 + k储xwk − ti储 兲 2
By substituting Eq. 共23兲 into Eq. 共21兲, we obtain Eq. 共17兲. In the same way, taking the partial derivatives of Fm with respect to each of the two independent variables vi and ti yields Eq. 共16兲. This achieves the proof. In this study, the wavelet à trous transformed image is used in conjunction with the original and filtered images in the JFCM-SW objective function. The goal of its use is to minimize the effect of the intensity heterogeneity within the lesion. Given that the first, second, and third scales contain the fine to rough lesion details, respectively, we select the appropriate wavelet scale to use, depending on a priori knowledge about the lesion size 共as approximated by the classic FCM兲. Otherwise, the scale label increases according to the lesion size. The remaining scales are rejected since they contain only useless coarse information. The influence of the wavelet on the voxel clustering update is controlled by k coefficients. In addition, its influence on the objective function is strong when the current voxel is inside the tumor region. However, its classification is not influenced by the use of the à trous wavelet transform outside the tumor region. Consequently, the loss of important details owing to its use does not affect, to a great extent, the quality of the segmentation results. Medical Physics, Vol. 37, No. 3, March 2010
2 −1/共m−1兲
II.E. Performance evaluation of the proposed algorithm
II.E.1. NCAT phantom simulation study To illustrate the idea behind the use of wavelet analysis, a simulated PET study of the NCAT phantom49 modified to incorporate large heterogeneous lesions of different size in the right lung was performed 共Fig. 4兲. The activity distribution used in this simulation study was derived from the typical 18F-FDG biodistribution found in normal subjects.50 3D images of heterogeneous tumors were simulated based on observations of clinical whole-body PET images. A voxelby-voxel ground truth was therefore available for accurate computation of voxel classification or volume errors. These heterogeneous tumors were then transformed into the NCAT phantom. Realistic PET projection data were generated to which Poisson noise was added and subsequently PET images were reconstructed. The relative error 共%兲 is defined as the difference between the calculated and the actual volumes divided by the true volume. Classification errors 共CEs兲 were then computed on a voxel-by-voxel basis using the following formulation:11
1317
S. Belhassen and H. Zaidi: Unsupervised segmentation of heterogeneous tumors in PET
FIG. 4. 共a兲 Reconstructed slice of the simulated NCAT phantom with inserted large heterogeneous lesion 共volume= 53.07 ml兲. 共b兲 Binary map of the inserted heterogeneous lesion with SUV varying between 6.5 and 10, i.e., SUV苸 兵6.5, 7 , 9.5, 10其. 共c兲 The binary results of the segmented tumor estimated by FCM, FCM-S, and FCM-SW algorithms, respectively, are also shown.
CE =
共PCE + NCE兲 ⫻ 100%, VoIL
共24兲
where PCE refers to the positive classification errors, including voxels of the background that are classified as belonging to the tumor, NCE refers to negative classification errors, including voxels of the tumor that are classified as belonging to the background, and VoIL is the number of voxels defining the inserted lesion in the NCAT phantom 共the actual number of voxels reflecting the ground truth兲. It was observed that tumor heterogeneity remained visible in the first and second wavelet scales. Nevertheless, it is toned down in the third wavelet scale 关see Figs. 3共d兲 and 3共e兲兴 and the tumor becomes more homogeneous. Consequently, if only the third wavelet scale is used, all tumor region voxels will be assigned to the same cluster representing the class with the highest intensity and thus the highest FCM classification label. II.E.2. Clinical PET/CT studies Twenty-one patients with histologically proven NSCLC 共clinical stages Ib-IIIb兲 from the MAASTRO database51 who have undertaken a diagnostic whole-body PET/CT scan on the Biograph SOMATOM Sensation 16 equipped with an ECAT ACCEL PET scanner 共Siemens Medical Solutions, Erlangen, Germany兲 were used for assessment of the proposed segmentation technique. Patients fasted no less than 6 h before PET/CT scanning. The standard protocol involved intravenous injection of 18F-FDG, followed by a physiologic saline 共10 ml兲. The injected FDG activity was adjusted according to patient’s weight using the following formula: A共MBq兲 = weight⫻ 4 + 20. After 45 min uptake time, freebreathing PET and CT images were acquired. A topogram was first acquired from the skull to the upper region of the legs to allow defining the axial field of view for scanning. This was followed by a diagnostic quality contrastenhanced spiral CT scan. PET scans covering an axial field of view corresponding to seven bed positions with overlap were acquired in 5 min/bed position. CT-based attenuation Medical Physics, Vol. 37, No. 3, March 2010
1317
correction of the corresponding PET data was performed. Following Fourier rebinning and model-based scatter correction, PET images were reconstructed using 2D iterative normalized attenuation-weighted ordered subsets expectation maximization 共NAW-OSEM兲. The default parameters used in clinical routine were applied, followed by a postprocessing Gaussian filter. The voxel size was set to 5.3⫻ 5.3 ⫻ 5 mm3. The second set of clinical data sets used for validation of the proposed algorithm consists of seven patients with T3–T4 laryngeal squamous cell carcinoma 共LSCC兲 from the Louvain database52 that underwent an FDG-PET study prior to treatment.53 The patients were immobilized with a tailored thermoplastic mask 共Sinmed®, Reeuwijk, The Netherlands兲 attached to a flat tabletop to avoid neck motion during scanning. A preinjection transmission scan 共10 min兲 was acquired prior to intravenous injection of 185–370 MBq of FDG which was followed by a 60 min dynamic 3D PET emission scan on the ECAT Exact HR camera 共CTI/Siemens, Knoxville, USA兲. PET data were reconstructed using a 3D AW-OSEM algorithm 共4 subsets and 8 iterations兲 following correction for dead time, randoms, scatter, attenuation, and radioactive decay. Patients have undertaken a total laryngectomy few days 共5 days average兲 following the PET study. The macroscopic tumor specimen was gathered, frozen, and cut into 1.7–2-mmthick slices. The 3D specimen was reconstructed following digitization and realignment of the obtained thin slices taking also into account lost material during the slicing. A semiautomated rigid-body registration algorithm54 was then used to coregister the PET and macroscopic surgical specimen images. The last step consisted of creating the fully 3D macroscopic tumor volume by delineating separately on each slice the macroscopic tumor extension. The obtained volume served as the ground truth for evaluation of the proposed PET segmentation technique. III. RESULTS III.A. Simulated phantom study
As mentioned in earlier studies, the number of clusters was initialized based on the BIC. It is evident that the number of considered clusters might change when the heterogeneity is removed. For example, for the simulated PET study shown in Fig. 4, the optimal number of clusters is 7. However, when the wavelet transform is applied, the two highest clusters are merged, thanks to the high degree of homogeneity achieved by the use of wavelets 共the inhomogeneity is eliminated in the first and second scales兲. The consequence is that the number of clusters decreases by 1. Furthermore, if the tumor area is homogeneous or more heterogeneous 共contains more than two clusters兲, it is expected that the optimal number of clusters might change in an unpredictable way. For this reason, we show using the same study in Table I that the adopted strategy allows by strongly incorporating wavelets only inside the tumor region to make tumor volume quantification only slightly influenced by the considered
1318
S. Belhassen and H. Zaidi: Unsupervised segmentation of heterogeneous tumors in PET
1318
TABLE I. Comparison of the estimated volumes 共in ml兲, relative volume, and classification errors 共in %兲 between the actual 共53.07 ml兲 and the calculated volumes of the heterogeneous simulated lesion in the NCAT phantom for various cluster numbers using the FCM-SW segmentation algorithm. The relative volume error is defined as the difference between the calculated and the actual volume divided by the actual volume. CEs are computed on a voxel-by-voxel basis using Eq. 共18兲.
Cluster number
Estimated volume 共ml兲
Volume error 共%兲
Classification error 共%兲
5 6 7
52.70 52.45 52.30
⫺0.70 ⫺1.11 ⫺1.45
2.87 3.10 3.33
cluster number. In this case, the relative volume difference resulting from the use of seven instead of six clusters is only 0.28%. Table II summarizes the comparative assessment of the estimated volumes, and volume and classification errors between the actual and the calculated volumes for the three heterogeneous lesions inserted in the NCAT phantom corresponding to the pattern shown in Fig. 4 for FCM, FCM-S, and FCM-SW PET image segmentation techniques. The results are shown in the case of the FCM-SW technique involving the use of scale 2 or scale 3, depending on the lesion size as estimated by the classic FCM technique. The motivation behind is that based on interpretations of the phantom experiments, it was observed that the second wavelet scale is more suitable for accurate quantification of small volumes, whereas the third wavelet scale is more suitable for accurate quantification of large volumes. TABLE II. Comparison of the estimated volumes 共in ml兲 and relative volume and classification errors 共in %兲 between the actual and the calculated volumes of the heterogeneous simulated lesion in the NCAT phantom using the three PET image segmentation algorithms evaluated in this study, namely, FCM, FCM-S, and FCM-SW. Three lesions of different sizes corresponding to the pattern shown in Fig. 4 were simulated. The relative volume error is defined as the difference between the calculated and the actual volume divided by the actual volume. CEs are computed on a voxel-by-voxel basis using Eq. 共18兲.
Estimated volume Volume error Segmentation technique 共ml兲 共%兲
Classification error 共%兲
Actual volume 共ml兲 FCM FCM-S FCM-SW
8.33 8.51 34.66
37.62 ⫺77.85 ⫺77.73 ⫺7.97
77.85 77.37 9.81
Actual volume 共ml兲 FCM FCM-S FCM-SW
10.24 10.18 52.30
53.07 ⫺80.70 ⫺80.82 ⫺1.45
80.67 80.79 3.33
Actual volume 共ml兲 FCM FCM-S FCM-SW
7.81 7.96 67.29
64.69 ⫺87.92 ⫺87.69 4.01
87.64 87.5 5.89
Medical Physics, Vol. 37, No. 3, March 2010
FIG. 5. Representative clinical FDG-PET image segmentation results of a 9 cm maximal diameter lesion through the y-axis showing the contours defined on the PET 共left兲 and fused PET/CT 共right兲 images by the segmented volumes obtained using the various techniques identified by different colors, namely FCM, FCM-S and FCM-SW. The estimated maximal diameters demonstrate the better performance of FCM-SW PET image segmentation technique 共9 cm兲 which more closely matches the macroscopic examination of the surgical specimen.
Phantom experiments have demonstrated that the classic FCM technique underestimates significantly the volumes of the small lesions 共results not shown兲. This was expected given that the approach uses voxel intensity as the sole discrimination criteria without taking into account the spatial location and neighborhood information. It is evident that the standard FCM technique tends to underestimate lesion volumes. This tendency is reversed following the inclusion of spatial information in the FCM algorithm 共FCM-S兲. The proposed algorithm incorporating the wavelet transform to reduce the effect of lesion inhomogeneity provides a better estimate of the actual lesion volume. The volume error decreased from 77.85% to 7.97% for the smallest lesion and from 87.92% to 4.01% for the largest lesion. More importantly, the technique allows a substantial reduction in the classification error from 77.85% to 9.81% for the smallest lesion and from 87.64% to 5.89% for the largest lesion. III.B. Clinical studies
As described in Sec. II E 2, clinical PET/CT data that consist of 21 patients presenting with histologically proven NSCLC where the maximal tumor diameters measured from the macroscopic examination of the surgical specimen served as gold standard were used.51 The thoracic slices containing the lesion were extracted from the whole-body PET volumes. Figure 5 shows a representative slice of a clinical study, showing an FDG-PET image of a patient presenting with a 9 cm maximal diameter lesion through the y axis located on the right lung. FCM segmentation underestimated the lung tumor size by 5.5%, resulting in a measured maximal diameter of 8.5 cm. The inclusion of spatial information 共FCM-S兲 overestimates the maximum diameter 共10 cm兲; however, given the inhomogeneity of the tracer uptake, the proposed FCM-SW technique is noticeably the best approach to the problem, allowing to correctly estimate the maximal diameter in this case 共9 cm兲. Another example is illustrated in Fig. 6 for a lesion with complex shape presenting with a 7 cm maximal diameter through the z axis. Similar to the results presented in the previous figure, FCM significantly underestimates the tumor
1319
S. Belhassen and H. Zaidi: Unsupervised segmentation of heterogeneous tumors in PET
FIG. 6. Representative clinical FDG-PET image segmentation results of a 7 cm maximal diameter lesion through the z-axis showing 共a兲 the original image, 共b兲 FCM segmentation 共4.77 cm兲, 共c兲 FCM-S segmentation 共5.49 cm兲, 共d兲 scale 1 of wavelet à trous transform, 共e兲 scale 2 of wavelet à trous transform, and 共f兲 FCM-SW segmentation 共6.48 cm兲. The segmented volumes obtained using the various techniques are identified by different colors, namely, FCM, FCM-S, and FCM-SW. The estimated maximal diameters demonstrate the better performance of FCM-SW PET image segmentation technique which more closely matches the macroscopic examination of the surgical specimen.
size 共⫺31.9%兲, which was reduced to ⫺7.4% when using the proposed FCM-SW approach. The analysis of the individual wavelet scales demonstrated that the third scale of the wavelet à trous transform is the most contributive to our segmentation approach for both clinical cases. For almost all clinical PET studies included in this work, the estimated maximal diameters demonstrate the better performance of the FCM-SW PET image segmentation technique which more closely matched the macroscopic examination of the surgical specimen. Besides, this tumor presents a high level of heterogeneity. For this reason, both FCM and FCM-S algorithms fail to provide the correct tumor volume 共see red and cyan contours in Fig. 6兲. On the contrary, the FCM-SW algorithm succeeds to approximately delineate the correct maximal diameter 共and visually the likely shape兲 of tumor volume. Figure 7 shows a linear regression plot illustrating the correlation between maximal diameters estimated using the 3 PET segmentation procedures and actual maximal diameter
1319
of primary lung tumors measured from the macroscopic examination of the surgical specimen. The solid line connecting the data points represents the result of a linear regression analysis, whereas the dashed line represents the identity line. There is a good correlation 共R2 = 0.942兲 between the actual maximal diameter of primary lung tumors estimated using the FCM-SW PET segmentation procedure and the measured diameters from the macroscopic examination, and the regression line agreed well with the line of identity 共slope= 1.08兲 for the group analysis of the 21 patient data. Overall, the dispersion of data points is insignificant and the general trend, as shown by the regression line, is that the coefficients of variations are similar. However, FCM-SW PET segmentation leads to higher overall estimates than those measured from the macroscopic examination. This is in agreement with the results obtained on phantom studies. The proposed technique clearly outperformed the FCM and FCM-S approaches, thus allowing improvement of the correlation and achievement of a slope closer to the identity line. Moreover, poorer correlation 共R2 = 0.82兲 was obtained using the adaptive thresholding technique51 as well as the manual delineation performed by experienced radiation oncologist both on PET and CT studies55 when applied to the same data sets. Figure 8 illustrates the means and standard deviations of the relative differences between the actual maximal diameters of primary lung tumors measured from the macroscopic examination of the surgical specimen and the estimated maximal diameter resulting from the three PET segmentation procedures. The standard FCM algorithm seems to underestimate actual maximal diameters of clinical data, resulting in a mean error of ⫺4.6 mm 共relative error of −10.8⫾ 23.1%兲 for all data sets. The mean error of maximal diameter estimation across the whole population of patients was reduced to 0.1 mm 共mean relative error of 0.9⫾ 14.4%兲 using the proposed FCM-SW technique. One should note that the standard deviation is toned down by 37.7%. By far, the proposed technique seems to be the best approach for tumor quantifi-
FIG. 7. Correlation plots between actual maximal diameter of primary lung tumors measured from the macroscopic examination of the surgical specimen 共abscissa兲 and maximal diameter estimated using the three PET segmentation procedures 共ordinate兲: 共a兲 Classic FCM, 共b兲 the FCM-S, and 共c兲 the FCM-SW. 21 data points resulting from the analysis of the 21 patients studied are shown together with best fit equations and correlation coefficients. The solid and dashed lines represent the linear regression line and the reference 共identity兲 line, respectively. Medical Physics, Vol. 37, No. 3, March 2010
1320
S. Belhassen and H. Zaidi: Unsupervised segmentation of heterogeneous tumors in PET
FIG. 8. Box and whisker plots showing relative differences between actual maximal diameter of primary lung tumors measured from the macroscopic examination of the surgical specimen and estimated maximal diameter resulting from the three PET segmentation procedures: FCM, FCM-S, and FCM-SW. Means and standard deviations are shown for the 21 patients studied.
cation, which also resulted in the smallest standard deviation compared to other techniques assessed in this work. This approach finds a good compromise by combining the two aforementioned methodologies. The clinical studies showed significant improvement of the segmented lesions using the proposed approach compared to the standard FCM algorithm, particularly for lesions presenting with inhomogeneous tracer uptake 共Fig. 9兲. Figure 10 shows a representative slice of a clinical study showing an FDG-PET image of a patient presenting with a LSCC lesion of inhomogeneous tracer uptake of 30.6 cc of volume as assessed by histology. Both FCM and FCM-S segmentation underestimated the tumor size by 33.7% and 34%, resulting in measured volumes of 20.2 and 20.3 cc, respectively. The proposed FCM-SW algorithm allows the achievement of a more accurate estimate of the lesion volume 共24.6 cc兲 thus decreasing the relative error to ⫺19.6%. Figure 11共a兲 shows the comparison of mean absolute LSCC tumor volumes for seven patients, where the FCM-SW segmentation technique was able to adequately delineate the tumor volumes. Error bars indicate SD on the mean. Overall, this technique yielded similar volumes 共14.6⫾ 8.5 cc兲 relative to those derived from the macroscopic specimen 共14.8⫾ 10.4 cc兲. The mean relative error
FIG. 9. Illustration of differences in target volume definition on a highly heterogeneous tumor on 共from left to right兲 a transaxial slice of an FDGPET study, the corresponding CT, and fused PET/CT. Note the geographical mismatch between the three segmentation techniques and how the FCM-S and FCM-SW handle the heterogeneity of tracer uptake. Medical Physics, Vol. 37, No. 3, March 2010
1320
FIG. 10. Representative clinical FDG-PET image segmentation results of a 30.6 cc lesion showing the contours delineated on the macroscopic examination of the surgical specimen and those defined by the three segmentation algorithms which are identified by different colors, namely, FCM, FCM-S, and FCM-SW. The estimated volumes demonstrate the better agreement of FCM-SW with the histology.
on the estimated volume was reduced from 21.7⫾ 22.0% for FCM to 8.6⫾ 28.3% using the proposed FCM-SW technique 关Fig. 11共b兲兴. The obtained results seem to indicate that the tumor volumes obtained by the fully automated PET segmentation technique appear to be slightly lower overall than
FIG. 11. 共a兲 Comparison of mean LSCC tumor volumes for the seven patients assessed. 共b兲 Box and whisker plots showing relative differences between the actual volumes of head and neck tumors measured from the 3D macroscopic examination of the surgical specimen and the estimated volumes resulting from the three PET segmentation procedures: FCM, FCM-S, and FCM-SW. Means and standard deviations are shown for the seven patients studied.
1321
S. Belhassen and H. Zaidi: Unsupervised segmentation of heterogeneous tumors in PET
the actual volumes obtained from the macroscopic specimen. Moreover, the macroscopic LSCC specimens were only partially encompassed by the three segmentation techniques evaluated in this work. IV. DISCUSSION The introduction of modern dual-modality PET/CT scanners equipped with flat-panel tabletop and external room lasers in the scanner room made a “one-stop-shop,” providing diagnostic PET/CT and radiation therapy planning CT scan in only one session possible. This added capability is now being exploited routinely in many institutions worldwide,56 thus enabling to improve GTV definition, which is traditionally identified on CT simulation images in routine radiation therapy. One of the challenges facing PET-based radiation therapy treatment planning is the accurate delineation of target volumes from characteristic noisy functional images.3 The major problem encountered in functional volume delineation is compounded by the inherent complexity of image segmentation and imperfect system response function.56 Accurate target volume delineation plays a pivotal role in radiation therapy treatment planning since it constrains the selection of the optimal radiation beam geometry and their respective weights. Under- or overdosing might lead to cancer recurrence or severe side effects to the surrounding normal organs and tissues, respectively. Following the wide adoption of combined PET/CT systems for clinical use around the world and the popularity of PET-based radiation therapy treatment planning which allows the incorporation of PET metabolic information, a large variety of techniques have been proposed and used with various degrees of success for target volume delineation over the past decade.4 It should be emphasized that PET quantification of lesion volumes also plays a critical role in clinical diagnosis and assessment of response to therapy.5 Within the framework of medical image segmentation, it has been argued that knowledgeable humans or experienced radiologists usually outperform computer algorithms in the high-level task of tumor recognition. This is the motivation behind the use of manual image segmentation techniques as gold standard to validate computerized image segmentation techniques. However, recent research efforts showed that carefully designed algorithms might outperform humans in the precise, accurate, and efficient delineation of target volumes.4 For obvious reasons, human delineation that cannot account for graded object composition, originating from high statistical noise, natural lesion heterogeneity, and various artifacts resulting from physical degrading factors such as partial volume effects, is prone to error. Likewise, the methodology suffers from high intra- and intersubject variability, owing to various window level settings used by different operators. The above discussed limitations spurred the development of semiautomated and unsupervised PET image segmentation approaches.4,6–8 Semiautomated methods fall under the category of user-assisted techniques that require different degrees of operator assistance and interaction for each image to Medical Physics, Vol. 37, No. 3, March 2010
1321
be segmented. It should be noted that the degree of human interaction in these techniques might be limited to specifying just a point inside the lesion or on its boundary as required, for instance, by region growing methods.57 Calibration is another mandatory step which should be distinguished from the interaction with the operator. It is indeed an essential step for any PET segmentation algorithm as it allows the parameters of the segmentation method to be adjusted with respect to the image resolution. The degree and amount of work required for calibration of some semiautomated techniques, such as the popular signal-to-background ratio 共SBR兲-based adaptive thresholding technique,58 might be cumbersome for clinical routine applications.8 This includes manual delineation of the global volume of interest containing the lesion and delineation of regions in the background in addition to the requirement for experimental derivation of PET scanner and image acquisition and processing protocol-dependent curves using various SBRs. Most of the challenges in completely automating image segmentation algorithms may be attributed to the weaknesses in computerized recognition techniques and to the lack of delineation techniques that can handle the complexity of the image formation process and the complex pathophysiology of cancer as well as the inherent tendency of voxels to hang together in space 共as a fuzzy cloud兲 as a result of this complexity.59 Fuzzy segmentation techniques demonstrated excellent performance and produced good results as an automated, unsupervised tool for segmenting noisy images in a robust manner. In this study, we have modified the popular FCM algorithm, which proved to have potential for the task of PET image segmentation24,25 but many shortcomings if applied without any additional constraints.11,26 To overcome the above described limitations of the FCM algorithm, a new fuzzy segmentation technique based on the standard FCM algorithm and adapted to typical oncological PET data was proposed in this work. PET images smoothed using a nonlinear anisotropic diffusion filter38 are added as a second input to the proposed FCM algorithm to conduct the objective function optimization with priori knowledge about spatial constraints, thus incorporating spatial information in the segmentation process. In addition, a methodology was developed to integrate the à trous wavelet transform in the modified FCM algorithm to allow handling of heterogeneous lesion’s uptake. Recently, other variations of clustering techniques were used for unsupervised lesion segmentation operating on dynamic PET images based on time-activity curve 共TAC兲 shape differences between malignant and healthy tissues.60 The TAC slope values were K-means clustered into two clusters for lesion segmentation. Various approaches were adopted to validate PET image segmentation approaches in a clinical setting.4 The most popular being the use of experimental or simulated phantom studies and the comparison of PET segmentation results with correlated anatomical GTVs defined on CT or MRI. However, there are many reasons to believe that CT-based GTV delineation is not a reliable gauge of the accuracy achieved by PET-based GTV.3,56 This motivated us to use both phan-
1322
S. Belhassen and H. Zaidi: Unsupervised segmentation of heterogeneous tumors in PET
tom studies and clinical PET/CT data consisting of patients presenting with histologically proven NSCLC where the maximal tumor diameters measured from the macroscopic examination of the surgical specimen served as gold standard.51 It is apparent from phantom studies 共results not shown兲 that the exploitation of the standard FCM algorithm significantly underestimates lesion volumes particularly for the smallest lesions. The relative error was substantially reduced, following the incorporation of the spatial information. Overall, the mean relative error and standard deviation were minimal when using our proposed approach combined with the second or third wavelet scale 共depending on lesion size兲. The method worked relatively well on the simulated NCAT phantom presenting with a nonuniform-target/uniformbackground and the results seem also to be good on clinical studies. Some investigators argued that the accuracy obtained on phantom studies is not necessarily representative of what can be achieved in clinical studies and that some techniques which do not perform well on simple phantoms consisting of spherical inserts might work well when using clinical data and vice versa.61 Therefore, if we follow the trend of the most popular PET-based GTV delineation procedures which rely on phantom-based calibration procedures to tune the parameters of the algorithm so that they fit the phantom,4 the method might fail when applied to realistic clinical cases.62 A detailed investigation was carried out to determine qualitative improvements and investigate quantitatively correlations and statistically significant differences between the maximal diameters of NSCLC lesions resulting from segmented PET volumes as compared to maximal diameters measured by the macroscopic examination of the surgical specimen. The correlation coefficient across the whole population of patients 共R2 = 0.942兲 was significantly improved 共p ⬍ 0.05兲 and the regression line agreed well with the line of identity when using the proposed FCM-SW algorithm, compared to both standard FCM and FCM-S techniques 共Fig. 7兲. Moreover, the mean error of maximal diameter estimation was reduced to 0.1 mm 共0.9⫾ 14.4%兲 using the proposed FCM-SW technique 共Fig. 8兲. According to these results, the maximal diameters obtained by the unsupervised PET-based segmentation technique appear to be slightly higher overall than actual diameters obtained from the macroscopic specimen. Moreover, our analysis suggests that the intercept in the regression line is significantly different from zero. Compared to other techniques reported in literature, the proposed approach is promising, and hence is a good candidate to replace conventional manual and semi automated methods.55 The validation of novel segmentation algorithms using clinical PET/CT data of NSCLC patients is likely not the best approach to follow, owing to the presence of respiratory motion. However, except a small number of academic sites with advanced physics support, very few facilities are using clinical protocols involving respiratory gating for routine studies. The MAASTRO database was actually a good sample that matched partially our needs in terms of availability of surgical specimen for validation purposes. One word of Medical Physics, Vol. 37, No. 3, March 2010
1322
caution is worth mentioning given the limitations of the evaluation performed in this study. The comparative assessment was carried out on the basis of maximal diameters measured from the macroscopic specimen as sole information available to us. However, the conclusions drawn might not necessarily reflect the performance that would be achieved when the 3D GTV is considered. A more reliable approach would be to compare the PET segmented volume to the actual tumor volume for those patients that had a PET scan prior to surgery for lesion resection. So far, very few studies reported on the collection of such data and their use for this task which underlines the complexity of the procedure.52,63 Therefore, despite the limited number of patients available, the Louvain database provided the opportunity to further assess the performance of the proposed technique in a clinical setting taking advantage of the availability of the full 3D macroscopic tumor volume serving as the “ground truth” for comparison with the corresponding PET-based volume. Overall, the proposed FCM-SW technique yielded similar volumes 共14.6⫾ 8.5 cc兲 relative to those derived from the 3D macroscopic specimen 共14.8⫾ 10.4 cc兲. In addition, the mean relative error on the estimated volume was substantially reduced 共down to 8.6%兲 using the proposed algorithm compared to 21.7% achieved by conventional clustering techniques. In summary, the developed algorithm provides a useful mechanism for quantifying primary lesions and secondary metastases in image regions depicting high levels of tracer inhomogeneity. The primary objective stimulating the development of this algorithm is to aid target volume delineation in PET/CT-based radiation therapy treatment planning. The technique can also potentially be used to automate the SUV quantification procedure and to provide further guidance in tracking tumor volume change to assess the response to therapy, thus allowing to alleviate the difficult timeconsuming manual procedures used in the clinic. In addition, it might be useful for the more challenging case of crossplatform data analysis in multicenter clinical trials to accurately assess the temporal evolution of functional tumor volume and metabolic activity where the conditions of contrast, noise, and heterogeneity of uptake or lesion size become more demanding. There are still opportunities to further refine the algorithm. It is plausible that accurate modeling of the actual noise distribution in the images within the segmentation task can produce substantial improvements. While methodology has been developed in literature to estimate the noise distribution in the reconstructed images, including for the now common statistical, iterative image reconstruction techniques,42 such accurate noise modeling remains to be studied for image segmentation tasks. To further optimize the scale selection procedure, we are investigating potential correlations between the wavelet scales and physical and physiological parameters such as PET system resolution, lesion location, and tumor to background ratios or contrast and nonuniformity of tumor uptake. Moreover, further work is needed to optimize the algorithm’s performance through bet-
1323
S. Belhassen and H. Zaidi: Unsupervised segmentation of heterogeneous tumors in PET
ter understanding of the complex relationship between the PET scanner characteristics, mainly its spatial resolution and the resulting resolution blur, and lesion properties to optimize the selected additional features. V. CONCLUSION A novel unsupervised PET image segmentation technique allowing the quantification of lesions in the presence of heterogeneity of tracer uptake was developed and evaluated using the simulated phantom and clinical studies. The proposed FCM-based PET segmentation algorithm shows a clear improvement with respect to the standard FCM technique, allowing for substantial reduction in the relative error for both phantom and clinical studies. The selection of the most appropriate PET-based segmentation algorithm is crucial since it impacts both the volume and shape of the resulting GTV. The proposed PET segmentation technique may add considerably to conventional CT-guided GTV delineation in NSCLC and other malignancies. In spite of the promising results obtained so far, the additional impact on patient management and clinical outcome still needs to be determined. The technique is being further assessed in clinical setting using a larger sample of patients to delineate treatment volumes for the purpose of PET-guided radiation therapy treatment planning. Nevertheless, the method could find other applications such as assisting clinical diagnosis and the assessment of response to treatment. ACKNOWLEDGMENTS This work was supported by the Swiss National Science Foundation under Grant No. SNSF 3152A0-102143. The authors would like to thank Dr. El Naqa and Dr. Demirkaya for their help and advice, Professor Dekker and Professor De Ruysscher 共MAASTRO clinic, Maastricht兲 and Dr. Lee 共Université catholique de Louvain, Brussels兲 for providing the clinical PET data sets. a兲
Author to whom correspondence should be addressed. Electronic mail:
[email protected]; Telephone: ⫹41 22 372 7258; Fax: ⫹41 22 372 7169. 1 J. Czernin, M. Allen-Auerbach, and H. R. Schelbert, “Improvements in cancer staging with PET/CT: Literature-based evidence as of September 2006,” J. Nucl. Med. 48, 78S–88S 共2007兲. 2 C. Ling et al., “Towards multidimensional radiotherapy 共MD-CRT兲: Biological imaging and biological conformality,” Int. J. Radiat. Oncol., Biol., Phys. 47, 551–560 共2000兲. 3 V. Gregoire, K. Haustermans, X. Geets, S. Roels, and M. Lonneux, “PETbased treatment planning in radiotherapy: A new standard?,” J. Nucl. Med. 48, 68S–77S 共2007兲. 4 H. Zaidi and I. El Naqa, “PET-guided delineation of radiation therapy treatment volumes: A survey of image segmentation techniques,” Eur. J. Nucl. Med. Mol. Imaging 共in press兲. 5 M. E. Juweid and B. D. Cheson, “Positron-emission tomography and assessment of cancer therapy,” N. Engl. J. Med. 354, 496–507 共2006兲. 6 C. Greco, K. Rosenzweig, G. L. Cascini, and O. Tamburrini, “Current status of PET/CT for tumour volume definition in radiotherapy treatment planning for non-small cell lung cancer 共NSCLC兲,” Lung Cancer 57, 125–134 共2007兲. 7 A. van Baardwijk et al., “The current status of FDG-PET in tumour volume definition in radiotherapy treatment planning,” Cancer Treat Rev. 32, 245–260 共2006兲. 8 H. Vees, S. Senthamizhchelvan, R. Miralbell, D. Weber, O. Ratib, and H. Medical Physics, Vol. 37, No. 3, March 2010
1323
Zaidi, “Assessment of various strategies for 18F-FET PET-guided delineation of target volumes in high-grade glioma patients,” Eur. J. Nucl. Med. Mol. Imaging 36, 182–193 共2009兲. 9 D. Montgomery, A. Amira, and H. Zaidi, “Fully automated segmentation of oncological PET volumes using a combined multiscale and statistical model,” Med. Phys. 34, 722–736 共2007兲. 10 I. El Naqa et al., “Concurrent multimodality image segmentation by active contours for radiotherapy treatment planning,” Med. Phys. 34, 4738– 4749 共2007兲. 11 M. Hatt, C. Cheze le Rest, A. Turzo, C. Roux, and D. Visvikis, “A fuzzy locally adaptive Bayesian segmentation approach for volume determination in PET,” IEEE Trans. Med. Imaging 28, 881–893 共2009兲. 12 M. Soret, S. L. Bacharach, and I. Buvat, “Partial-volume effect in PET tumor imaging,” J. Nucl. Med. 48, 932–945 共2007兲. 13 S. Basu et al., “Novel quantitative techniques for assessing regional and global function and structure based on modern imaging modalities: Implications for normal variation, aging and diseased states,” Semin Nucl. Med. 37, 223–239 共2007兲. 14 F. Masulli and A. Schenone, “A fuzzy clustering based segmentation system as support to diagnosis in medical imaging,” Artif. Intell. Med. 16, 129–147 共1999兲. 15 D. L. Pham and J. L. Prince, “Adaptive fuzzy segmentation of magnetic resonance images,” IEEE Trans. Med. Imaging 18, 737–752 共1999兲. 16 H. Zaidi, M. Diaz-Gomez, A. O. Boudraa, and D. O. Slosman, “Fuzzy clustering-based segmented attenuation correction in whole-body PET imaging,” Phys. Med. Biol. 47, 1143–1160 共2002兲. 17 A. W. C. Liew and Y. Hong, “An adaptive spatial fuzzy clustering algorithm for 3-D MR image segmentation,” IEEE Trans. Med. Imaging 22, 1063–1075 共2003兲. 18 K.-S. Chuang, H.-L. Tzeng, S. Chen, J. Wu, and T.-J. Chen, “Fuzzy c-means clustering with spatial information for image segmentation,” Comput. Med. Imaging Graph. 30, 9–15 共2006兲. 19 J. Yu and Y. Wang, “Molecular image segmentation based on improved fuzzy clustering,” Int. J. Biomed. Imaging 2007 共2007兲. 20 J. Wang, J. Kong, Y. Lu, M. Qi, and B. Zhang, “A modified FCM algorithm for MRI brain image segmentation using both local and non-local spatial constraints,” Comput. Med. Imaging Graph. 32, 685–698 共2008兲. 21 P. D. Acton, L. S. Pilowsky, H. F. Kung, and P. J. Ell, “Automatic segmentation of dynamic neuroreceptor single-photon emission tomography images using fuzzy clustering,” Eur. J. Nucl. Med. 26, 581–590 共1999兲. 22 W. Chen, M. L. Giger, and U. Bick, “A fuzzy C-means 共FCM兲-based approach for computerized segmentation of breast lesions in dynamic contrast-enhanced MR images,” Acad. Radiol. 13, 63–72 共2006兲. 23 M. C. Clark et al., “MRI segmentation using fuzzy clustering techniques,” IEEE Eng. Med. Biol. Mag. 13, 730–742 共1994兲. 24 A. E. Boudraa et al., “Delineation and quantitation of brain lesions by fuzzy clustering in positron emission tomography,” Comput. Med. Imaging Graph. 20, 31–41 共1996兲. 25 W. Zhu and T. Jiang, “Automation segmentation of PET image for brain tumors,” IEEE Nuclear Science Symposium Conference Record, 2003, Vol. 4, pp. 2627–2629. 26 J. Kim, L. Wen, S. Eberl, R. Fulton, and D. D. Feng, “Use of anatomical priors in the segmentation of PET lung tumor images,” IEEE Nuclear Science Symposium Conference Record, 2007, Vol. 6, pp. 4242–4245. 27 A. W. C. Liew, S. H. Leung, and W. H. Lau, “Fuzzy image clustering incorporating spatial continuity,” IEEE Proc. Vision Image Signal Process 147, 185–192 共2000兲. 28 D. L. Pham, “Spatial models for fuzzy clustering,” Comput. Vis. Image Underst. 84, 285–297 共2001兲. 29 M. N. Ahmed, S. M. Yamany, N. Mohamed, A. A. Farag, and T. Moriarty, “A modified fuzzy c-means algorithm for bias field estimation and segmentation of MRI data,” IEEE Trans. Med. Imaging 21, 193–199 共2002兲. 30 S. Chen and D. Zhang, “Robust image segmentation using FCM with spatial constraints based on new kernel-induced distance measure,” IEEE Trans. Syst., Man, Cybern., Part B: Cybern. 34, 1907–1916 共2004兲. 31 J. Kang, L. Min, Q. Luan, X. Li, and J. Liu, “Novel modified fuzzy c-means algorithm with applications,” Digit. Signal Process. 19, 309–319 共2009兲. 32 S. R. Kannan, “A new segmentation system for brain MR images based on fuzzy techniques,” Appl. Soft Comput. 8, 1599–1606 共2008兲. 33 P. Congdon, Bayesian Statistical Modelling, 2nd ed. 共Wiley, West Sussex, 2007兲.
1324
S. Belhassen and H. Zaidi: Unsupervised segmentation of heterogeneous tumors in PET
34
S. S. Chen and P. S. Gopalakrishnan, “Clustering via the Bayesian information criterion with applications in speech recognition,” Proceedings of the IEEE International Conference on Acoustics, Speech and Signal Processing, 1998, Vol. 2, pp. 645–648. 35 J. C. Dunn, “A fuzzy relative of the ISODATA process and its use in detecting compact well-separated clusters,” IEEE Trans. Syst. Man Cybern. 3, 32–57 共1973兲. 36 J. Bezdek, R. Hathaway, M. Sabin, and W. Tucker, “Convergence theory for fuzzy c-means: Counterexamples and repairs,” IEEE Trans. Syst. Man Cybern. 17, 873–877 共1987兲. 37 J. Bezdek, “A convergence theorem for the fuzzy ISODATA clustering algorithms,” IEEE Trans. Pattern Anal. Mach. Intell. PAMI-2, 1–8 共1980兲. 38 P. Perona and J. Malik, “Scale-space and edge detection using anisotropic diffusion,” IEEE Trans. Pattern Anal. Mach. Intell. 12, 629–639 共1990兲. 39 J. Weickert, Anisotropic Diffusion in Image Processing 共TeubnerStuttgart, Stuttgart, Germany, 1998兲. 40 J. F. Canny, “A computational approach to edge detection,” IEEE Trans. Pattern Anal. Mach. Intell. PAMI-8, 679–698 共1986兲. 41 O. Demirkaya, “Post-reconstruction filtering of positron emission tomography whole-body emission images and attenuation maps using nonlinear diffusion filtering,” Acad. Radiol. 11, 1105–1114 共2004兲. 42 A. Rahmim, J. Tang, and H. Zaidi, “Four-dimensional 共4D兲 image reconstruction strategies in dynamic PET: Beyond conventional independent frame reconstruction,” Med. Phys. 36, 3654–3670 共2009兲. 43 M. J. Shensa, “The discrete wavelet transform: Wedding the a trous and Mallat algorithms,” IEEE Trans. Signal Process. 40, 2464–2482 共1992兲. 44 J. L. Starck and A. Bijaoui, “Filtering and deconvolution by the wavelet transform,” Signal Process. 35, 195–211 共1994兲. 45 M. Holschneider, R. Kronland-Martinet, J. Morlet, and A. Grossmann, in Wavelets, Time-Frequency Methods and Phase Space, edited by A. Grossmann, J. M. Combes, and Ph. Tchamitchian 共Springer-Verlag, Berlin, 1989兲, pp. 286–297. 46 J.-L. Starck, F. Murtagh, and A. Bijaoui, Image Processing and Data Analysis 共Cambridge University Press, Cambridge, 1998兲. 47 A. Bijaoui, J.-L. Starck, and F. Murtagh, “Restauration des images multiéchelles par l’algorithme à trous,” Trait. Signal 3, 229–243 共1994兲. 48 D. W. G. Montgomery, A. Amira, and F. Murtagh, “An automated volumetric segmentation system combining multiscale and statistical reasoning,” IEEE International Symposium on Circuits and Systems 共ISCAS 2005兲, Kobe, Japan, 23–26 May 2005, Vol. 4, pp. 3789–3792. 49 W. P. Segars, D. S. Lalush, and B. M. W. Tsui, “Modeling respiratory mechanics in the MCAT and spline-based MCAT phantoms,” IEEE Trans. Nucl. Sci. 48, 89–97 共2001兲. 50 L. Tan and K. Ong, “Semi-quantitative measurements of normal organs
Medical Physics, Vol. 37, No. 3, March 2010
1324
with variable metabolic activity on FDG PET imaging,” Ann. Acad. Med. Singapore 33, 183–185 共2004兲. 51 A. van Baardwijk et al., “PET-CT-based auto-contouring in non-smallcell lung cancer correlates with pathology and reduces interobserver variability in the delineation of the primary tumor and involved nodal volumes,” Int. J. Radiat. Oncol., Biol., Phys. 68, 771–778 共2007兲. 52 J. F. Daisne et al., “Tumor volume in pharyngolaryngeal squamous cell carcinoma: Comparison at CT, MR imaging, and FDG PET and validation with surgical specimen,” Radiology 233, 93–100 共2004兲. 53 X. Geets, J. Lee, A. Bol, M. Lonneux, and V. Gregoire, “A gradient-based method for segmenting FDG-PET images: Methodology and validation,” Eur. J. Nucl. Med. Mol. Imaging 34, 1427–1438 共2007兲. 54 J. F. Daisne et al., “Evaluation of a multimodality image 共CT, MRI and PET兲 coregistration procedure on phantom and head and neck cancer patients: Accuracy, reproducibility and consistency,” Radiother. Oncol. 69, 237–245 共2003兲. 55 S. Belhassen et al., “Comparative methods for 18F-FDG PET-based delineation of target volumes in non-small-cell lung cancer 关abstract兴,” J. Nucl. Med. 50, 27P 共2009兲. 56 H. Zaidi, H. Vees, and M. Wissmeyer, “Molecular PET/CT imagingguided radiation therapy treatment planning,” Acad. Radiol. 16, 1108– 1133 共2009兲. 57 J. A. Boucek et al., “Assessment of tumour response with 18Ffluorodeoxyglucose positron emission tomography using 3-dimensional measures compared to SUVmax—A phantom study,” Phys. Med. Biol. 53, 4213–4230 共2008兲. 58 J. F. Daisne et al., “Tri-dimensional automatic segmentation of PET volumes based on measured source-to-background ratios: Influence of reconstruction algorithms,” Radiother. Oncol. 69, 247–250 共2003兲. 59 J. K. Udupa and P. K. Saha, “Fuzzy connectedness and image segmentation,” Proc. IEEE 91, 1649–1669 共2003兲. 60 M. H. Janssen et al., “Tumor delineation based on time-activity curve differences assessed with dynamic fluorodeoxyglucose positron emission tomography-computed tomography in rectal cancer patients,” Int. J. Radiat. Oncol., Biol., Phys. 73, 456–465 共2009兲. 61 M. Aristophanous, B. C. Penney, M. K. Martel, and C. A. Pelizzari, “A Gaussian mixture model for definition of lung tumor volumes in positron emission tomography,” Med. Phys. 34, 4223–4235 共2007兲. 62 M. Aristophanous, B. C. Penney, and C. A. Pelizzari, “The development and testing of a digital PET phantom for the evaluation of tumor volume segmentation techniques,” Med. Phys. 35, 3331–3342 共2008兲. 63 J. Stroom et al., “Feasibility of pathology-correlated lung imaging for accurate target definition of lung tumors,” Int. J. Radiat. Oncol., Biol., Phys. 69, 267–275 共2007兲.